The US BizAv (Business Aviation) market has been booming since March 2021. This series of articles track the traffic trend of this market. We define the BizAv market as part-135 on-demand for-hire private flying by business jets or certain turboprop planes. The numbers in the following charts exclude part-91 private flights. If you are interested in all flights by business jets, or detailed flights by route and operator, please get in touch with us.
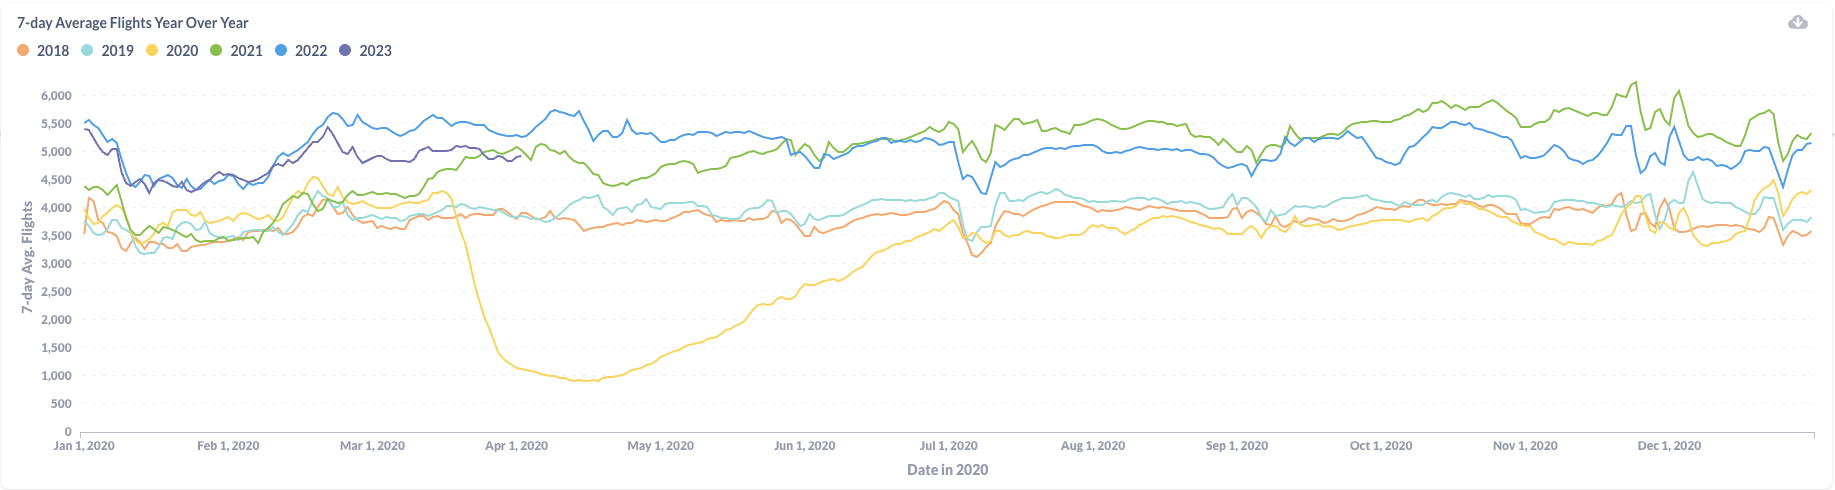
Figure 1: Year over Year Trend of the U.S. BizAv Market
Figure 1 illustrates that U.S. BizAv traffic in March 2023 consistently fell short of the previous year’s levels. Despite an increase in the average daily business flights to 4,976 compared to February 2023, the traffic trend remained relatively flat when juxtaposed against the previous year’s performance.
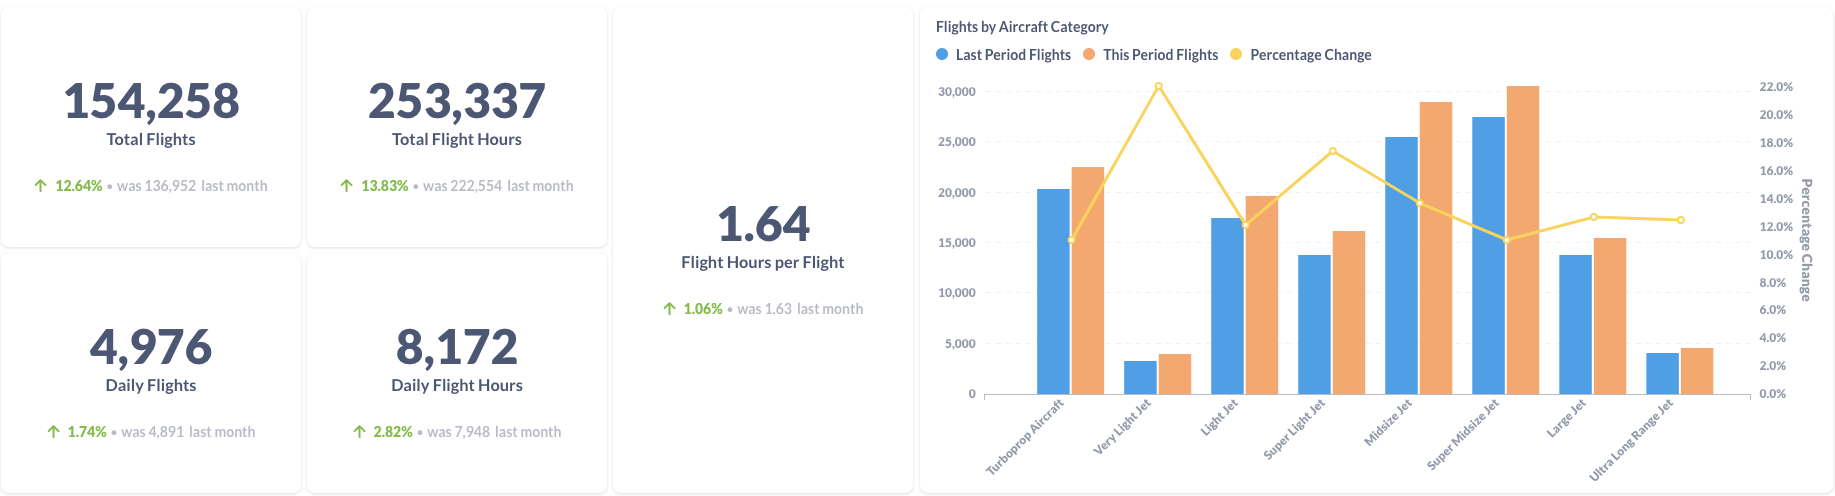
Figure 2: Comparison of the U.S. BizAv Flights This Month vs. Last Month
Figure 2 compares flight data between March 2023 and February 2023, highlighting an increase in total flights and total flight hours by 12.6% and 13.8% respectively. This growth can be attributed primarily to the three additional days in March compared to February, although daily flights and hours per flight also experienced growth. Flights increased across all aircraft categories, with the Very Light Jet category witnessing the most significant increase of 22.1%. The Super Light Jet category saw a 17.4% increase, while other categories experienced percentage changes ranging from 11.0% to 13.7%.
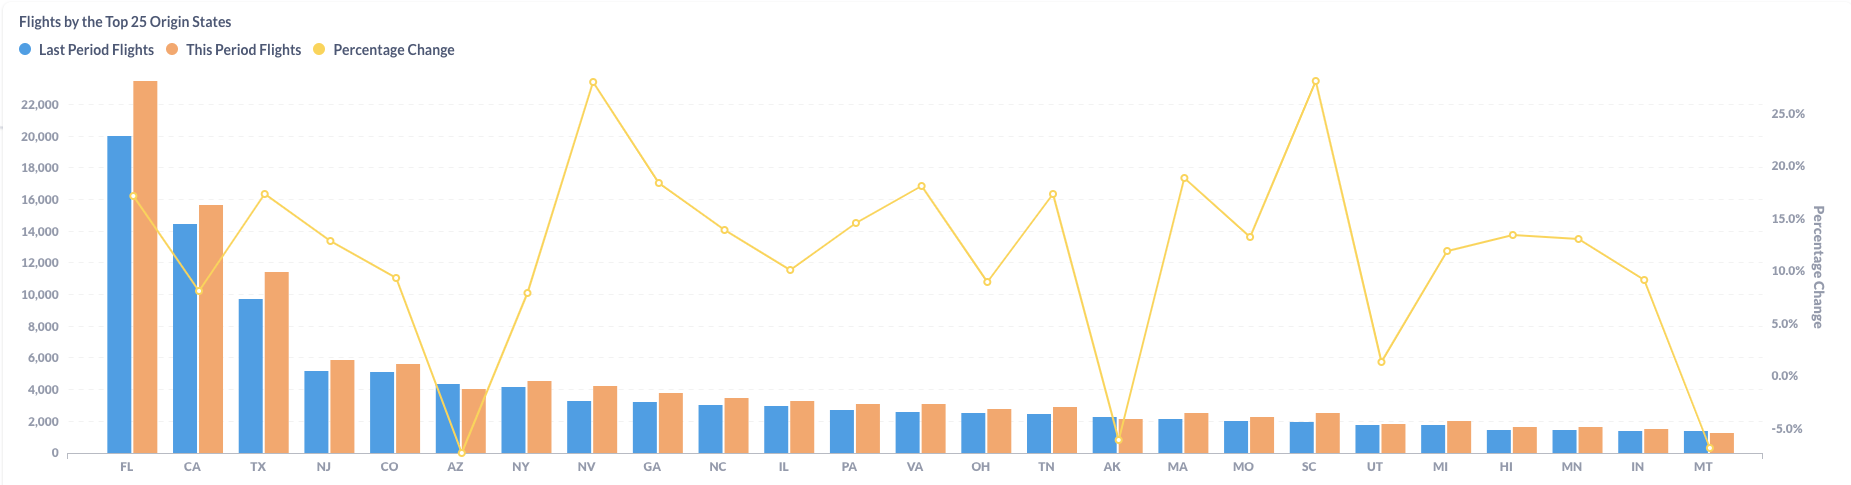
Figure 3: Comparison of the U.S. BizAv Flights by the Top 25 Origin States (This Month vs. Last Month)
Between February and March 2023, most states in the US experienced an increase in the number of flights. The largest increases were observed in South Carolina (28.1%), Nevada (28.0%), and Georgia (18.4%). Florida had the highest number of flights in both periods, with 20,057 flights in February and 23,502 flights in March, representing a 17.2% increase. Some states experienced a decrease in flights, such as Arizona (-7.3%) and Alaska (-6.0%), while Montana experienced a 6.8% decrease.
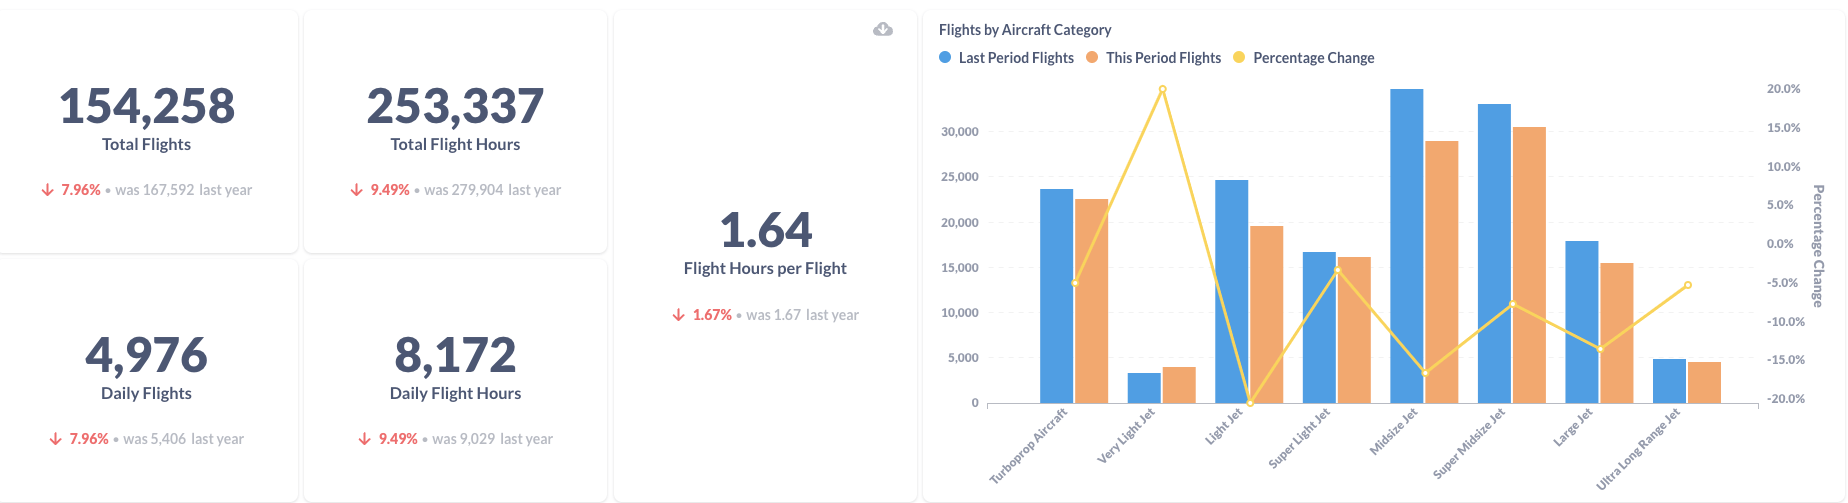
Figure 4: Comparison of the U.S. BizAv Flights This Year vs. Last Year
Compared to March 2022, total business flights in March 2023 decreased by 7.96%. Total flight hours dropped by 9.49% because the average flight hours per flight also shrank by 1.67%. Most aircraft categories experienced a decrease in the number of flights, with the exception of Very Light Jets, which saw a significant increase. Turboprop Aircraft, Light Jets, Super Light Jets, Midsize Jets, Super Midsize Jets, Large Jets, and Ultra Long Range Jets all experienced declines in varying degrees. The most notable decrease was observed in the Light Jet category, while the smallest decrease occurred in the Super Light Jet category.
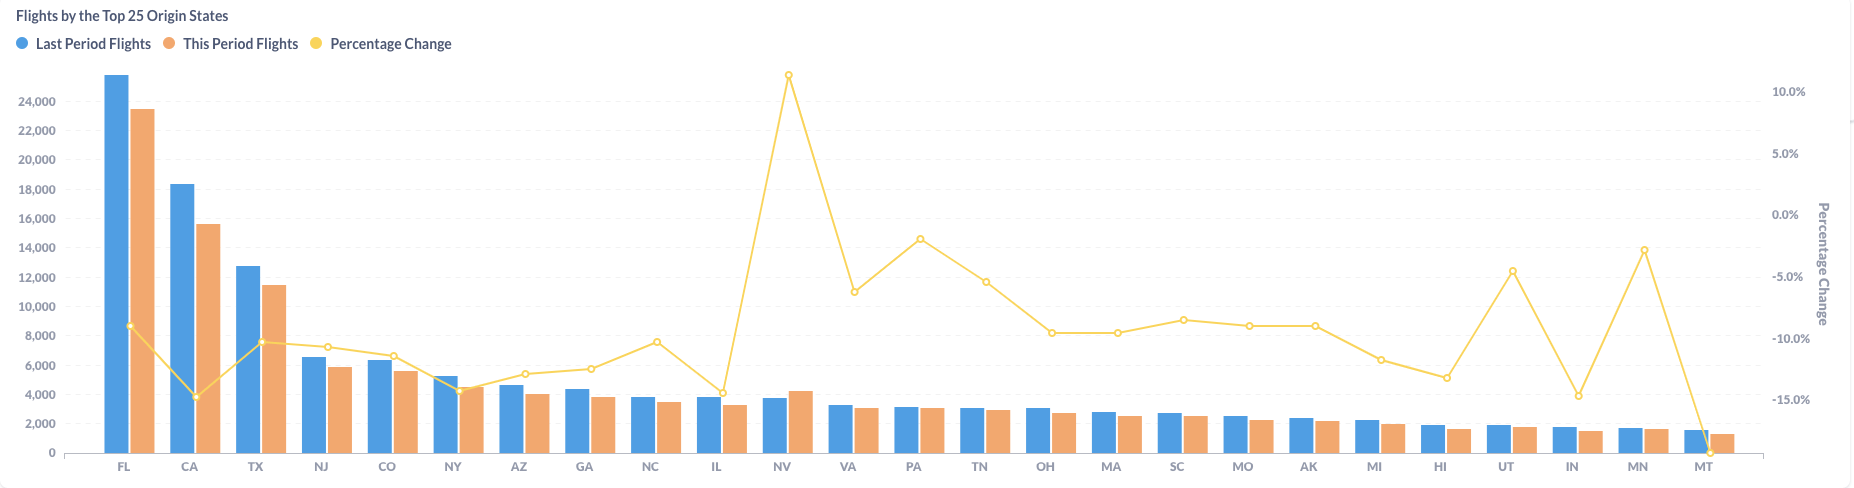
Figure 5: Comparison of the U.S. BizAv Flights by the Top 25 Origin States (This Year vs. Last Year)
Comparing flight data from March 2022 to March 2023, most states in the US experienced a decrease in the number of flights. The largest decreases were observed in Montana (-19.3%), Indiana (-14.7%), and Illinois (-14.4%). Florida maintained the highest number of flights in both periods, with 25,831 flights in March 2022 and 23,502 flights in March 2023, representing a 9.0% decrease. Nevada was an exception, with an increase in flights of 11.4% from 3,805 in March 2022 to 4,238 in March 2023.