
Fligence Catchment – MX
About the Dataset
Fligence Catchment extends beyond the United States. For Mexican airports, our municipality-level Origin & Destination (O&D) dataset provides an unprecedented view of air travel demand by municipality in Mexico and ZIP code in the U.S.
Using anonymized mobile device movement, census and hotel data, we track the true origins of residents and the destinations of visitors—mapped precisely to municipality / ZIP codes. With this tool, Mexican airport stakeholders can make data-driven decisions to enhance air service development, marketing, and infrastructure planning.
Know Your Catchment, Down to the Municipality or ZIP code
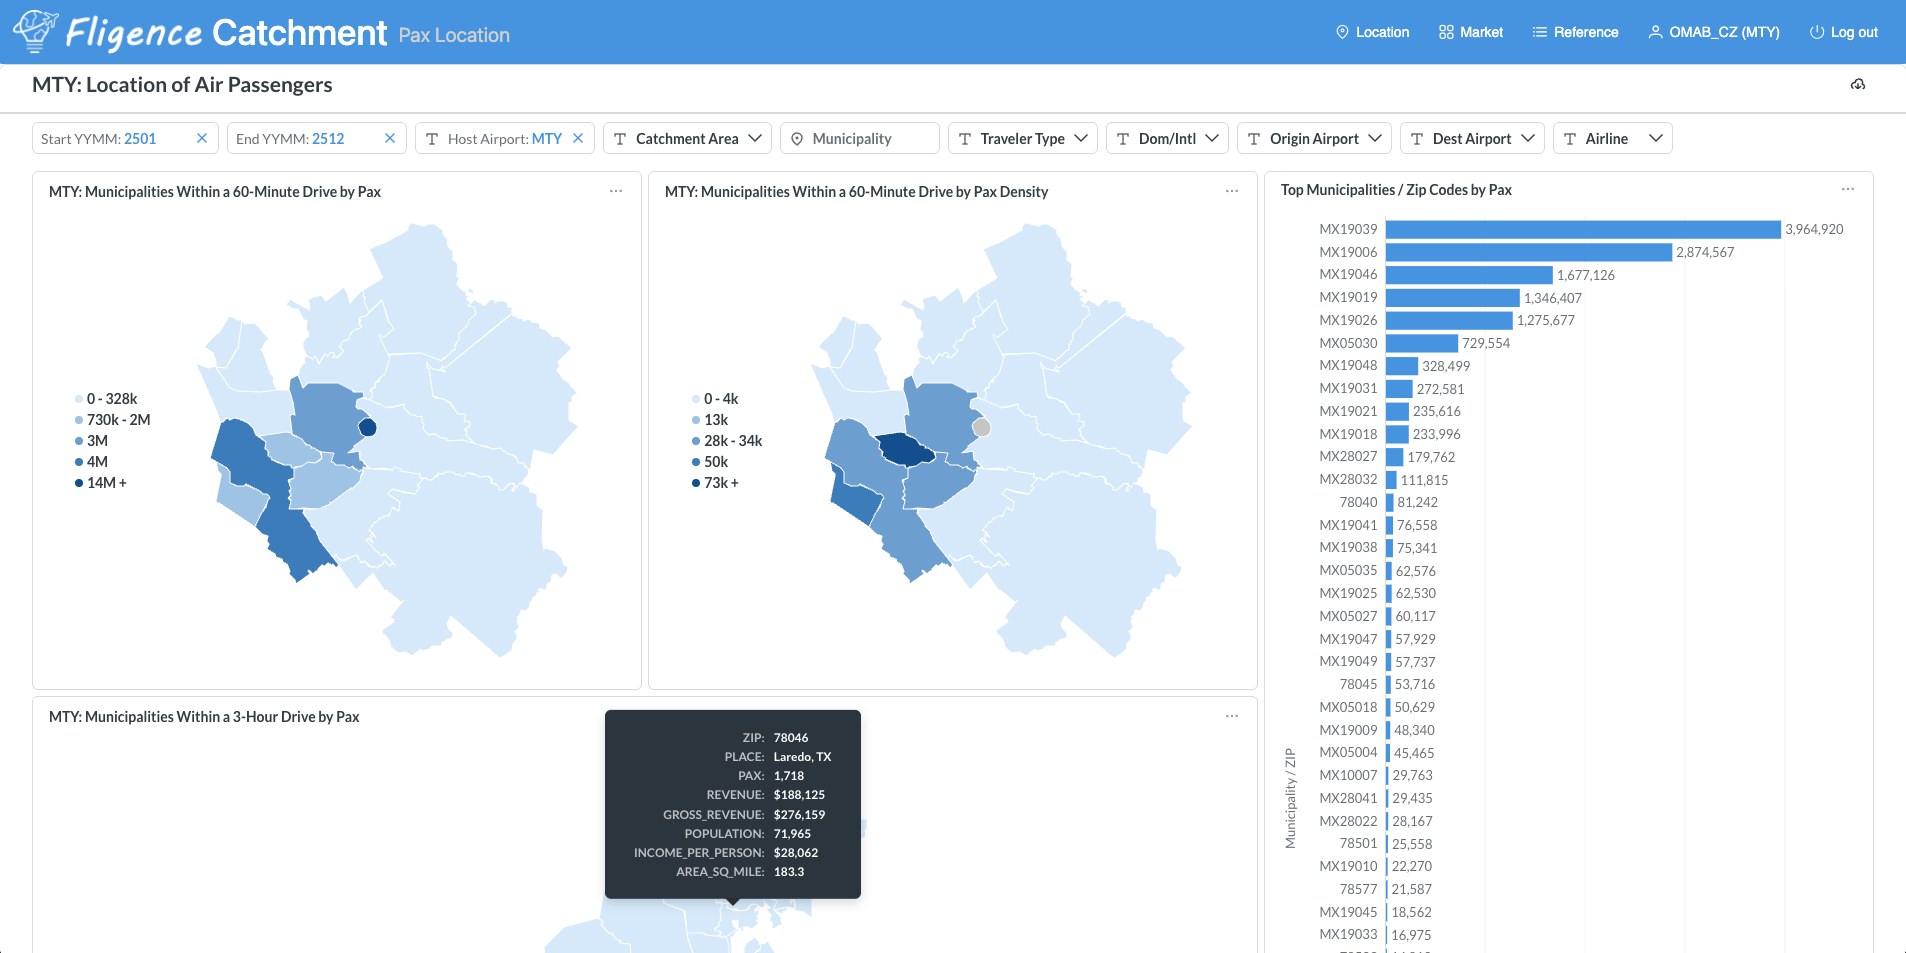
With detailed municipality/ZIP-level breakdowns, you can now pinpoint which local areas generate the most outbound travelers and identify where inbound visitors are staying. This allows you to clearly distinguish between residents and visitors using your airport. These insights help you tailor your outreach to airlines and local communities, justify route expansion, and optimize your airport’s connectivity strategy.
Measure Leakage to Competing Airports
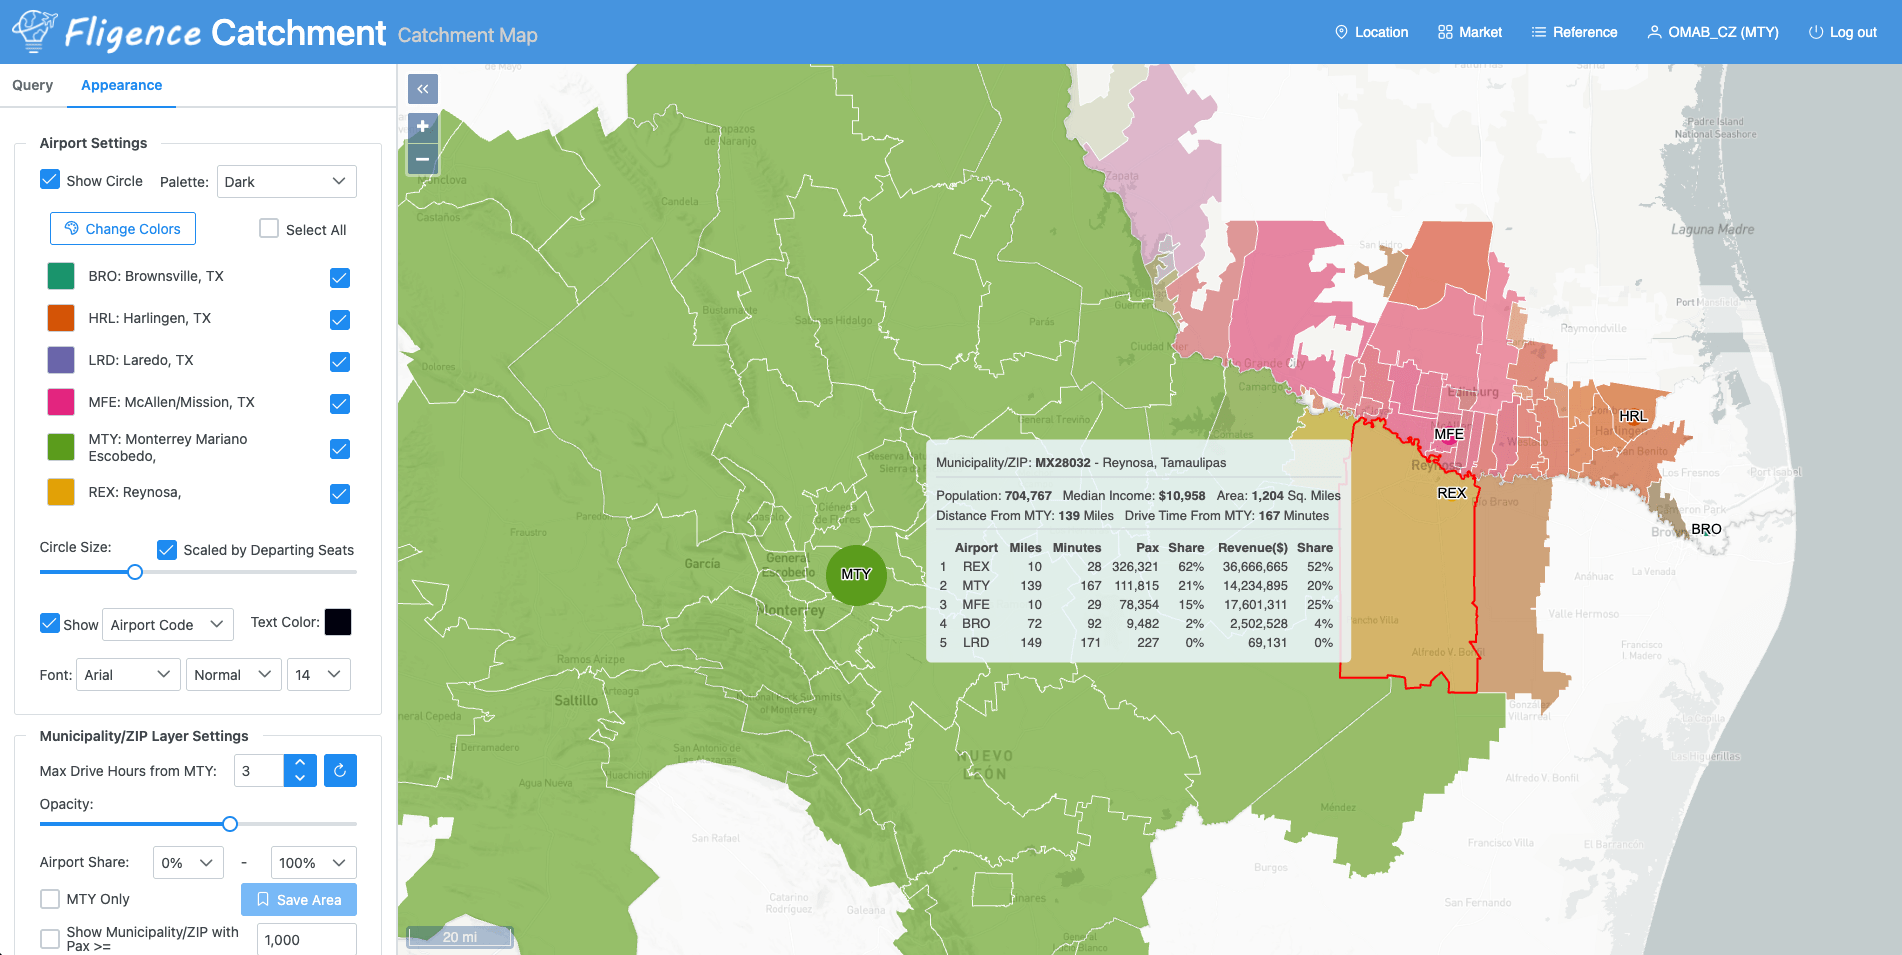
By comparing traffic volumes across airports near a given municipality, the platform also helps identify areas where passengers may be leaking to competing airports. This empowers you to assess your airport’s true catchment area, tailor retention strategies, and strengthen your case when working with airlines to expand or protect routes.
Cross-border Catchment & Leakage
Using insights from Fligence Catchment, Mexican airports located along the U.S.–Mexico border can move beyond traditional domestic targeting and instead identify exactly where U.S. travelers originate, how they travel, and which competing airports they currently use. By leveraging ZIP-level origin–destination data, mobile movement patterns, and leakage analysis, airports can pinpoint high-value U.S. catchment pockets—such as border cities or secondary metropolitan areas—where travelers are already willing to cross the border for better fares or connectivity. These insights allow airports to quantify “leakage” from U.S. airports (e.g., passengers driving to Mexican airports for international flights), enabling highly targeted marketing campaigns, airline incentives, and route development strategies tailored to those specific micro-markets. For example, identifying underserved O&D demand from U.S. ZIP codes can support new cross-border routes or increased frequencies, while understanding behavioral patterns—such as price sensitivity or willingness to travel longer distances—helps position the Mexican airport as a competitive alternative.
Visualize Demand Trends Over Time
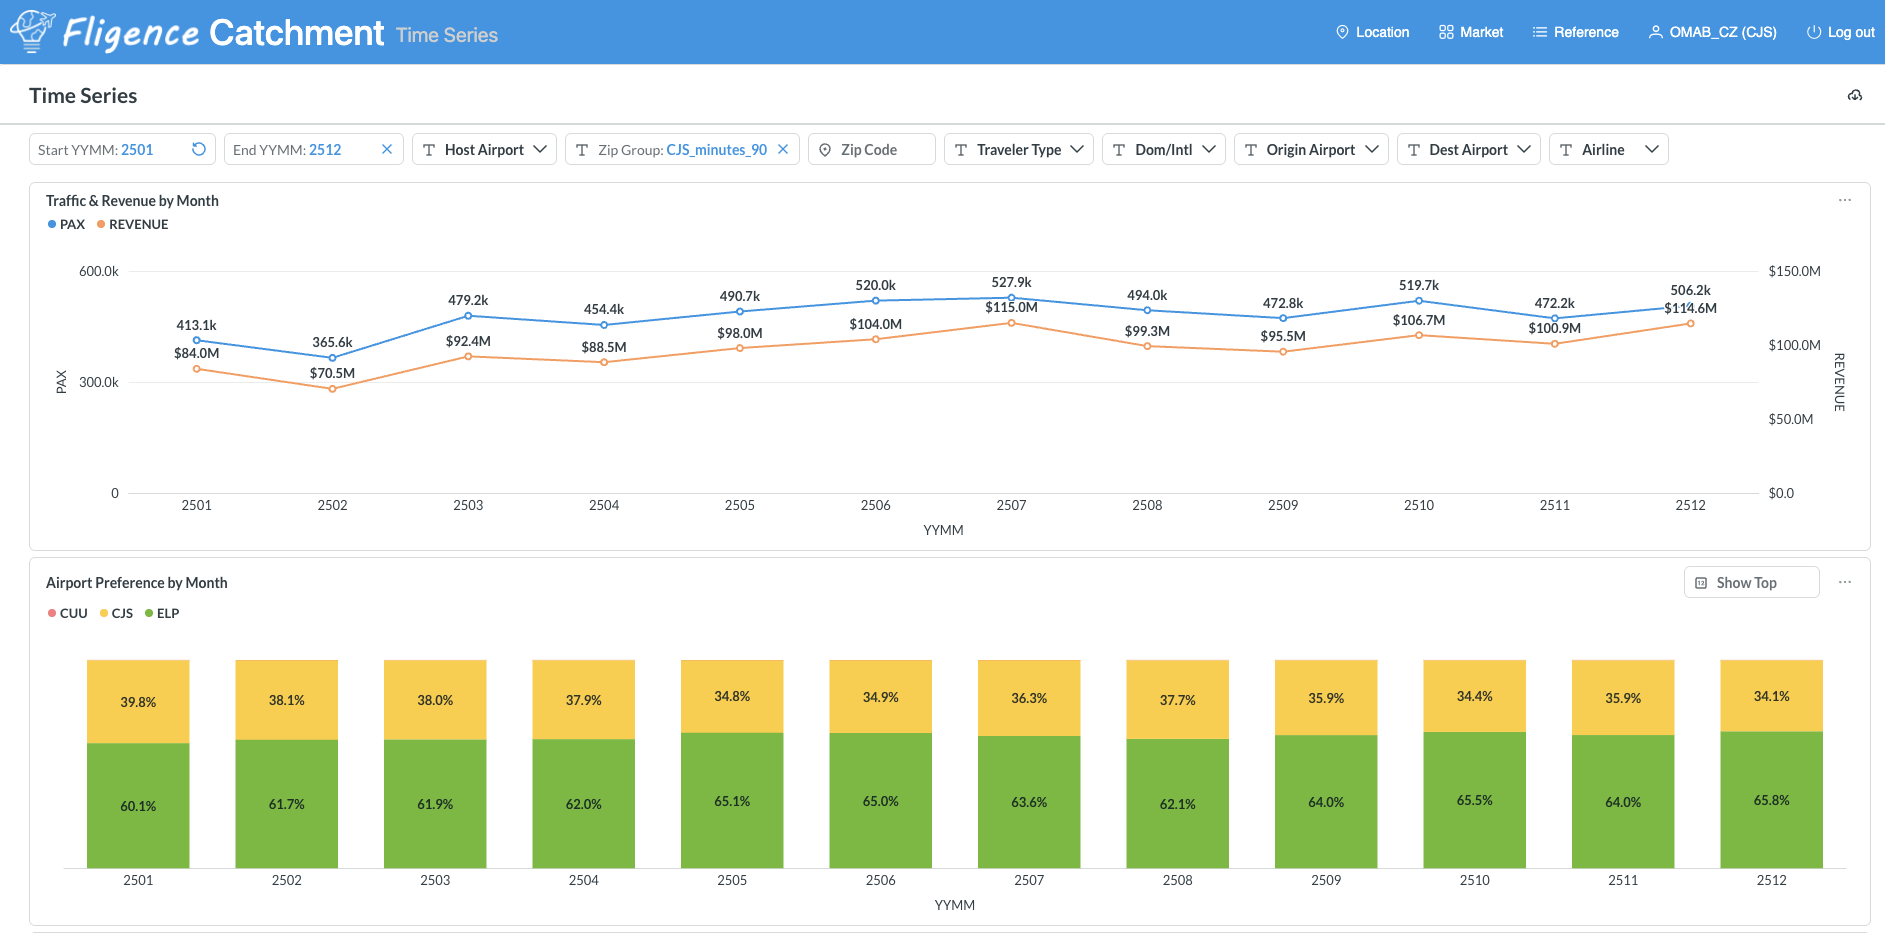
The platform also features interactive time series visualizations, allowing you to track O&D volume and revenue trends by municipality / ZIP code across months or years. Whether you want to monitor recovery in key markets, evaluate the impact of marketing campaigns, or identify seasonal demand shifts, our tool gives you the granularity and flexibility you need to act with confidence.
Want to see what your airport’s catchment really looks like? Contact us today for a personalized walkthrough of the platform and dataset.