Traffic and fare data by airline and route can provide valuable insights into market trends, demand, and competition. By analyzing this data, airlines can optimize their pricing strategies, plan their capacity, and make informed decisions about their route network. The data can also be used for market and competitive analysis, helping airlines identify profitable routes and gain a competitive advantage.
According to preliminary true O&D level data released by FlightBI this week, the air traffic decreased from January 2023 to February 2023 because February has 3 days less than January. Specifically, US domestic passenger volume decreased by 5%, and the average domestic airfare increased by 1.5%.
Volume Trend
According to the true O&D data, US domestic traffic witnessed an decrease from 45.5 million passengers in January to 43.2 million in February 2023, which is slightly lower than the pre-pandemic level of 43.4 million in February 2020. Additionally, US international traffic also decreased from 17.2 million in January to 14.4 million in February.
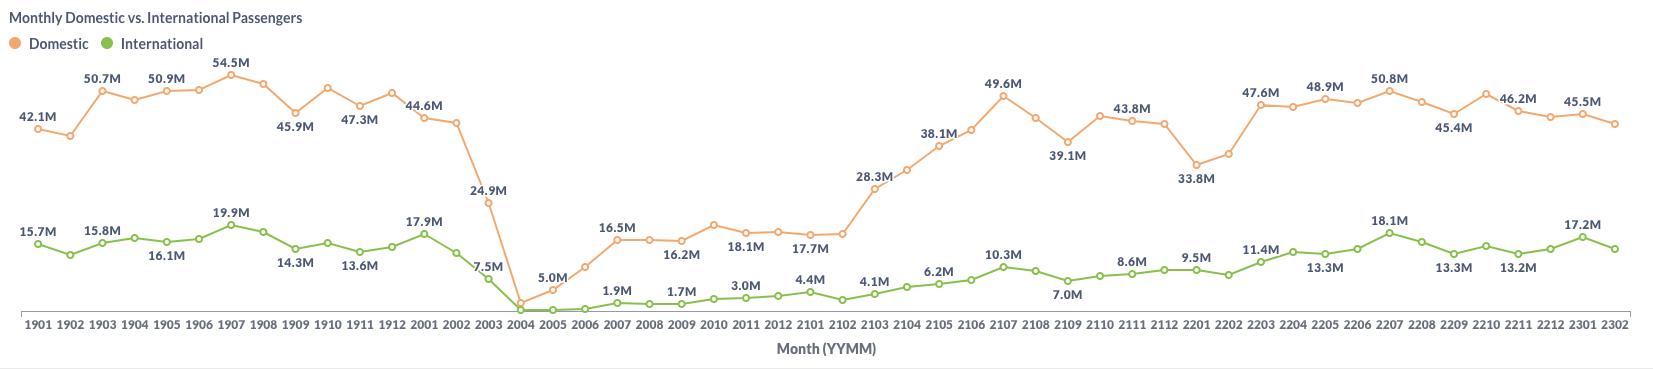
Figure 1: US Domestic and International Air Traffic by Month
Airfare Trend
The average domestic gross fare for air travel increased from $206 in January to $209 in February, and the average net fare also increased from $178 to $180 over the same period.
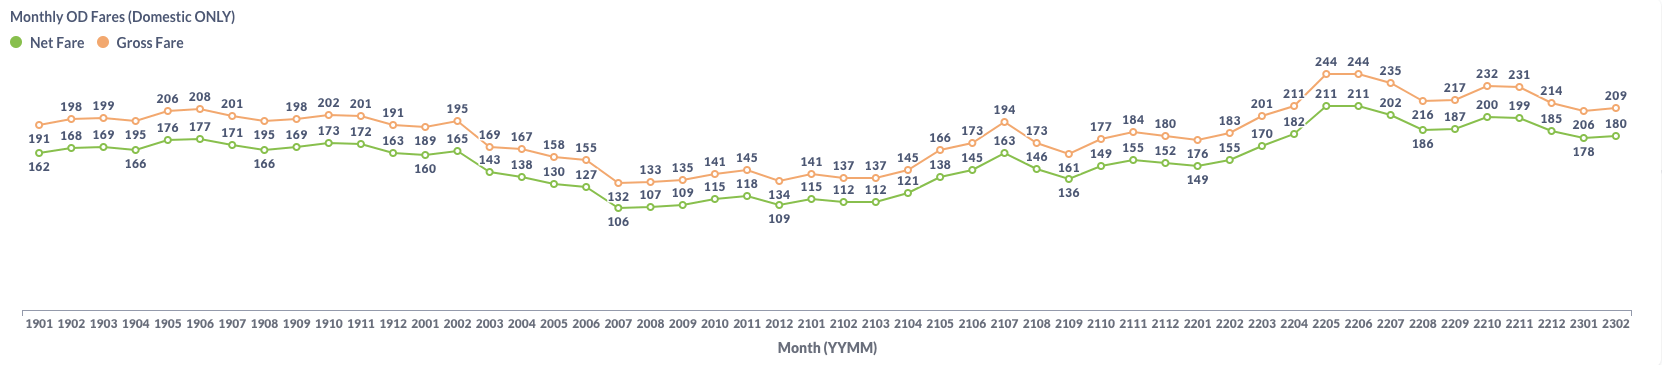
Figure 2: US Domestic Average Airfare by Month
The correlation relationship between airfare and jet fuel price is not strong recently. As depicted in the chart below provided by EIA, the price of jet fuel decreased from January 2023 to February 2023.
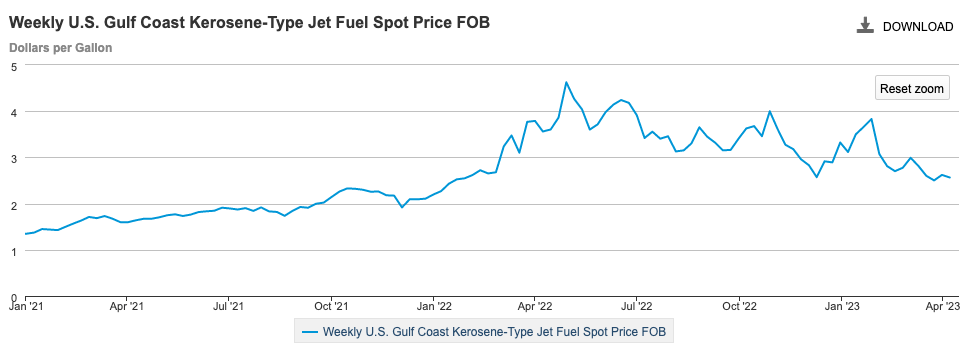
Figure 3: US Jet Fuel Price
Load Factor Trend
In February, the average load factor dropped to 74.8%, similar to that in January. As depicted in Figure 4 below, both demand and supply decreased. Southwest still had lower load factors than other airlines because of sequelae of the scheduling crisis in last winter.
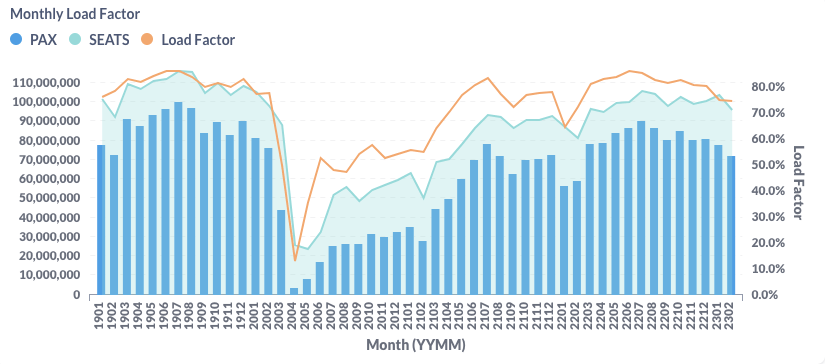
Figure 4: US Airlines’ Average Load Factor by Month
Month Over Month Comparison
During the period from January 2023 to February 2023, most airlines achieved higher daily traffic except Hawaiian (HA) and Spirit (NK). Allegiant (G4) and American (AA) witnessed a healthy growth in daily traffic at 7.7% and 7.6%, respectively. Meanwhile, Hawaiian (HA) experienced a 4.2% decrease in daily traffic.
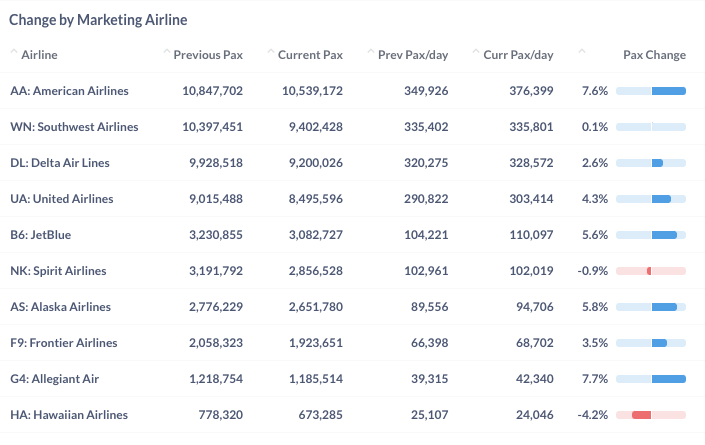
Figure 5: Air Traffic by Dominant Marketing Airlines in January 2023 (Previous) vs. February 2023 (Current)
In February 2023, most top airports saw an increase in daily traffic compared to January. Boston (BOS), Dallas/Fort Worth (DFW), and Seattle (SEA) experienced 7.2%, 6.0%, and 5.2% growth in daily traffic during this period. Conversely, Ft Lauderdale (FLL), Miami (MIA) and Las Vegas (LAS) had slightly decrease in daily traffic.
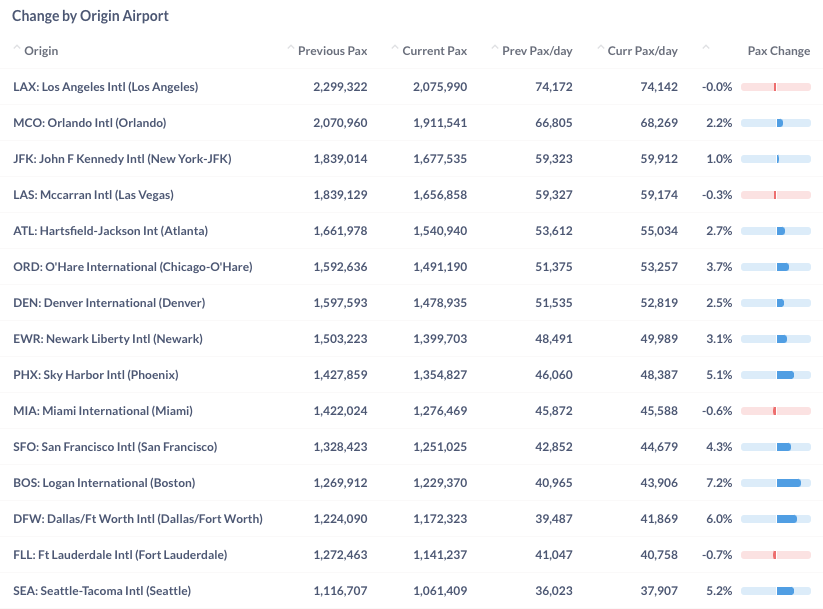
Figure 6: Air Traffic by Top Origin Airports in January 2023 (Previous) vs. February 2023 (Current)
Year Over Year Comparison
Compared to the same month last year, all major US airlines witnessed positive growth in February 2023. Among them, Hawaiian (HA), United (UA), and JetBlue (B6) achieved the highest year-over-year growth rate of 32.0%, 31.6%, and 28.8%, respectively, leading the growth among major US airlines.
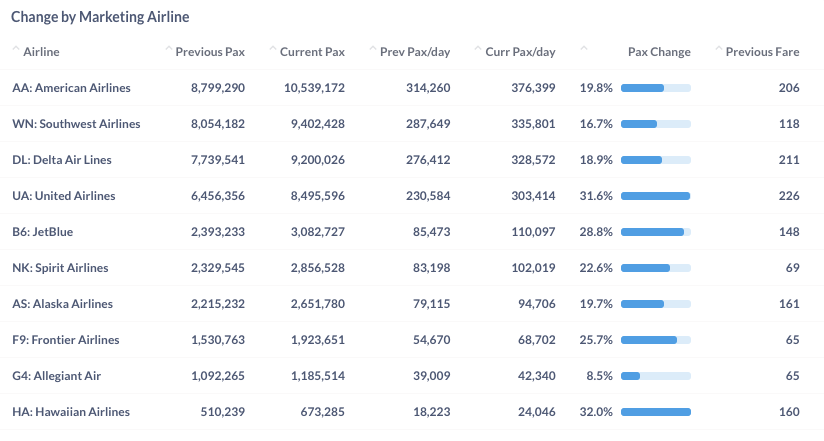
Figure 7: Air Traffic by Dominant Marketing Airlines in February 2023 (Current) vs. February 2022 (Previous)
The growth of top airports from February 2022 to February 2023 has been great, with all top airports except Miami (MIA) achieving double-digit growth. Among them, San Francisco (SFO) and New York (JFK) airports led the year-over-year growth, with 52.3% and 42.3%, respectively.
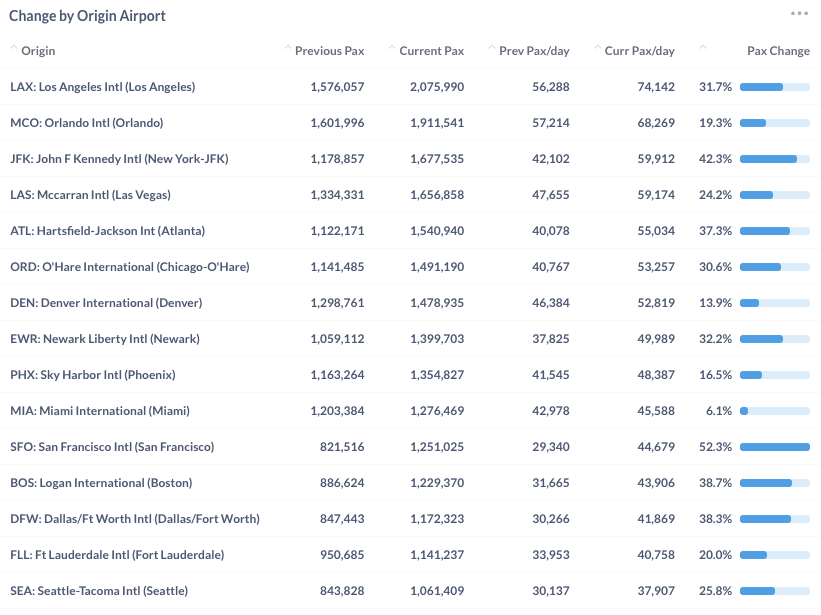
Figure 8: Air Traffic by Top Origin Airport in February 2023 (Current) vs. February 2022 (Previous)
For more detailed information on traffic and fares by route and airline, please contact service@flightbi.com or request a demo of Fligence USOD. They will be able to provide you with customized information to meet your specific needs and requirements.