
Airport catchment analysis should answer more than where airport visitors were observed or where airline tickets were purchased. For air service development, an airport needs to know where passengers begin or end their trips, which airport they choose, where they fly, how much traffic leaks to competitors, and how those patterns change by route and over time.
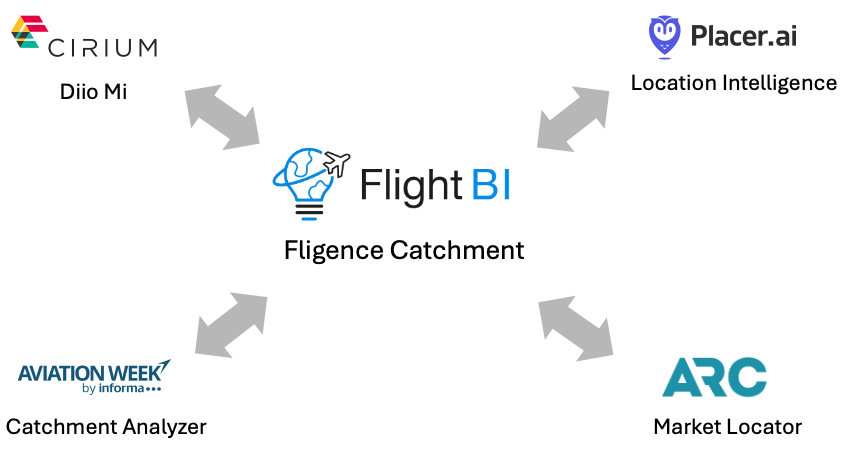
Five platforms often considered for airport market analysis are FlightBI Fligence Catchment/ZIP-OD, Cirium Diio Mi, Placer.ai, Aviation Week Catchment Analyzer, and ARC Market Locator. Diio Mi is included because it is widely used by U.S. airport air service development teams, even though its primary role is airline schedule, airport-to-airport traffic, fare, and route analysis—not behavioral catchment and leakage analysis. The five products overlap in some workflows, but they are built for different questions.
Quick answer: Which airport catchment tool is best?
Fligence Catchment is the strongest fit for airports that need ZIP-level passenger demand, route-level leakage, airport market share, resident-versus-visitor analysis, and aviation-calibrated results in one platform. Its U.S. product, Fligence ZIP-OD, combines anonymized mobile movement and hospitality data with airline ticketing and onboard passenger data. This design links observed geography to the aviation facts required for air service development.
The other platforms have clear strengths. Aviation Week Catchment Analyzer combines search, census, hospitality, airport, DOT, and MIDT inputs. Cirium Diio Mi is a leading aviation market-intelligence tool for schedules, capacity, airport-to-airport O&D traffic, fares, QSI, and route planning. Placer.ai is strong for general location intelligence, airport visitation, audience movement, and trade-area analysis. ARC Market Locator is useful for studying U.S. air-ticket purchases and booking behavior in ARC-participating distribution channels.
The right choice therefore depends on whether the airport needs aviation demand and ZIP-level leakage, search-informed market intelligence, airport-to-airport market and schedule analysis, general foot-traffic analysis, or agency-ticket purchase analysis.
Airport catchment analysis tools compared
| Platform | Published core data | Geographic capability | Aviation O&D context | Best fit | Main consideration |
|---|---|---|---|---|---|
| FlightBI Fligence Catchment / ZIP-OD | Anonymized mobile movement, hospitality, airline ticketing, census and segment/onboard passenger data | U.S. ZIP code; additional Fligence products use Canadian CSD, Mexican municipality, and European LAU geography | Yes; traffic, premium vs. regular passengers, destination, airline, fare/revenue, resident/visitor, and competing-airport analysis | Airport air service development, route-specific catchment, leakage recapture, airline presentations, and targeted marketing | Mobile samples require aviation calibration; users should confirm coverage, update timing, and methodology for their market |
| Cirium Diio Mi | Global schedules, capacity, U.S. and global O&D traffic estimates, fares, US DOT data, and other aviation datasets | Primarily airport, airport-city market, country, region, and point-of-sale geography | Extensive airport-to-airport O&D, itinerary, airline, fare, capacity, QSI, and route-performance analysis | Core air service development, airline schedules, market sizing, route opportunities, competitive capacity, and airline presentations | Not a behavioral ZIP-level catchment and leakage platform; airport-to-airport traffic does not identify which local ZIP generated each passenger or quantify ZIP-level diversion to competing airports |
| Placer.ai | Privacy-preserving mobile-device panel, visit estimates, property polygons, census and other audience datasets | Place, trade-area, and visitor-origin analysis | No; no published airline ticket, itinerary, fare, or route-demand calibration was used | Airport visitation, terminal-area movement, tourism, commercial development, audience profiling, and non-aviation trade-area questions | Not specifically for aviation customers; no aviation data calibration; vulnerable to mobile data panel changes |
| Aviation Week Catchment Analyzer | Internet search, census, hospitality, and MIDT data | ZIP/postcode-level analysis, depending on market | Yes; published features include routing, airline, destination, leakage, market share, and trends | Airports wanting an established aviation-industry platform that blends search intelligence with passenger datasets | Search activity measures shopping intent rather than completed travel; MIDT is from agent channels and lack airline-direct and low-cost-carrier bookings |
| ARC Market Locator | ARC-settled U.S. airline ticket transactions and associated purchaser/traveler geography and behavior | U.S. ZIP-level analysis | Yes; ticket purchase, itinerary, carrier, market, and booking behavior within the covered sample | Purchase-pattern analysis, geographic marketing, forward bookings, and leakage analysis within ARC-covered sales | Agency-settled data is a channel sample, not a census of all passengers; airline-direct and nonparticipating-carrier sales may be absent, while corporate billing geography may differ from traveler residence |
Comparison based on publicly available vendor information reviewed August 13, 2026. Product coverage and methodology can change; buyers should validate current specifications directly with each vendor.
1. FlightBI Fligence Catchment and ZIP-OD
Fligence ZIP-OD is designed specifically for airport catchment and leakage analysis. The platform uses anonymized mobile movement and hospitality data to identify where resident passengers originate and where visitors stay, then connects those patterns with aviation datasets.
That integration matters. Mobile location data can show real-world movement at a fine geographic level, but the size and composition of a mobile panel can change. Calibration against passenger data helps prevent a change in device coverage from being mistaken for a change in airport demand. FlightBI’s approach combines mobile geography with airline ticketing and segment/onboard data for ZIP-to-destination analysis by airport and airline.
For U.S. markets, the aviation foundation includes DOT O&D data. The Bureau of Transportation Statistics’ new DB1C program increased the ticket sample from 10% to 40%, changed reporting from quarterly to monthly, and expanded the set of reporting carriers. It also contains itinerary, passenger, and fare information. Those changes make DB1C especially valuable for calibrating U.S. domestic passenger demand and low-cost-carrier markets. See the BTS OD40 methodology and first DB1C release description.
Where Fligence stands out
- Aviation-calibrated geography: It does not treat raw mobile-device observations as passenger totals.
- Route-level catchment: Airport share and leakage can vary greatly by destination, fare, and nonstop availability, so a single static catchment boundary is rarely enough.
- Resident and visitor separation: Resident origins and visitor destinations can be analyzed differently instead of being combined into one trade area.
- Competitive airport analysis: Users can compare which airport travelers from each ZIP code actually select.
- Air service development detail: Destination, airline, O&D volume, fare/revenue, and time trends can support route proposals and airline meetings.
- Flexible catchment definitions: Airports can work with states, counties, ZIP codes, or custom ZIP groupings rather than accepting a fixed radius. Users can click and select ZIP codes or counties to be included on a map.
- International local geography: Separate Fligence solutions extend catchment analysis to Canadian census subdivisions, Mexican municipalities, and European local administrative units.
Best for
Fligence is best suited to airport and consultant teams asking questions such as:
- Which ZIP codes generate the most passengers for our airport?
- How many travelers in each ZIP use a competing airport?
- Which destinations have the largest recapture opportunity?
- How does our share change when we offer nonstop service?
- Where do inbound visitors stay after arriving?
- Which local areas should be targeted in an air service marketing campaign?
From catchment opportunity to network-planning scenario
FlightBI also offers Fligence Planning for Airports, a complementary network-planning platform that helps airport air service development teams identify promising new markets and evaluate proposed service with a QSI (Quality Service Index) scenario model.
After Fligence Catchment identifies where demand exists and where passengers leak, Fligence Planning can model a proposed airline schedule—including new flights, frequencies, aircraft, departure times, connections, and codeshares—and estimate how the scenario may change airline market share, passenger traffic, revenue, and profitability. Airports can compare the proposed scenario with the existing network and quantify the potential revenue and profit impact for an airline before presenting the opportunity.
Together, the two FlightBI products support a connected air service development workflow:
- Identify the geographic opportunity with Fligence Catchment: locate passenger demand by ZIP code, measure leakage to competing airports, and identify high-potential destinations.
- Test the service scenario with Fligence Planning: add the proposed schedule, rebuild online connections, calculate QSI scores, and estimate traffic, market-share, revenue, and profit effects.
- Build the airline business case: combine ZIP-level demand evidence with a quantified network scenario for a more complete route proposal.
2. Cirium Diio Mi
Cirium Diio Mi is one of the most widely used aviation market-intelligence platforms among U.S. airports, airlines, consultants, and air service development professionals. It provides extensive airline schedules, seats, aircraft, airport-to-airport passenger traffic, fares, revenue, load factors, market share, and route-planning capabilities.
Cirium states that Diio Mi covers more than 97% of worldwide scheduled flights and provides 20 years of historical schedules plus forward-looking schedule data. Its traffic and fare products combine sources such as government O&D data, schedules, MIDT/GDS information, and statistical market-sizing models. Users can evaluate existing routes, size airport-pair demand, examine airline performance, analyze fares and load factors, and test route opportunities with QSI and scenario-planning tools.
Strengths
- Widely recognized and used in U.S. airport air service development
- Extensive historical and future airline schedule data
- Airport-to-airport O&D passenger traffic and fare analysis
- Airline, itinerary, connection, cabin, capacity, and revenue detail
- Route performance, QSI, and scenario-planning capabilities
- Valuable common reference point in airport-airline discussions
Why Diio Mi is not a complete catchment and leakage tool
Diio Mi is primarily organized around airports, airport pairs, routes, airlines, schedules, and passenger markets. That makes it extremely useful for questions such as:
- How many passengers travel between our airport and a destination?
- How many local passengers connect to reach that destination?
- Which airlines carry the traffic and what fares do passengers pay?
- How much capacity does a competing airport offer to the destination?
- Could a proposed nonstop service capture enough traffic?
Those are essential air service questions, but they are not the same as behavioral catchment analysis. Airport-to-airport O&D data identifies the airport where an itinerary begins or ends; it does not identify the passenger’s home ZIP code, the local ZIP where an inbound visitor stays, or the competing airport selected by travelers living in each part of the airport’s surrounding region.
Cirium used to include some demographic and economic statistics by county and zip code around a selected airport (local county and ZIP-code demographic features have been removed from its core platform recently). These can provide useful market context, but they should not be confused with observed ZIP-level passenger allocation. A population or demographic catchment around an airport shows potential demand. A behavioral catchment shows how actual passengers from each ZIP divide among competing airports and destinations.
3. Placer.ai
Placer.ai is a broad location-intelligence platform rather than a dedicated airline O&D database. Placer says its panel contains tens of millions of mobile devices and that machine learning is used to estimate visits and visitation patterns. Its True Trade Area tools map where observed visitors to a place come from, while other datasets add demographic, psychographic, consumer, and market context. See Placer’s descriptions of its data and trade-area analysis.
Strengths
- Near-real-time visitation and movement analysis
- Flexible point-of-interest and trade-area tools
- Audience, demographic, tourism, and commercial-development context
- Useful for comparing physical visitation across airports or surrounding destinations
- Broad applications beyond air service development
Questions to examine
Mobile location is valuable evidence of real movement, but airport geofences contain more than originating and terminating airline passengers. Employees, flight crews, vendors, people dropping off or meeting travelers, rental-car customers, and connecting passengers can all create location signals. A general location platform may therefore be highly useful for airport visitation or commercial analysis without directly answering airline O&D questions.
According to Placer’s sales person, Placer does not conduct any calibration to airline tickets, passenger itineraries, fares, destinations, or onboard traffic for airport catchment analysis. Airports considering Placer for air service development should ask how the proposed analysis:
- identifies actual airline passengers;
- separates residents, visitors, workers, and non-traveling airport visitors;
- assigns an air trip’s true origin and destination;
- measures route-level leakage to another airport; and
- converts a changing device panel into stable passenger estimates.
Placer can be a strong complement to aviation data. It should not automatically be treated as a substitute for an aviation-calibrated O&D and leakage platform.
4. Aviation Week Catchment Analyzer
Aviation Week’s Catchment Analyzer, developed through ASM, is also purpose-built for airport air service development. Its published methodology says that resident traffic blends internet search data with census information and actual flown passenger data, with the result calibrated using MIDT. Visitor traffic blends hotel search, hospitality, and airport passenger data. The enhanced U.S. product also incorporates U.S. DOT O&D demand data. Published features include ZIP-level leakage, airport market share, passenger routing, airline detail, visitor origination, and historical trends.
Strengths
- Built for airport catchment, leakage, and route-development workflows
- Combines several data types rather than relying on a single source
- Includes global MIDT, which is valuable for international GDS booking flows
- Separates resident and visitor demand
- Provides airline, routing, market-share, and trend views
Questions to examine
Search data can be timely and useful for measuring interest, but a flight search is not the same as a booking or completed trip. One person may search repeatedly, compare several departure airports, search for someone else, or never purchase. Search-derived location may also be affected by the way IP, device, or account geography is assigned. Census smoothing and passenger calibration can reduce these issues, but airports should ask how much influence search geography retains at the ZIP level after calibration.
MIDT is an established aviation dataset, but it mainly reflects bookings made through global distribution systems (see Cirium’s overview of passenger data). MIDT only includes GDS booking data sold by travel agencies, and does not include direct sales by airlines. That distinction matters where airline-direct purchases or low-cost carriers have a large share. Buyers should ask how the product estimates missing channels and reconciles bookings, tickets, and flown passengers for each airport.
5. ARC Market Locator
ARC Market Locator analyzes U.S. air travel purchases and passenger behavior using ARC transaction data. ARC’s published product sheet says users can examine traveler origins down to ZIP code, purchasing trends, carrier behavior, leakage and diversion, historical tickets, and tickets purchased for future travel.
ARC data has an important strength: it represents actual ticket transactions, not searches or reservations. It can therefore be valuable for understanding purchase timing, agency-distributed traffic, forward bookings, itinerary patterns, and customer geography.
Strengths
- Based on real ticket transactions
- ZIP-level purchaser or traveler analysis
- Useful booking, itinerary, carrier, and forward-travel detail
- Well suited to marketing and purchase-behavior questions
- Familiar aviation data source for airline and airport analysis
Questions to examine
ARC’s Area Settlement Plan data captures transactions settled through participating U.S. travel agencies. It should not be interpreted as every ticket sold in the market. Purchases made directly with an airline, and sales from carriers or channels outside the applicable settlement dataset, e.g., Low Cost Carrier sales) may not be present.
Location also needs careful interpretation. ARC’s documentation describes traveler-origin and purchaser-location capabilities, so it would be inaccurate to characterize every record as the address of a travel agency. However, corporate travel can still be associated with a company billing location or headquarters rather than the employee’s residence. Airports should ask which location field is used in each report, how corporate and leisure transactions are handled, and how the sample is expanded to total airport traffic.
This channel mix can also affect carrier comparisons. Legacy network airlines traditionally receive more GDS and managed-corporate bookings, while most low-cost carriers rely heavily on direct sales. An unadjusted agency-settlement sample may therefore produce different geographic or carrier shares from the airport’s complete flown market.
The most important buying question: What is being measured?
Many vendor comparisons focus on map design, dashboard speed, or the number of filters. The more important issue is the unit of observation.
| If the source measures… | It directly shows… | It does not automatically prove… |
| Flight searches | Shopping interest | A ticket purchase or completed trip |
| Mobile airport visits | Device presence and movement | That the device owner was an O&D passenger or where the person flew |
| Agency-settled tickets | Purchases through covered channels | The complete market across all direct and agency channels |
| Airport-to-airport O&D and schedule data | Market size, routing, airline share, fares, and capacity between airports | Which residential ZIP generated each passenger or how local ZIPs divide among competing airports |
| Airline O&D tickets and onboard traffic | Air journeys, markets, and passenger benchmarks | Precise home or visitor location below the available aviation geography |
| Calibrated mobile plus aviation data | Fine geography reconciled with air-travel totals and markets | Perfect observation of every traveler; all models still require validation |
This is why an integrated methodology is usually stronger for airport catchment analysis. Aviation data supplies the passenger, itinerary, destination, carrier, and fare context. Mobile or hospitality data supplies the local geography. Calibration connects the two while controlling for sample bias and changes over time.
How airports should evaluate catchment analysis vendors
Before selecting a platform, request a validation exercise for your own airport and competing airports. Ask every vendor the same questions:
- Does the result measure searches, bookings, tickets, visits, or flown passengers?
- Which airline-direct, GDS, low-cost-carrier, and international channels are included?
- How is the data expanded or calibrated to known passenger totals?
- Can the platform distinguish residents from visitors?
- Can it separate originating, terminating, and connecting passengers?
- Is leakage available by ZIP code, destination, airline, and time period?
- Can a user compare airport share with and without nonstop service?
- How are corporate billing addresses, mobile-panel changes, VPNs, duplicate searches, and repeated devices handled?
- Can results be reconciled with the airport’s own survey, parking, TSA, or passenger data?
- Are the methodology, update schedule, and historical revisions documented?
A credible vendor should explain both strengths and limitations. No source observes every passenger perfectly; the goal is a transparent model that uses complementary data and produces results consistent with known aviation totals.
Final recommendation
For airport teams whose main objective is air service development, destination-level demand, airport market share, and leakage recapture, Fligence Catchment offers the most complete methodological fit among these five options. It combines the geographic value of mobile and hospitality data with the aviation structure needed to analyze O&D passengers, destinations, airlines, fares, competing airports, residents, and visitors.
Cirium Diio Mi remains highly valuable—and for many U.S. airports essential—for schedules, airport-pair demand, fares, capacity, QSI, and route planning, but it does not replace ZIP-level catchment and leakage analysis. Placer.ai is compelling for general visitation, tourism, commercial, and audience analysis, but its public methodology does not establish it as a complete airline O&D platform. Aviation Week Catchment Analyzer brings strong aviation-industry context, but airports should assess the influence of search behavior and MIDT channel coverage in their specific market. ARC Market Locator provides valuable ticket-purchase intelligence, particularly within agency channels, but should be tested for direct-booking, carrier-mix, and corporate-location bias.
The best airport catchment software is not the platform with the most media exposure. It is the platform that can connect where travelers are located with how they actually travel by air—and reconcile both to defensible passenger totals.
Want to see your airport’s true ZIP-level demand and leakage? Request a personalized Fligence Catchment demonstration using your airport, competitors, and priority destinations.
Frequently asked questions
What is airport catchment analysis software?
Airport catchment analysis software estimates the geographic areas that generate passengers for an airport. Advanced platforms also measure which competing airports those travelers use, where they fly, whether they are residents or visitors, and how airport share changes by destination, airline, fare, nonstop service, and season.
What is the difference between an airport catchment area and airport leakage?
An airport catchment area is the geography from which an airport attracts passengers. Airport leakage is the portion of travelers in that geography who use a competing airport. Because traveler choice changes by destination and service level, leakage should be measured by market rather than with only a fixed drive-time boundary.
Can mobile phone data measure an airport catchment area?
Mobile location data can reveal where devices observed at an airport spend time and how they move. For aviation planning, it should be filtered and calibrated with passenger and O&D data because airport visitors include employees, greeters, vendors, connecting travelers, and others who are not local originating passengers.
What are the limitations of MIDT data for airport catchment analysis?
MIDT is based mainly on bookings made through global distribution systems. It is valuable for airline market analysis, especially international and agency-booked traffic, but it may not fully observe airline-direct bookings or carriers with limited GDS participation. Airports should ask how missing channels are estimated and how bookings are reconciled to flown passenger totals.
What are the limitations of ARC ticket data?
ARC data represents actual transactions settled through participating U.S. travel agencies, which makes it useful for purchase and booking analysis. However, it may not include all airline-direct or nonparticipating-carrier sales. Corporate billing geography can also differ from a traveler’s residence, so location fields and expansion methods should be reviewed.
Is Cirium Diio Mi an airport catchment analysis tool?
Diio Mi is primarily an airline schedule, airport-to-airport traffic, fare, capacity, and route-planning platform. It used to provide demographic, regional, point-of-sale, and other market context, but it does not natively provide the same behavioral ZIP-level passenger origins, resident-versus-visitor allocation, or ZIP-level competing-airport leakage analysis as a dedicated catchment platform such as Fligence ZIP-OD.
Why combine mobile location and aviation passenger data?
The two sources solve different parts of the problem. Mobile data provides detailed local geography, while aviation data supplies passenger totals, itineraries, airlines, destinations, and fares. Calibration combines that detail and helps control for mobile-panel fluctuations, sample bias, and incomplete channel coverage.