
Identifying new nonstop route opportunities requires more than finding the largest destinations that an airport does not currently serve. A strong air service opportunity combines sufficient passenger demand, meaningful local traffic, favorable competitive conditions, an appropriate airline and aircraft, connecting opportunities, and the potential to generate sustainable revenue and profitability.
For airport Air Service Development teams, the key question is which unserved or underserved markets have enough addressable demand and economic potential to support new nonstop service?” Answering that question requires moving from market identification to route scenario analysis.
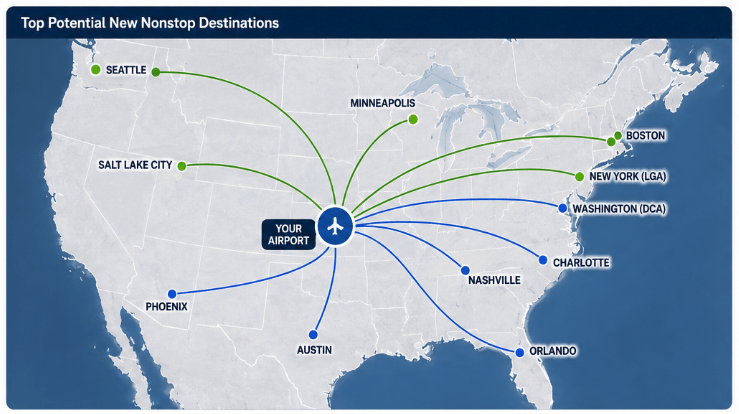
Start with Unserved and Underserved Passenger Demand
A logical starting point is identifying destinations where passengers from the airport’s market are already traveling in meaningful numbers.
Suppose an airport identifies the following markets:
| Destination | Total Market PDEW | Local Airport PDEW | Competing Airport PDEW |
|---|---|---|---|
| Nashville | 82 | 14 | 68 |
| Austin | 65 | 20 | 45 |
| San Diego | 48 | 12 | 36 |
| Raleigh-Durham | 42 | 25 | 17 |
Nashville immediately stands out because substantial passenger demand exists, but relatively little of it currently uses the local airport. That does not automatically mean Nashville can support a nonstop flight. It means Nashville deserves further analysis. The first stage of route development is therefore opportunity screening: identifying markets large enough and relevant enough to investigate.
Look Beyond Current Airport Traffic
One of the biggest mistakes in identifying new routes is looking only at passengers currently using the airport. For an unserved destination, many local passengers may already be traveling to another airport to access better service.
Suppose only 15 PDEW travel from the local airport to Las Vegas. Looking only at the airport’s existing traffic might make the market appear small. But suppose another 55 PDEW from the surrounding market drive to competing airports for Las Vegas flights. The broader local market is therefore: 15 + 55 = 70 PDEW. That creates a very different picture of potential demand.
For regional airports in particular, understanding passenger demand across the broader catchment can reveal opportunities that are not visible in the airport’s own traffic statistics.
Determine Whether the Market Is Truly Unserved or Underserved
Not all route opportunities involve destinations with no existing service. An unserved market has meaningful passenger demand but no nonstop service from the airport.
An underserved market may already have nonstop service but could potentially support:
- Additional frequency
- More seats
- Seasonal expansion
- Year-round service
- A different airline
- A larger aircraft
- Better departure times
For example, a market with one daily flight operating at strong load factors and substantial remaining passenger demand may represent an opportunity just as valuable as a completely unserved destination.
Air Service Development teams should therefore screen both new destinations and opportunities to strengthen existing routes.
PDEW Is a Starting Point, Not the Final Answer
Passengers Daily Each Way (PDEW) is one of the most useful measures for evaluating route demand. If an airport market generates 100 passengers per day in each direction to a destination, that provides an intuitive measure of the existing market. But PDEW alone does not determine whether a route is viable.
Consider two destinations that each generate 80 PDEW.
| Destination A | Destination B |
| 80 PDEW Most passengers live close to the airport No nearby nonstop service Strong local business connections Potential airline hub connectivity | 80 PDEW Most passengers live near another airport Multiple nearby nonstop alternatives Highly seasonal demand Limited connecting potential |
The two destinations have identical PDEW but very different route potential. Market size identifies opportunities while market structure determines how attractive those opportunities really are.
Understand Where the Demand Comes From
The geography behind the demand can matter as much as the total passenger count.
Suppose an airport identifies 75 PDEW to a potential destination. If most of those passengers live within communities close to the airport, the airport may have a strong opportunity to capture them. If much of the demand originates at the far edge of the broader catchment and those passengers live closer to another airport, the addressable portion may be smaller.
Air Service Development teams can therefore examine:
- Where passengers traveling to the destination live
- How concentrated the demand is
- How far those passengers are from the airport
- How much of the demand currently uses competing airports
This provides a more realistic view of the passengers a new nonstop could potentially attract.
Identify Which Airports Currently Carry the Market
If passengers are already traveling to the destination, where are they beginning their trips?
Suppose a proposed market generates 90 PDEW:
- Local airport: 15 PDEW
- Competitor A: 45 PDEW
- Competitor B: 20 PDEW
- Other airports: 10 PDEW
This shows that demand already exists, but much of it is accessing the air transportation system elsewhere.
The next questions become:
- What service does Competitor A provide?
- Is it nonstop?
- Which airline operates it?
- How frequently does it operate?
- How much of that demand could realistically shift to a local nonstop?
This helps convert total market demand into an estimate of addressable route demand.
Examine Existing Nonstop Competition
A proposed route does not compete only with other airports. It also competes with the service those airports provide.
Consider two possible destinations.
| Market A | Market B |
| 70 PDEW No nonstop service within the surrounding region | 100 PDEW Three daily nonstop flights available from a competing airport 45 minutes away |
Market B is larger, but Market A could still represent the more attractive opportunity.
Existing nonstop service can affect:
- Potential passenger capture
- Expected fare
- Required frequency
- Competitive response
- Airline interest
This is why route opportunity ranking should incorporate competitive service rather than relying solely on market size.
Identify the Right Airline
A good destination does not necessarily represent an opportunity for every airline. Once a market has been identified, airports need to determine which carrier is best positioned to operate it. Important considerations include:
- Airline hubs and focus cities
- Existing airline presence at the airport
- Aircraft availability
- Fleet type
- Network connectivity
- Current passengers using the airline
- Potential connecting traffic
- Airline strategy
Suppose local passengers traveling to Destination X already disproportionately use Airline A through a competing airport. That can be useful evidence when approaching Airline A because it demonstrates an existing relationship between the airline and passengers in the airport’s market.
The airport’s question therefore becomes not only: Which route should we pursue?, but also: Which airline has the strongest strategic case for operating it?
Aircraft Size Changes the Route Economics
A market that cannot support a 150-seat A320 may still support a 76-seat E170. Likewise, a route that works at three weekly frequencies may not support daily service.
For example, assume a market could generate approximately 60 passengers each way per day for a new nonstop. A daily 76-seat aircraft would require a very different demand level from a daily 150-seat aircraft. Route viability therefore depends on matching Market demand with Aircraft capacity and frequency, rather than simply deciding whether the destination has “enough passengers.” This is one reason scenario analysis is important after the initial opportunity has been identified.
Connecting Traffic Can Make a Route More Valuable
Local O&D demand is important, but some routes can also carry connecting passengers. This is especially relevant when an airport is evaluating service to an airline hub.
Suppose an airport has 50 PDEW of local demand to Dallas. A proposed DFW flight, however, could also provide connections to destinations across the airline’s network. Passengers traveling from the airport to Austin, San Antonio, Phoenix, Mexico, Latin America, or other markets may potentially use the new DFW flight as part of their itinerary. The economics of the route therefore cannot always be evaluated using local Airport–DFW demand alone.
A network model can estimate how the new flight interacts with the airline’s broader schedule and how much connecting traffic it may attract.
New Nonstop Service Can Stimulate Demand
Historical passenger demand represents what travelers do under the current air service environment. A new nonstop changes that environment.
Some passengers who previously did not make the trip may begin traveling because the journey becomes easier. Existing travelers may travel more frequently. Travelers who previously used other airports may shift to the local airport. This is commonly referred to as traffic stimulation.
The potential level of stimulation depends on the market and should not simply be assumed to be the same for every route. A strong route analysis therefore distinguishes between existing demand, potential passenger capture, and potential stimulated demand, rather than treating historical PDEW as the maximum possible market size.
Seasonality Can Change the Answer
Annual averages can hide important route characteristics.
For example, the Boston (BOS) to Orlando (MCO) market averaged 1,897 PDEW in 2025, but demand varied significantly by season:
- Spring (April): 2,371 PDEW
- Summer (July): 1,566 PDEW
- Fall (September): 1,384 PDEW
- Winter (December): 2,228 PDEW
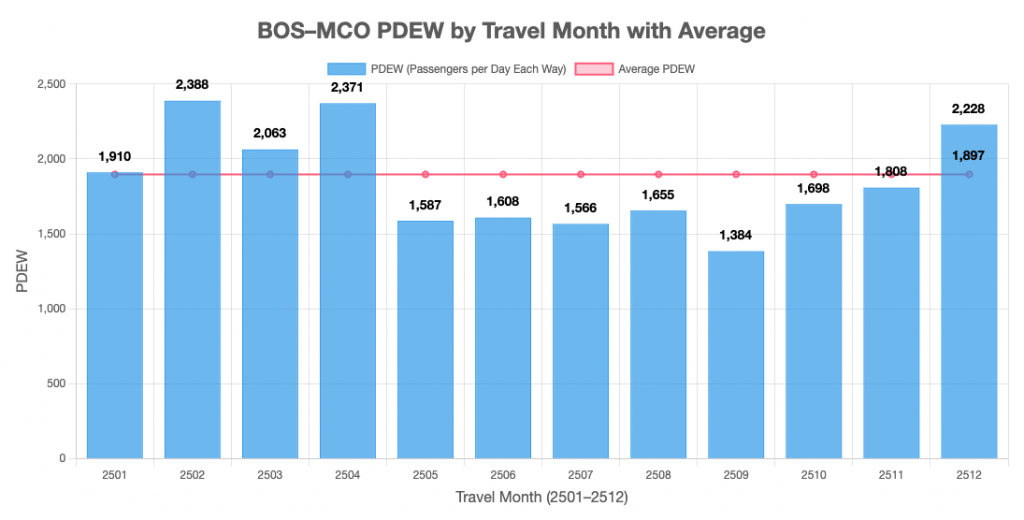
The market is large enough to support multiple daily nonstop flights year-round, but the seasonal pattern suggests that it can support greater capacity or frequency in winter and spring than in summer and fall.
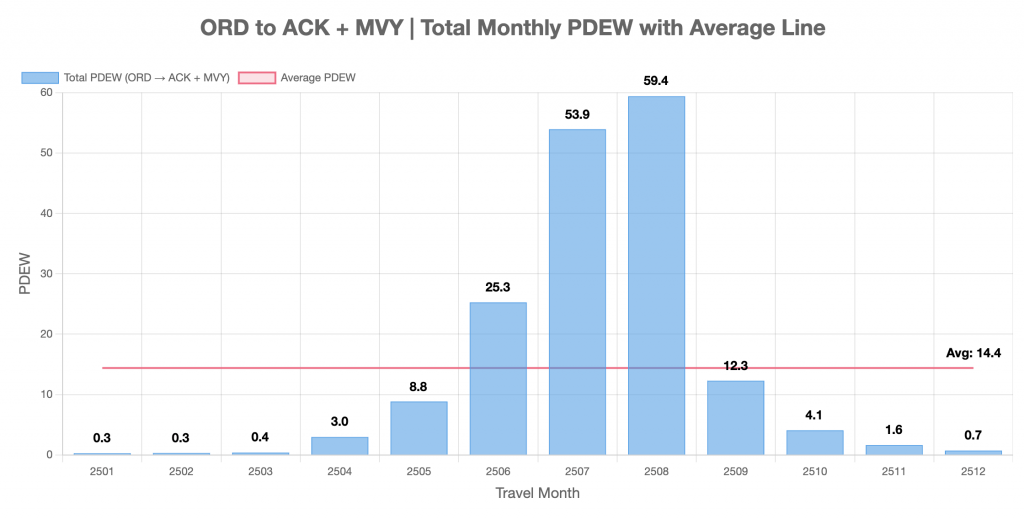
Another example is the Chicago (ORD) – Martha’s Vineyard (MVY)/Nantucket (ACK) market. As shown in the chart above, the combined market averages only 14.4 PDEW annually. However, demand rises to more than 50 PDEW in July and August. Because Martha’s Vineyard and Nantucket are neighboring island destinations separated by roughly 20–25 miles of water, it can be useful to evaluate them as a combined seasonal leisure market. The summer demand may be sufficient to support seasonal nonstop service even when year-round service is difficult to sustain.
By contrast, another market might consistently generate 55–65 PDEW throughout the year, making it better suited to stable year-round service.
Air Service Development teams should therefore examine monthly and seasonal demand patterns—not just annual averages—to determine the appropriate timing, frequency, and seasonality of potential nonstop service.
Historical Demand Is Only Part of Future Opportunity
Passenger demand can also change because the underlying market is changing.
Population growth, migration, new employers, tourism development, second-home ownership, universities, corporate investment, and other economic changes can create demand that is not fully represented by historical traffic.
Suppose a metropolitan area has recently gained:
- A major corporate facility
- Thousands of new residents
- A growing tourism sector
Historical O&D traffic may understate the future potential of certain routes. Route identification should therefore combine current passenger behavior with an understanding of where the local economy and population are heading.
From Market Opportunity to Route Scenario
Once a promising market has been identified, the analysis should move beyond asking whether demand exists. The next question is:
What happens if an airline actually adds the flight?
Suppose an airport is evaluating a proposed daily nonstop:
Airport A → Airline Hub B
A scenario analysis can add the proposed flight to the airline schedule and evaluate how the network changes. The model can then estimate:
- Passenger traffic on the proposed flight
- Market share changes
- Local and connecting traffic
- Load factor
- Revenue impact
- Profit impact
This provides a fundamentally different level of analysis from simply reporting historical PDEW.
Use QSI to Estimate Passenger Choice
One way to evaluate a proposed route is through a Quality Service Index (QSI) model.
QSI evaluates the relative attractiveness of available passenger itineraries based on service characteristics. Factors can include:
- Nonstop versus connecting service
- Aircraft type or size
- Connection time
- Itinerary type
- Circuity
- Airline presence
- and other characteristics.
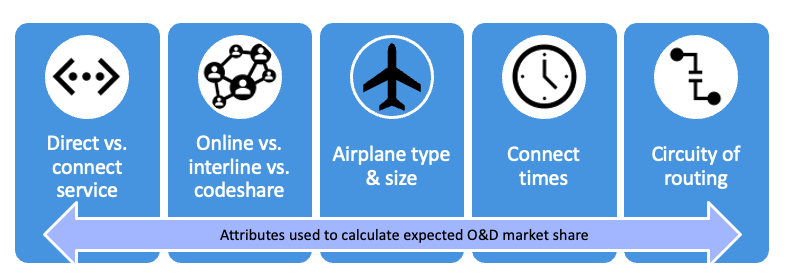
Each itinerary receives a relative QSI value, which can then be used to estimate how passenger market share may change when a new flight is introduced. This is particularly useful because a new route does not operate in isolation. It changes the set of travel options available to passengers and can affect traffic across multiple itineraries and markets.
Estimate Revenue and Profit, Not Just Passenger Volume
For an airline, a route opportunity ultimately needs to make economic sense. A proposed flight may attract many passengers but still perform poorly if fares are low or operating costs are high. Another route with fewer passengers could potentially produce stronger economics.
For this reason, airports can strengthen an airline proposal by moving beyond:
“There are 80 PDEW in this market.”
to:
“Under this proposed schedule and aircraft scenario, here is the estimated traffic, revenue, and profitability impact.”
This helps answer the question airlines ultimately care about:
“What could this route contribute to our network?”
Analyze New Routes with Fligence Planning
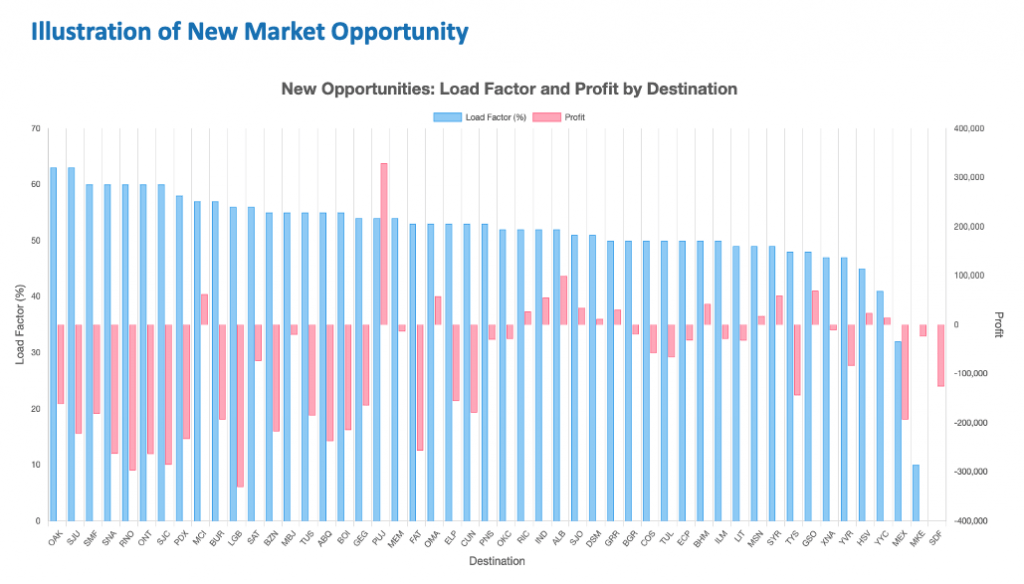
Fligence Planning for Airports is a cloud-based platform designed to help airport Air Service Development teams identify promising airline markets and evaluate proposed service. After identifying a route opportunity, airport teams can create a scenario by adding proposed flights and evaluating how the airline network changes.
Fligence Planning uses a QSI methodology to estimate itinerary attractiveness and passenger market share. The platform can rebuild connecting itineraries after a schedule change and compare the proposed scenario with the existing network. Airport teams can evaluate potential changes in metrics such as:
- Passenger traffic
- Market share
- Load factor
- Revenue
- Profit
This allows an ASD team to move from identifying a promising destination to quantifying the potential airline-side impact of serving it.
Compare Multiple Route Scenarios
The first proposed schedule is not necessarily the best one.
Suppose an airport wants to evaluate new service to an airline hub. The team might compare:
- Scenario 1: Daily 76-seat aircraft
- Scenario 2: Twice-daily 76-seat aircraft
- Scenario 3: Daily 150-seat aircraft
- Scenario 4: Seasonal daily service
Each scenario can produce different passenger capture, connecting opportunities, load factors, revenue, and costs.
Scenario comparison helps airports understand not simply whether a market is attractive but what type of service may fit the market best. It can also help prepare for airline discussions because the airport can evaluate alternatives before proposing a specific schedule.
Build a Stronger Airline Proposal
Airlines receive route proposals from many airports. A proposal becomes more useful when it progresses from broad market claims to measurable network economics. Instead of presenting only Catchment population and Historical O&D demand, an airport can build a story around:
- Existing passenger demand
- Geographic sources of that demand
- Passengers currently using competing airports
- Fare and service conditions
- Proposed schedule and aircraft
- Expected passenger capture
- Connecting traffic opportunities
- Estimated revenue and profitability
This gives the airline a clearer picture of how the proposed route could perform within its network.
A Practical Route Opportunity Workflow
A data-driven Air Service Development process can move through several stages:
1. Discover
Identify large unserved and underserved destination markets.
2. Validate
Examine PDEW, passenger geography, competing airports, existing service, fares, and seasonality.
3. Match
Identify airlines and aircraft that fit the opportunity.
4. Simulate
Add the proposed service to the network and estimate passenger behavior.
5. Evaluate
Analyze traffic, market share, load factor, revenue, and profitability.
6. Compare
Test alternative schedules, frequencies, aircraft, or airlines.
7. Present
Build an airline business case supported by market and scenario evidence.
This turns route development from a ranking exercise into a scenario-based decision process.
The Bottom Line
What new nonstop routes could our airport support? The answer cannot be determined from passenger volume alone.
A strong route opportunity combines: meaningful O&D demand + addressable passengers + favorable geography + competitive service conditions + the right airline + appropriate aircraft and frequency + network connectivity + sustainable economics.
Historical data can identify where opportunities may exist. Scenario analysis determines what could happen if the service is actually introduced. With Fligence Planning, airport Air Service Development teams can move beyond identifying large unserved markets and model proposed airline schedules using QSI-based network analysis to estimate their potential impact on passenger traffic, market share, revenue, and profitability.
The most useful question is therefore not simply:
“Where do enough passengers want to go?”
It is:
“Which proposed route creates the strongest opportunity for both our airport and the airline?”