
Second-home owners and seasonal residents can generate substantial air travel demand that is easy to underestimate using traditional population statistics.
A resort community may have only 30,000 permanent residents but contain thousands of vacation homes owned by people who primarily live hundreds or thousands of miles away. Those owners may travel repeatedly between their primary residence and second home throughout the year, creating a recurring air travel market that is not reflected in the area’s permanent population.
For airport Air Service Development and Marketing teams, this raises an important question:
How much of our passenger demand is generated by people who use our region regularly but do not permanently live here?
FlightBI’s Fligence ZIP-OD Second Home Dashboard helps airports examine second-home ownership geographically, including where second homes are located, where their owners live, property values, drive-time relationships, and the airports most relevant to those owners.
Definition of a Second Home
A second home is an additional residential property that an owner uses part-time for vacations, seasonal stays, or other personal purposes rather than as a primary residence. It differs from an investment property because the owner occupies the property for at least part of the year rather than renting it out all the time for profit.
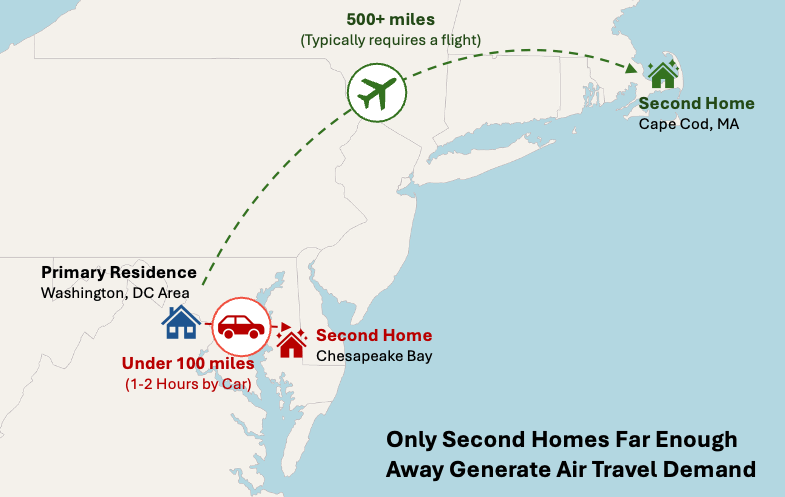
Second homes can generate additional travel between an owner’s primary residence and the location of the second home. However, not all second homes generate air travel demand. Many are located close enough to the owner’s primary residence that driving is the more practical option. For example, many second homes around the Chesapeake Bay are owned by residents of the Washington, D.C., Maryland, and Northern Virginia region, allowing owners to reach their properties by car.
This distinction is important for airport market analysis. The Fligence ZIP-OD Second Home Dashboard includes a drive-time control that allows users to focus on second homes whose owners’ primary residences are more than a specified number of driving hours away. This helps separate nearby second homes that primarily generate automobile trips from more distant properties that have greater potential to generate air travel.
Throughout this article, when we discuss second homes as a source of air passenger demand, we focus specifically on properties whose owners live far enough away for air travel to be the first choice.
Permanent Population Can Understate the True Travel Market
Population statistics are designed primarily to describe where people permanently reside. That works well for many airport markets, but it can be misleading for destinations with large numbers of:
- Vacation homes
- Seasonal residences
- Retirement properties
- Ski homes
- Beach houses
- Lake properties
Consider two communities:
Market A
Permanent population: 100,000
Few second homes
Market B
Permanent population: 40,000
25,000 second homes
Based on permanent population alone, Market A appears much larger. But Market B may generate substantial recurring visitor traffic from property owners and their families. For aviation planning, the effective travel market can therefore be much larger than the Census population suggests.
Second-Home Owners Are Different from Traditional Tourists
A hotel visitor may travel to a destination once and never return. However, a second-home owner has an ongoing reason to travel there. They may visit:
- Several times per year
- Every month
- For entire seasons
- During holidays
- For long weekends
This can make second-home owners particularly valuable to airports because they are not simply visitors. They represent a form of recurring nonresident demand.
Second-Home Travel Creates a Geographic Link Between Two Residences
Every second home creates a relationship between: the property’s location and the owner’s primary residence. For aviation analysis, that relationship is extremely useful.
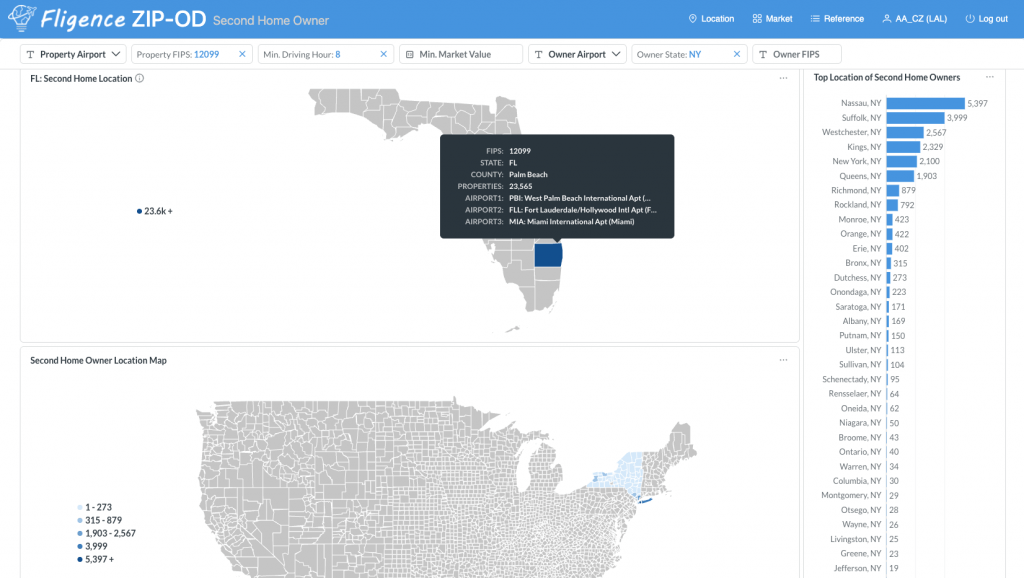
As shown in Fig. 2, thousands of second homes in Palm Beach County, Florida are owned by households whose primary residences are in the New York metropolitan area (e.g., Nassau, Suffolk, Westchester, Kings, New York, Queens and Richmond counties). Those properties create a recurring connection between New York and the Palm Beach region.
If similar ownership concentrations exist in Washington, Boston, Philadelphia, or Chicago, each may represent a distinct potential air travel market. Instead of simply counting second homes, airport teams can ask:
Where do the owners actually live?
Owner Mailing Address Can Reveal the Source Market
Property records can provide information about an owner’s mailing location when it differs from the property address. This can help identify nonresident ownership. For example: if the property address is a beach community in South Carolina while the owner mailing address shows Northern Virginia, the relationship suggests a household that may repeatedly travel between Northern Virginia and the South Carolina property.
When thousands of properties are analyzed together, geographic patterns begin to emerge. Airport teams can identify which metropolitan areas contain the largest concentrations of owners with second homes in their region.
Second-Home Ownership Can Reveal Hidden Route Demand
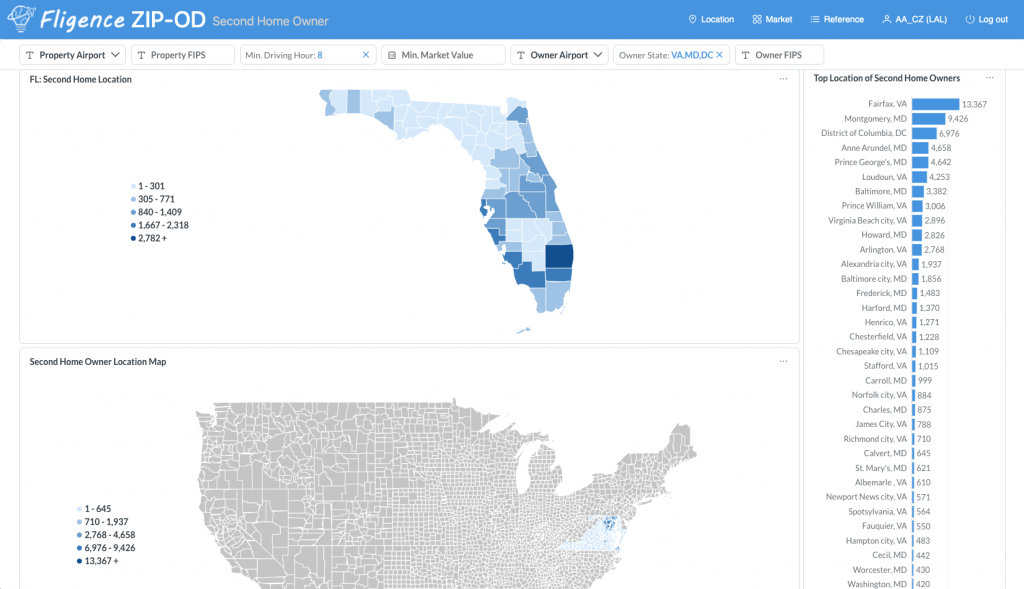
Suppose a Florida airport is evaluating service to Washington, D.C. (see Fig. 3) Traditional passenger data shows meaningful existing demand. Second-home data then reveals that a large number of properties in the airport’s region are owned by residents of:
- Northern Virginia (Fairfax County)
- Suburban Maryland (Montgomery County)
- Washington, D.C.
That provides another explanation for the market relationship. These owners may generate repeated trips throughout the year.
The second-home data does not replace O&D passenger demand, but it can help explain why the connection exists and why it may persist.
Property Value Can Add Another Dimension
Second homes vary enormously in economic value. A $150,000 seasonal property and a $3 million waterfront home may be associated with very different travel behavior.
Higher-value properties may be associated with households that have:
- Higher disposable income
- Greater travel frequency
- More premium travel
- Lower fare sensitivity
This does not mean property value directly determines airline behavior. But it can provide useful context when airport teams are trying to understand the economic characteristics of the second-home market.
High-Value Second-Home Markets Can Be Important for Premium Service
Some resort airports serve relatively small permanent populations but attract high-income seasonal residents. These travelers may value:
- Nonstop service
- Schedule convenience
- Premium cabins
- Short ground travel
- Weekend-friendly schedules
- Reliability
For airlines, the value of these passengers may be greater than permanent population statistics suggest. This can be especially relevant when evaluating service to:
- Major financial centers
- Large business markets
- Affluent metropolitan regions
Second-Home Demand Can Be Highly Seasonal
Second-home travel often follows strong seasonal patterns.
Beach Markets
Demand may peak during:
- Spring
- Summer
- Holiday periods
Ski Markets
Demand may concentrate in:
- Winter
- Early spring
Warm-Weather Markets
Northern owners may spend extended periods in the region during:
- Late fall
- Winter
- Early spring
The resulting air service opportunity may therefore be seasonal rather than year-round. That is not necessarily a weakness. A market may support:
- Seasonal nonstop service
- Weekend service
- Higher frequency during peak months
without supporting the same schedule throughout the year.
Seasonal Residents Can Stay Much Longer Than Tourists
A traditional visitor may stay three nights or one week, but a seasonal resident may remain for several weeks or even several months. This affects how airport demand appears over time. Seasonal residents may generate fewer trips per day of stay than hotel tourists, but because they return regularly, their cumulative annual air travel can still be significant.
They may also have different preferences for:
- Baggage
- Rental cars
- Parking
- Flight schedules
Understanding this segment can therefore help airports interpret seasonal passenger behavior.
Second Homes Can Create Demand in Both Directions
For an airport serving a resort region, second-home analysis should primarily focus on identifying where second-home property owners live, since their primary residences represent potential origin markets for recurring travel to the destination. However, for an airport serving an affluent community, the analysis can also work in the opposite direction: identifying whether and where local residents own second homes in other states. These ownership patterns can reveal additional air travel demand associated with frequent travel between primary and secondary residences.
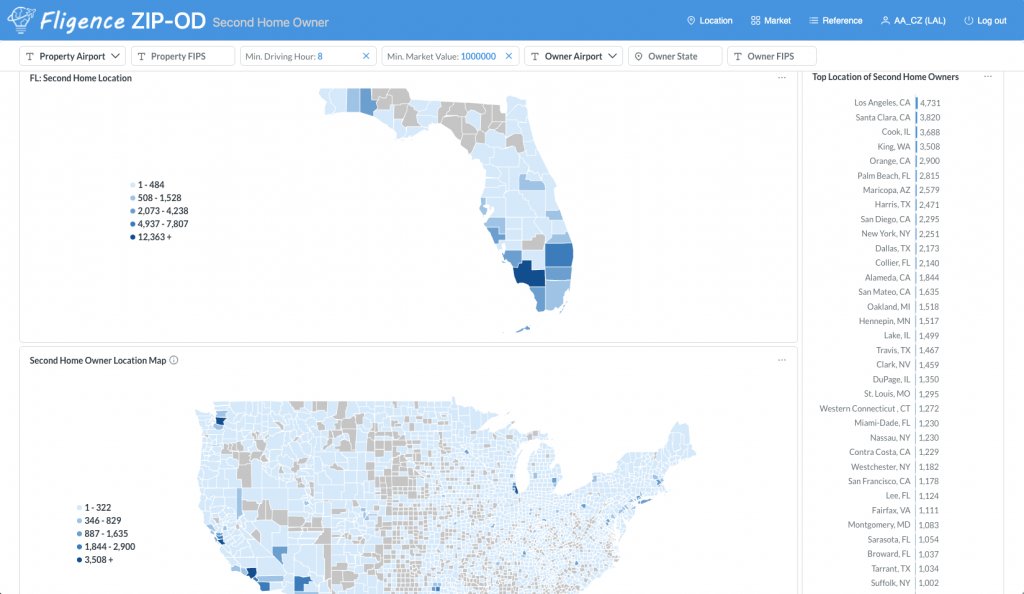
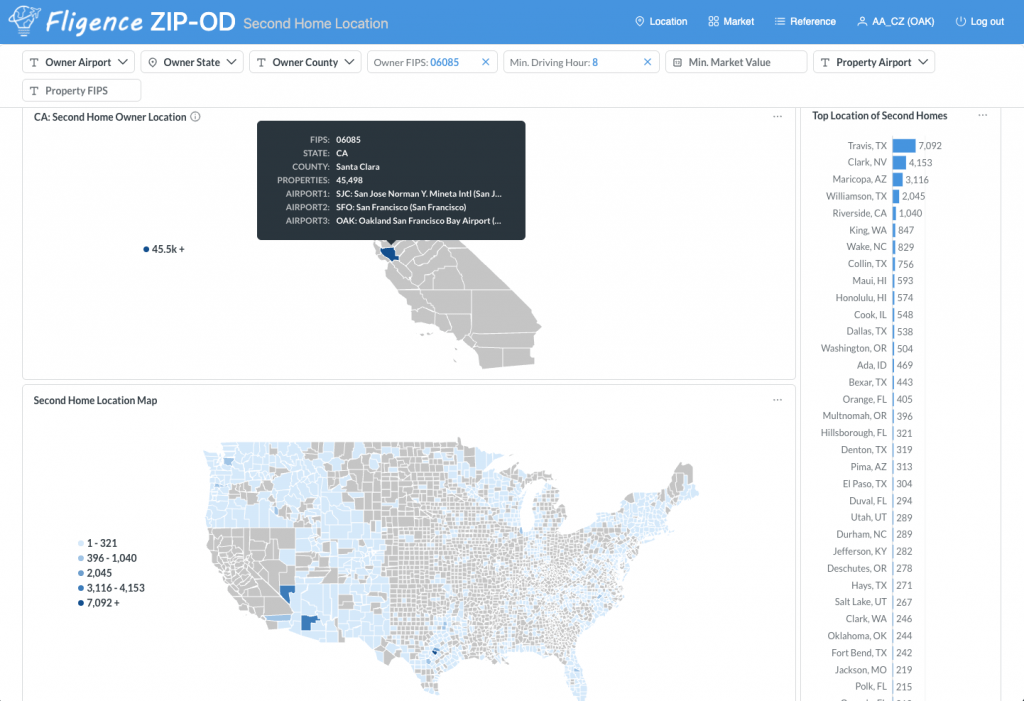
The Fligence Second Home Location Dashboard provides insight into where local residents own second homes. For example, Fig. 5 shows that residents of Santa Clara County, California—home to Silicon Valley—own thousands of second homes in markets such as Austin (Travis and Williamson Counties, TX), Las Vegas (Clark County, NV), and Phoenix (Maricopa County, AZ). For San José Mineta International Airport (SJC), these ownership concentrations can help identify and better understand potential second-home-related demand to specific destinations.
Traffic Demand is not Limited to Second Home Owners
Although second-home owners primarily travel toward their secondary residence, the relationship can generate additional traffic. Owners may invite children, parents, friends and extended family to visit. This means a second-home community can generate a broader visiting-friends-and-relatives market beyond the property owners themselves. The economic connection between the two regions can therefore extend beyond the number of registered owners.
Second-Home Owners May Know the Local Airport Better Than Typical Visitors
Unlike first-time tourists, repeat property owners often become familiar with the region’s transportation options. They learn:
- Which airport is closest
- Which airlines operate there
- Which competing airports offer more service
- How traffic varies
- Where to park
As a result, second-home owners may behave more like local residents when choosing an airport. They can develop strong airport preferences and habits.
For Marketing teams, this means second-home owners may be a valuable repeat-customer segment, not simply a tourism audience.
They May Also Be Willing to Drive to a Competing Airport
Familiarity with the region can work against the local airport. A second-home owner who visits frequently may learn that a competing airport offers:
- More nonstop flights
- Lower fares
- Better frequency
- A preferred airline
If the alternative airport is within a reasonable drive, that traveler may repeatedly use it.
Because second-home owners travel frequently, even a relatively small number of households can generate meaningful leakage over time. Understanding which airports they use can therefore be important.
Drive Time Matters on Both Ends of the Trip
For second-home travel, airport accessibility should be considered at both ends of the journey. For example, suppose a property owner lives only 25 minutes from Boston Logan International Airport (BOS), while the owner’s second home is 10 minutes from Myrtle Beach International Airport (MYR). This creates a highly convenient BOS–MYR airport pair and makes air travel particularly attractive.
The analysis can become more complex when travelers have multiple airport choices. For example, an owner in the Washington, D.C.–Baltimore region may have access to BWI, IAD, and DCA, while a second home in South Florida may be accessible from PBI, FLL, and MIA. Each airport combination offers different drive times, nonstop service, schedules, and fares.
For air service development, therefore, the true second-home opportunity should be evaluated across the entire door-to-door journey:
Primary residence → origin airport → flight → destination airport → second home
Simply measuring the distance between a second home and the local airport may miss important opportunities. Understanding accessibility at both the primary and second residences provides a more complete picture of which airport pairs and routes are most likely to capture second-home travel demand.
Fligence Can Show Airports Relevant to Second-Home Owners
FlightBI’s Fligence ZIP-OD Second Home Dashboard helps airport teams connect property ownership with aviation geography. The dashboard can identify where second-home owners’ primary addresses are located and show the top airports associated with those owner locations.
This helps airport teams move from:
“Where do our second-home owners live?”
to:
“Which airports could serve their travel to our market?”
That makes the information much more useful for route development.
Example: A Coast Airport
Consider a coastal airport serving a region with substantial second-home ownership. Property analysis may reveal large concentrations of owners from:
- Washington, D.C.
- New York
- Philadelphia
- Charlotte
The airport can compare these owner markets with current O&D demand, existing nonstop service, passenger leakage, seasonality, and average fares. Suppose Washington shows a large concentration of second-home owners, strong passenger demand, and high leakage, but limited nonstop service. That combination may warrant deeper route analysis.
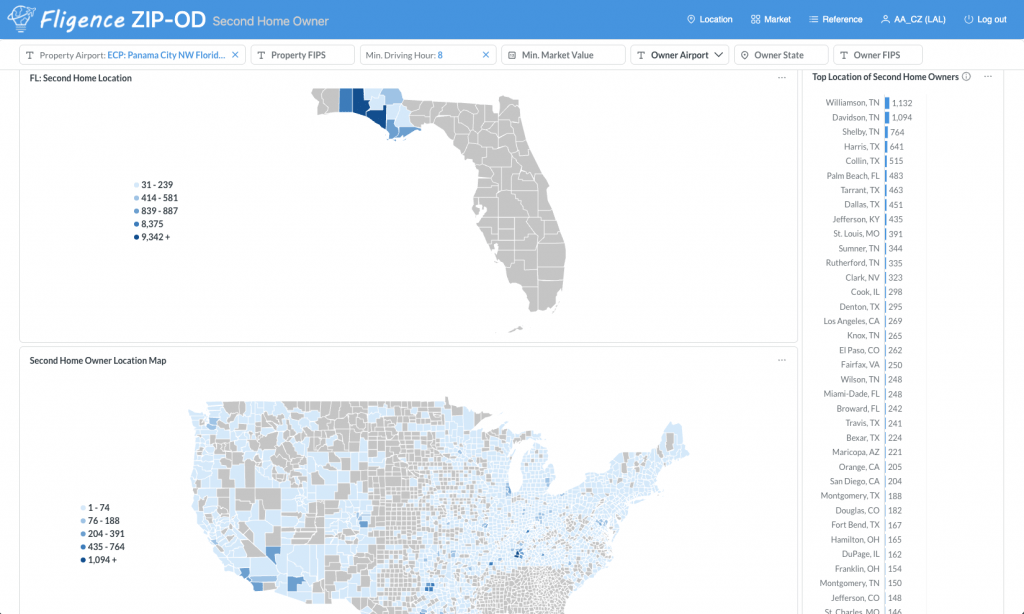
Northwest Florida Beaches International Airport (ECP) serves the Panama City, Florida, area, which has thousands of second homes. The second-home analysis in Fig. 6 reveals significant concentrations of property owners whose primary residences are in Tennessee.
As shown in Fig. 7, ECP currently has nonstop service to Nashville (BNA), which provides convenient access for second-home owners in Davidson and Williamson counties. However, the analysis also identifies 764 second-home owners in Shelby County, Tennessee. Shelby County is roughly a three-hour drive from BNA but is centered on the Memphis area, with Memphis International Airport (MEM) much closer to many of these owners.
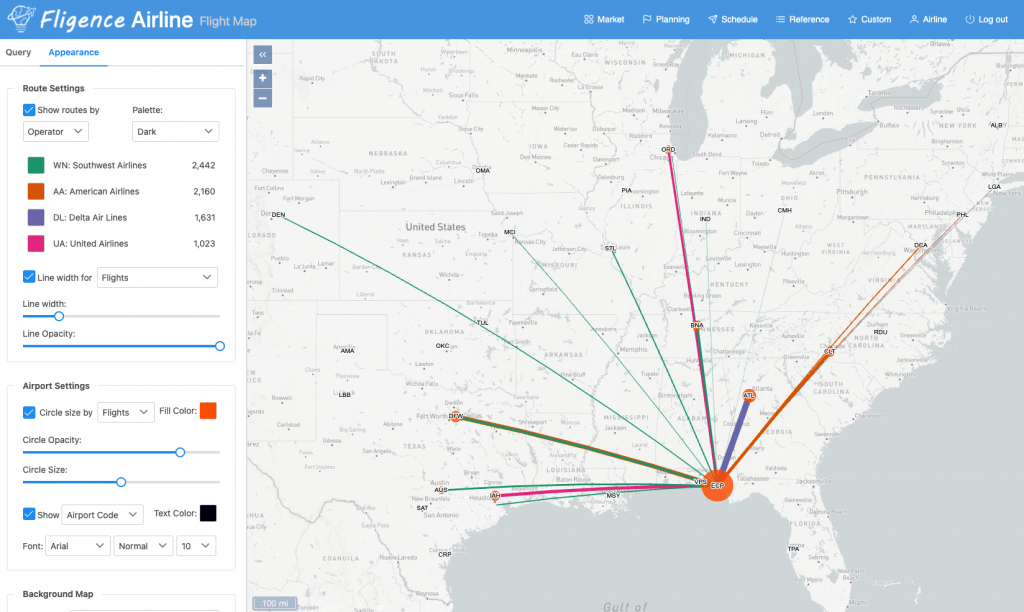
This creates a potential air service opportunity that may not be obvious from Panama City’s permanent population alone. A nonstop ECP–MEM route, potentially beginning as seasonal service, may warrant further study because it could serve not only second-home owners in Shelby County but also concentrations in surrounding markets, including Pulaski County, Arkansas; Madison County, Tennessee; and DeSoto County, Mississippi.
The example illustrates how second-home data can move route analysis beyond simply identifying where vacation properties are located. By connecting second-home locations with owners’ primary residences, nearby origin airports, existing air service, and O&D demand, airports can identify geographic relationships that may support new or expanded nonstop service.
Example: A Mountain Resort Airport
A mountain destination may have only a modest permanent population. However, second-home ownership may be concentrated among residents of major metropolitan areas such as:
- Dallas
- Houston
- Chicago
- Los Angeles
These owner markets may align closely with winter passenger demand. For an airline evaluating seasonal ski service, second-home ownership provides another indicator that demand is supported not only by occasional tourists but also by a recurring base of property owners who have an ongoing reason to travel to the destination. This can help explain seasonal O&D patterns and identify markets that may warrant further route analysis.
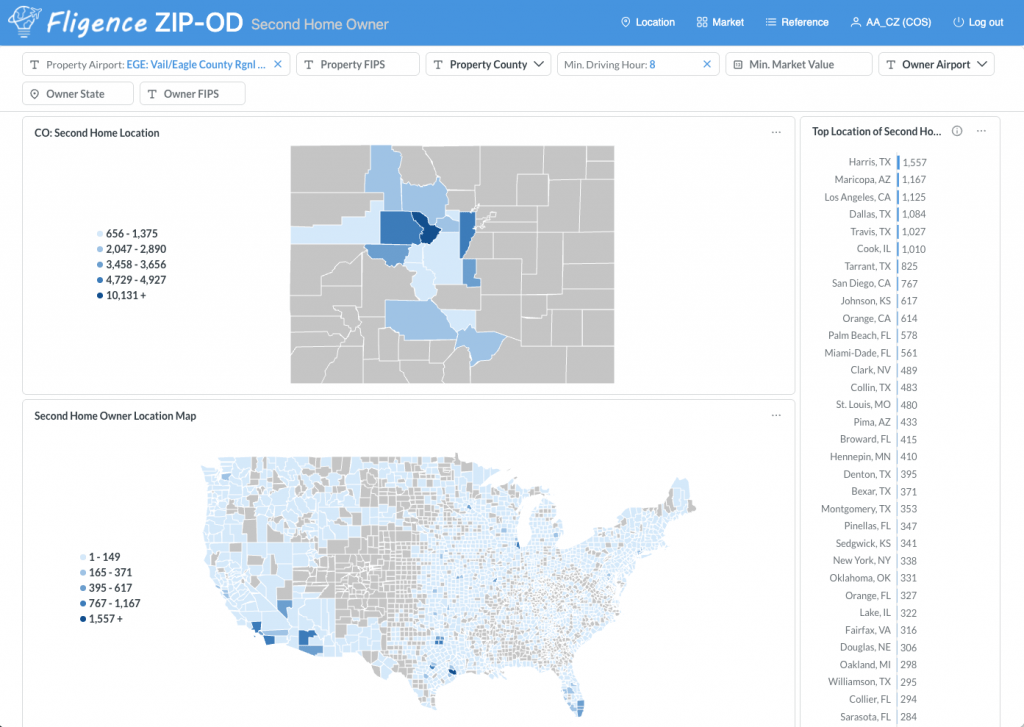
Eagle County Regional Airport (EGE) serves the Vail and Beaver Creek resort region in Colorado. Although the area’s permanent population is relatively modest, its substantial second-home and seasonal-resident market can significantly expand the region’s effective air travel market.
As shown in Fig. 8, second-home ownership is concentrated among people whose primary residences are in several major metropolitan areas, including Dallas (Dallas and Tarrant counties, TX), Houston (Harris County, TX), Phoenix (Maricopa County, AZ), Los Angeles, Austin (Travis County, TX), Chicago (Cook County, IL), San Diego, and Kansas City (Johnson County, KS). Airport teams can compare these owner markets with winter O&D demand, existing nonstop service, fares, seasonality, and airport accessibility near the owners’ primary residences.
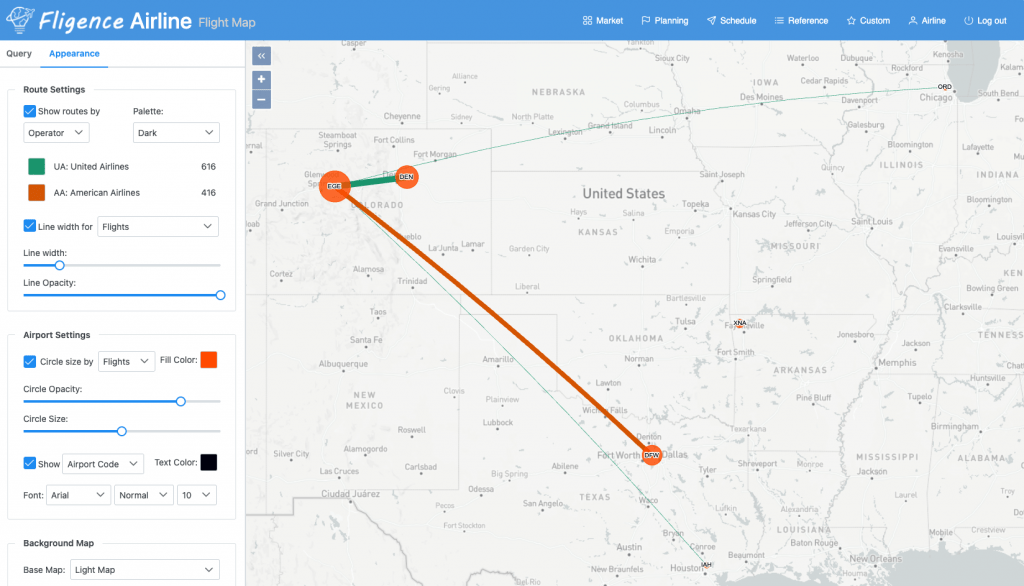
Fig. 9 shows that EGE currently has nonstop service to several major markets represented in the second-home ownership data, including Dallas/Fort Worth (DFW), Chicago (ORD), and Houston (IAH), as well as Denver (DEN). This alignment demonstrates how second-home ownership can help explain the underlying demand for existing seasonal and year-round air service.
More importantly, the analysis can reveal potential opportunities that are not currently served nonstop. For example, concentrations of second-home owners in Phoenix, Los Angeles, and Austin may warrant further study for seasonal service. The airport can evaluate these markets alongside O&D demand, leakage, fares, seasonality, and available capacity to determine whether the opportunity is strong enough to support additional nonstop flights.
For airlines, second-home ownership provides evidence that winter demand is supported not only by occasional ski visitors but also by travelers with a recurring reason to return to the Vail and Beaver Creek region. This can provide valuable additional context when evaluating seasonal route opportunities.
Example: A Warm-Weather Retirement Market
A warm-weather destination may attract second-home owners and seasonal residents from northern states.
Large ownership concentrations might exist in:
- New York
- New Jersey
- Pennsylvania
- Ohio
- Michigan
These travelers may spend several months each winter in the region.
The resulting demand can support strong seasonal air service even when the permanent local population would not appear sufficient on its own.
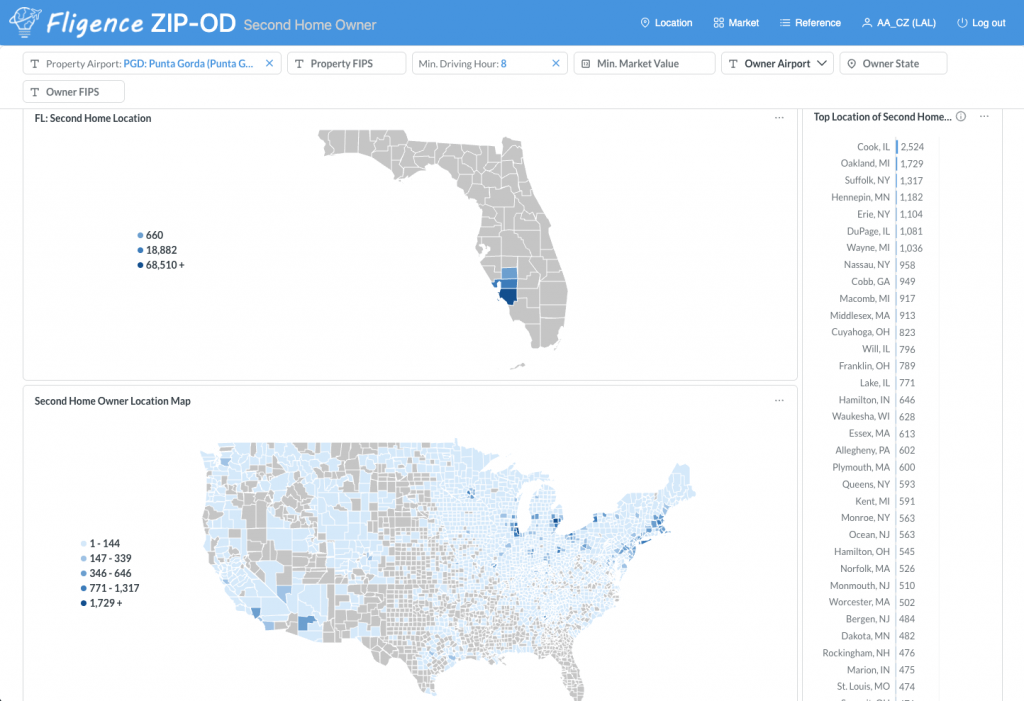
Punta Gorda Airport (PGD) serves Charlotte County and the surrounding Southwest Florida region, an area that attracts retirees, second-home owners, and seasonal residents from northern states.
Second-home analysis in Fig. 10 reveals concentrations of property owners whose primary residences are in major northern markets, including Chicago (Cook and DuPage counties, IL), Detroit (Oakland, Wayne, and Macomb counties, MI), New York (Suffolk and Nassau counties, NY), Minneapolis (Hennepin County, MN), and Boston (Middlesex, Essex, and Plymouth counties, MA). Many of these owners may spend extended periods in Southwest Florida during the winter, creating recurring seasonal travel between their primary residences in the North and their second homes in Florida.
The importance of these northern markets is also reflected in PGD’s air service network. The airport offers an extensive range of nonstop destinations operated by Allegiant Air, including seasonal winter and spring service to Minneapolis/St. Paul (MSP). The alignment between second-home owner locations and existing nonstop service illustrates how second-home data can help explain the underlying demand for seasonal routes.
Compare Second-Home Ownership with Actual O&D Demand
Second-home data is most valuable when connected to passenger behavior.
Suppose 1,500 second-home owners have primary residences in metropolitan Boston.
That is interesting.
The next questions are:
- How much O&D demand exists between Boston and our region?
- How seasonal is it?
- Which airports are travelers using?
- How much demand does our airport capture?
- Is there nonstop service?
- What are the fares?
If second-home ownership and aviation demand tell the same story, the route opportunity becomes more credible.
Second-Home Data Can Explain Demand That Looks Unusually High
Sometimes an airport may see surprisingly high O&D demand from a distant metropolitan area without an obvious:
- Corporate relationship
- Population connection
- University connection
Second-home ownership may help explain it.
A relatively small resort market could have strong passenger demand from New York because thousands of New York-area households own property there.
The demographic connection is hidden if the analysis looks only at permanent residents.
Second Homes Can Help Explain Premium Demand
Second-home ownership may also provide context for premium passenger patterns.
A community containing high-value properties owned by households from major affluent metropolitan areas may generate disproportionate demand for:
- First class
- Business class
- Premium economy
- Flexible fares
Again, property ownership does not prove premium travel.
But when high-value second-home concentrations align with observed premium passenger demand, the combination can strengthen the market story.
Use Second-Home Data for Targeted Marketing
Second-home owners can be a particularly attractive audience because they have an established reason to visit repeatedly.
Instead of advertising broadly across an entire metropolitan area, an airport or airline may be able to focus on geographic markets containing large numbers of owners.
Campaign messages might emphasize:
- Nonstop access to your second home
- Spend less of your weekend driving
- Fly closer to your property
- Seasonal nonstop service
For these travelers, convenience can be especially compelling because they make the journey repeatedly.
Partner with Local Tourism and Real Estate Organizations
Second-home insights can also support partnerships with:
- Destination marketing organizations
- Resort associations
- Homeowner associations
- Tourism businesses
- Real estate organizations
- Chambers of commerce
These organizations may already communicate regularly with property owners.
Airport route announcements or service information can potentially reach a highly relevant audience through existing local networks.
Second-Home Markets Can Support Airline Business Cases
For Air Service Development teams, second-home data can add another layer to airline presentations.
Instead of relying only on:
- Permanent population
- Current O&D
- Tourism visitation
The airport can demonstrate:
- Number of second homes
- Owner origin markets
- Property values
- Seasonality
- Relevant origin airports
- Current passenger demand
For certain resort airports, this can significantly improve how the true market is presented.
Do Not Simply Convert Second Homes into Passengers
A second home should not be treated as a guaranteed number of annual airline passengers.
Some owners may:
- Drive or use surface transportation
- Visit infrequently
- Use private aviation
- Spend most of the year at the property
- Use competing airports
The purpose of second-home data is to identify potential travel relationships and explain observed demand, not to create passengers that are not supported by aviation data. The strongest analysis combines property information with actual O&D behavior.
How Air Service Development Teams Can Use Second-Home Data
For ASD teams, second-home analysis can help:
- Explain unusually strong O&D markets
- Identify recurring leisure demand
- Find seasonal route opportunities
- Identify owner origin markets
- Determine relevant origin airports
- Strengthen airline business cases
- Understand premium demand
- Support discussions about seasonal frequency
This is particularly useful for airports serving tourism and resort regions.
How Marketing Teams Can Use Second-Home Data
For Marketing teams, second-home analysis can help identify:
- Where repeat visitors live
- Which metropolitan areas deserve route marketing
- Where convenience messaging may resonate
- Which markets support seasonal campaigns
- Where airline cooperative marketing could be concentrated
Unlike broad tourism advertising, second-home marketing can focus on travelers who already have a strong and recurring connection to the destination.
How Fligence ZIP-OD Helps Analyze Second-Home Demand
FlightBI’s Fligence ZIP-OD Second Home Dashboard helps airports understand the geographic relationships created by second-home ownership.
The dashboard can show:
- Where second homes are located
- Where property owners’ primary addresses are located
- Owner and property relationships
- Drive time
- Property value
- and the top airports associated with owner locations.
Airport teams can then compare these patterns with other Fligence aviation measures such as:
- O&D passenger demand
- Airport market share
- Passenger leakage
- Destination demand
- Premium passenger patterns
This helps transform property data into aviation intelligence.
Instead of simply knowing:
“Our region has many second homes,”
an airport can investigate:
“Where do those owners live, which airports are convenient to them, how much air travel already exists, and how well does our airport serve that demand?”
Build a Second-Home Air Service Opportunity Analysis
A practical analysis can evaluate each owner market using:
| Measure | Question |
|---|---|
| Second-home owners | How many owners live in this market? |
| Property value | What is the economic profile of the ownership base? |
| Distance | Is air travel likely to be relevant? |
| Origin airports | Which airports are convenient to the owners? |
| O&D demand | How many passengers already travel between the regions? |
| Seasonality | When is demand strongest? |
| Airport share | How much traffic does our airport capture? |
| Leakage | Which competing airports capture the rest? |
| Air service | Is there adequate nonstop service? |
The strongest opportunities are usually markets where several indicators point in the same direction.
The Bottom Line
How do second-home owners and seasonal residents affect airport demand?
They can create a large, recurring passenger market that is not visible in permanent population statistics.
Every second home potentially creates a geographic relationship between:
where the property is located
and
where the owner primarily lives.
When many owners come from the same metropolitan area, those relationships can contribute to significant recurring air travel demand.
For airport Air Service Development and Marketing teams, the strongest analysis combines:
second-home ownership + owner geography + property characteristics + origin airports + O&D demand + seasonality + airport market share
to understand the true aviation opportunity.
With the Fligence ZIP-OD Second Home Dashboard, airports can identify where second-home owners live, where their properties are located, property values, drive-time relationships, and the airports most relevant to those owners.
The strategic question is not simply:
“How many permanent residents live in our market?”
It is:
“How many people have a recurring reason to travel here—and where are they coming from?”