
Knowing that an airport’s region is growing is useful. Knowing where those new residents came from can tell Air Service Development and Marketing teams much more.
When people relocate, they rarely leave all of their connections behind. Family and friends remain in their former communities. Business relationships continue. Some people keep property, clients, employers, or other professional ties in the places they left.
Those relationships can generate recurring air travel in both directions. A family that moves from Chicago to Florida may fly back to Chicago several times a year, while relatives and friends from Chicago may travel south to visit them.
For an airport, migration data can therefore help answer an important question:
Which outside markets are developing stronger connections with our region?
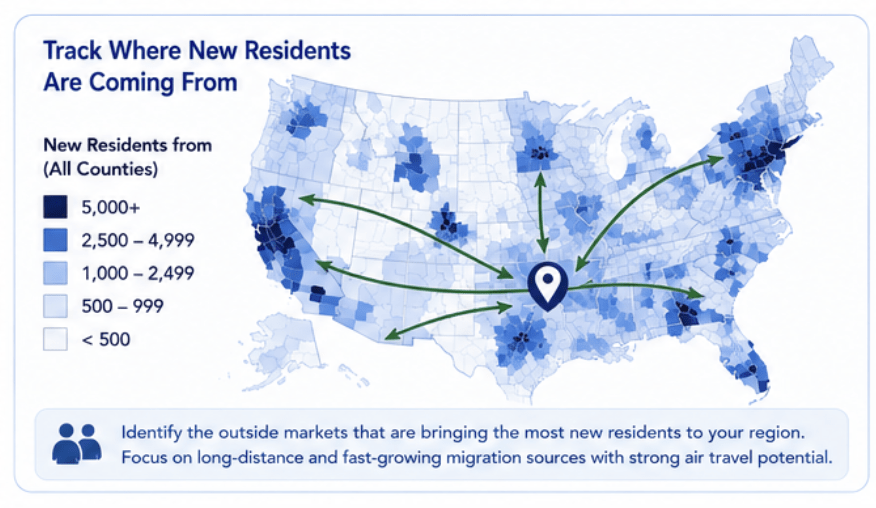
FlightBI’s Fligence ZIP-OD Migration Dashboard uses IRS migration data to identify county-to-county migration patterns. Airports can see where residents are moving from, how those flows are changing, the income associated with the migration, and which airports are being used for travel between the two regions.
Start with Where Growth Is Coming From
Population growth tells an airport that its potential market is getting larger. Migration provides another piece of the story by showing where some of that growth originated.
Suppose a county in North Carolina gains 25,000 residents. If most came from neighboring counties, the growth may have little effect on long-distance air travel. If thousands relocated from New York, Chicago, Boston, or South Florida, the implications could be very different.
Distance matters. Someone moving 20 miles may simply shift from one part of an airport catchment to another. Someone moving 1,000 miles may develop a recurring need to fly back to their former home market. That is why airport teams should separate local, regional, and long-distance migration rather than treating every new resident the same.
Airports should also look beyond individual counties. Airline markets rarely follow county boundaries. Moderate migration from Cook, DuPage, and Lake counties in Illinois may collectively reveal a much larger relationship with the Chicago metropolitan area. Grouping migration sources into meaningful metropolitan air markets makes the data much more useful for route planning.
Look for Relationships That Are Building Over Time
One year of migration can be interesting. A pattern that continues for several years is more important.
| Year | Residents Moving from Los Angeles Area to Austin Area |
|---|---|
| 2019 | 28,650 |
| 2020 | 35,568 |
| 2021 | 44,918 |
| 2022 | 46,059 |
A pattern like this suggests that the relationship between the two regions is strengthening.
Migration also accumulates. A person who moved five years ago may still regularly visit family or conduct business in the former home city. When hundreds or thousands of people make similar moves each year, the destination gradually develops a larger population with ties to that outside market.
This is particularly visible in retirement destinations. Sustained migration from New York, New Jersey, Pennsylvania, Ohio, or Michigan into warmer regions can create long-lasting VFR demand. New residents travel north to see family and friends, while children, grandchildren, and friends travel south to visit them.
Remote and hybrid work can create a similar pattern. Someone may move to another state while maintaining ties to a corporate headquarters, clients, coworkers, or an industry network in the former city. Daily commuting disappears, but periodic air travel may take its place.
Connect Migration to Actual Passenger Demand
Migration becomes much more useful for Air Service Development when it is combined with aviation data. After identifying a significant source market, examine:
- Current O&D passenger demand and PDEW
- Passenger growth over time
- Nonstop versus connecting traffic
- Local airport market share
- Competing-airport usage
- Current air service and fares
Consider two markets with similar current O&D demand. Market A has little migration connection with the airport’s region. Market B is also one of the region’s largest and fastest-growing sources of new residents.
Both may be good air service opportunities, but Market B has another factor supporting the demand story. The airport can show an airline that passenger traffic is already strong and that the underlying relationship between the regions continues to grow.
Migration can also identify markets worth watching before they rise to the top of an O&D ranking. A market with moderate passenger volume today may deserve more attention if migration from that region has been growing rapidly for several years. If O&D demand, fares, and leakage begin rising as well, the market may be developing into a stronger route opportunity.
Migration should still be treated as supporting evidence rather than converted directly into a passenger forecast. If 10,000 people move between two regions, there is no defensible rule that each person will generate a fixed number of annual airline trips. Income, family ties, distance, airfare, service, business relationships, and transportation alternatives all affect travel behavior.
Observed O&D remains the evidence of actual passenger demand. Migration helps explain why that demand exists and where it may be heading.
Which Airports Are Capturing the Traffic?
Knowing that residents are moving from New York or South Florida is only part of the analysis.
Large metropolitan areas have multiple airports. A New York relationship may involve JFK, LGA, and EWR. South Florida may involve MIA, FLL, and PBI. On the local side, passengers may also be dividing their trips between the local airport and one or more competing airports.
This creates a more practical ASD question:
Which airport pairs are actually carrying the traffic between these regions?
Fligence connects IRS migration relationships with airport usage. An airport can identify a strong migration relationship with South Florida, for example, and then examine whether travelers are primarily using MIA, FLL, or PBI on one end and which airports they use on the local end.
That can uncover leakage opportunities. A market becomes particularly interesting when three conditions appear together:
Strong migration relationship + strong passenger demand + high leakage
Depending on the existing service, that pattern could support a new route discussion, additional frequency, airline marketing, or a campaign aimed at recapturing passengers currently using another airport.
Migration Is Also a Marketing Opportunity
New residents are an attractive audience even when there is no immediate route-development opportunity. Someone who recently moved into an area may know very little about the local airport. They may not know which airlines serve it, where they can fly nonstop, how close it is, or how its fares and parking compare with a larger competing airport. They may simply continue using the airline and airport-search habits they developed in their previous city.
Instead of a generic message such as “Fly Local,” an airport could communicate something more useful:
“New to the area? See where you can fly nonstop from your new home airport.”
The goal is to introduce the airport early, before a competing airport becomes the household’s default choice.
Migration data can also help airports and destination marketing organizations identify external audiences. If thousands of people have moved from Chicago into a region, Chicago may contain a growing pool of friends and relatives likely to visit. The same migration relationship can therefore support both outbound resident traffic and inbound visitor traffic.
Income Adds Context to Migration
IRS migration data also includes adjusted gross income associated with migrating tax returns. Two metropolitan areas may each send 5,000 new residents into an airport’s region, but the economic characteristics of those households can differ substantially. A higher-income migration flow may have different implications for travel frequency, premium demand, international travel, leisure travel, or second-home activity.
Income alone does not predict travel behavior, but it helps airports understand what kind of population growth is occurring, rather than simply how many people are arriving.
Watch Where New Residents Are Settling
Migration can also change the geography of an airport catchment.
New residents may concentrate in fast-growing suburbs, retirement communities, urban neighborhoods, or new residential developments. If these areas lie between competing airports, population growth can gradually shift airport market shares.
A county that represented a small portion of the airport’s passenger base ten years ago could become one of its most important markets. For Marketing teams, these communities may deserve additional airport-awareness or route-specific campaigns. For ASD teams, they can provide an early indication that the geographic center of passenger demand is moving.
How Fligence ZIP-OD Helps
The Fligence ZIP-OD Migration Dashboard helps airport teams move from a demographic observation to an aviation analysis.
Instead of simply knowing:
“A lot of people are moving here from New York.”
an airport can determine:
“New York is one of our largest migration sources, passenger demand between the regions is significant, and these are the airports currently capturing that traffic.”
For Air Service Development, that evidence can strengthen an existing route story or identify an emerging market to monitor. For Marketing, it can identify new-resident audiences, VFR opportunities, and outside markets with growing ties to the region.
A practical migration-source analysis should consider:
| Measure | Question |
|---|---|
| Migration volume | How many residents are moving here? |
| Migration trend | Is the flow growing or declining? |
| Migration income | What is the economic profile of the new residents? |
| Distance | Is air travel practical between the markets? |
| O&D demand | How much passenger traffic already exists? |
| O&D trend | Is passenger demand growing? |
| Airport usage | Which airports are capturing the traffic? |
| Local airport share | How much does our airport capture? |
| Air service | Is there nonstop service or a meaningful service gap? |
The Bottom Line
Migration data helps airports understand how their market is changing and which outside regions are becoming more closely connected to it. New residents bring relationships with them. Family, friends, employers, clients, property, and professional networks can continue generating travel long after the move itself.
The most useful analysis connects those migration patterns with actual passenger behavior. With the Fligence ZIP-OD Migration Dashboard, airports can identify where new residents are coming from, measure how those relationships are changing, and see which airports currently capture the associated travel.
The question for an airport is ultimately:
Which migration sources are creating stronger travel relationships with our region, and how well is our airport positioned to serve them?