
Household income can influence both how often people travel by air and how they choose between airports and flight options. Higher-income households generally have more discretionary income for leisure trips, international travel, second-home travel, and premium products. They may also be more willing to pay for convenience.
But income does not determine airport choice by itself. A high-income traveler may pay more for a convenient nonstop from a nearby airport, while another may drive farther to a larger airport for better frequency, international connectivity, or a preferred airline.
For airport Air Service Development and Marketing teams, the useful question is not simply where the wealthiest households live. It is how household income relates to passenger demand, travel propensity, destinations, fares, service quality, and airport choice.
Higher-Income Households Often Generate More Air Travel
Air travel is discretionary for many households. As disposable income increases, people generally have greater ability to spend on:
- Vacations and weekend trips
- International travel
- Visiting friends and relatives
- Second-home travel
- Premium travel
As a result, two communities with similar populations can generate very different levels of passenger demand.
Consider the following ZIP codes in the Northern Virginia area:
| ZIP 22066 Great Falls, VA | ZIP 22553 Spotsylvania, VA | |
|---|---|---|
| 2023 Population | 16,884 | 16,960 |
| 2023 Median household income | $250,000+ | $135,856 |
| 2025 Annual air passenger trips | 94,196 | 29,687 |
Source: American Community Survey 2025 5-Year Estimate, Fligence ZIP-OD
The two ZIP codes have very similar population, but median household income at ZIP 22066 is almost twice of that at ZIP 22553. As a result, ZIP 22066 generated more than 3 times air trips than ZIP 22553. This demonstrates why population alone does not fully explain air travel demand. Population measures the potential size of the market, while income can help explain differences in the propensity to travel.
The relationship is not necessarily linear. Moving from a lower-income household to a middle-income household may have a large effect on whether discretionary air travel is affordable. At higher income levels, additional income may have more influence on destination choice, trip frequency, international travel, premium products, and willingness to pay for convenience.
Twice the household income therefore does not mean twice the passenger demand, as shown in Table 1. Actual passenger behavior still needs to be measured.
Measure Travel Propensity Alongside Income
One way to understand the relationship is to compare passenger trips with households or population in each ZIP code.
| ZIP Code | Population | Median Income per Person | Annual Air Trips | Trips per Person |
|---|---|---|---|---|
| ZIP 22963 Palmyra, VA | 16,786 | 48,247 | 20,069 | 1.2 |
| ZIP 22553 Spotsylvania, VA | 16,960 | 59,197 | 29,687 | 1.8 |
| ZIP 22066 Great Falls, VA | 16,884 | 123,162 | 94,196 | 5.6 |
Source: American Community Survey 2025 5-Year Estimate, Fligence ZIP-OD
As household income rises significantly from ZIP 22963 to ZIP 22066, income helps explain the difference in travel propensity. Please note that in Tables 1 and 2, a trip is defined as a one-way O&D journey. Since many travelers make round trips, the trip counts shown in the tables may be roughly twice the number of trips as commonly understood in everyday conversation.
Other factors can be equally important. University populations, corporate employment, tourism, military activity, age, and geography can all affect passenger demand. The purpose of income analysis is therefore not to predict travel from income alone, but to help explain patterns observed in actual passenger data.
Look Beyond Median Household Income
Median household income provides a useful summary of a community, but it can hide substantial differences in the income distribution.
Consider two ZIP codes: 34606 (Spring Hill, FL) and 91316 (Encino, CA). As shown in Fig. 1, the two ZIP codes have nearly identical average household incomes ($60,450 vs. $60,455) and similar numbers of households (12,741 vs. 12,883). However, their income distributions are very different. ZIP 91316 has far more households with annual incomes above $150,000 than ZIP 34606.
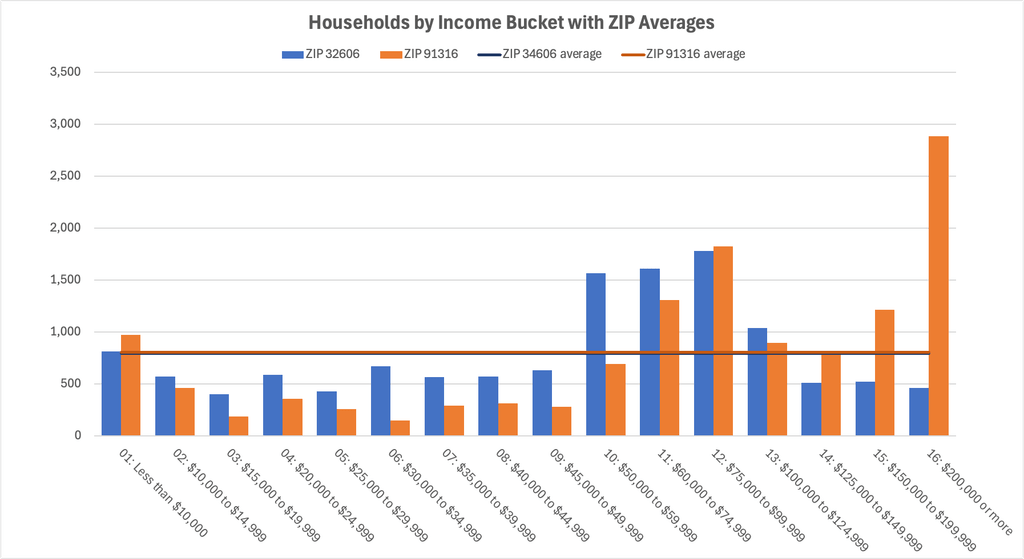
Guess which ZIP code generates more premium passengers? Fligence ZIP-OD data shows that ZIP 91316 generated 166,778 O&D trips, including 5,740 premium trips in 2025, while ZIP 34606 generated 101,008 O&D trips and only 379 premium trips. Despite having nearly identical average household incomes and household counts, ZIP 91316 generated more than 15 times as many premium trips.
For airport analysis, household counts by income bucket can therefore provide more information than a single median figure. An airport evaluating premium or long-haul demand, for example, may be particularly interested in the number of households above $150,000 rather than simply whether the ZIP code has a high median income.
Income Can Affect the Types of Trips People Take
Income differences may influence not only how often people travel but also where and how they travel.
Higher-income communities may generate relatively more demand for:
- Long-haul and international travel
- Premium leisure destinations
- Ski and resort markets
- Second-home destinations
- Premium cabins and flexible fares
Lower- and middle-income communities can still generate substantial air travel, but their destination mix and sensitivity to fares may differ.
This can be useful in Air Service Development. Two destinations with similar PDEW may represent different airline opportunities if one draws heavily from affluent communities and generates stronger business, international, or premium demand.
Income Can Affect the Trade-Off Between Fare and Convenience
Passengers make airport choices by balancing several costs, including airfare, ground transportation, parking, travel time, and inconvenience. Different passengers place different values on each of these factors.
A more price-sensitive traveler may be willing to drive farther, take a connecting flight, or accept a less convenient departure time to save money. A less price-sensitive traveler may place greater value on:
- A nearby airport
- Nonstop service
- A better schedule
- Shorter total travel time
- A preferred airline
Consider a traveler choosing between two airports:
| Local Airport | Competing Airport | |
|---|---|---|
| Drive time | 30 minutes | 90 minutes |
| Service | Nonstop | Nonstop |
| Fare | $420 | $350 |
The local airport costs $70 more. Some travelers will choose the competing airport based on fare. Others may consider the additional $70 worthwhile to save two hours of round-trip driving.
Higher-income travelers and business travelers may place a higher monetary value on their time, making convenience particularly important in some affluent markets.
High Income Does Not Guarantee High Local Airport Share
An affluent ZIP code may generate substantial passenger demand and still have a low share for the local airport.
Higher-income travelers may value convenience, but they can also have higher expectations for the airline product. They may be willing to drive farther for:
- Better nonstop availability
- Higher frequency
- More schedule flexibility
- Airline loyalty or status benefits
- Premium cabins and lounges
- Better international connectivity
This creates an interesting relationship. Higher income may increase the value passengers place on saving time getting to the airport, while also increasing the value they place on better air service once they get there.
If a larger airport offers a significantly better flight option, an affluent traveler may drive farther to use it. If the local airport offers a comparable nonstop, the same traveler may strongly prefer the convenience of staying local.
The Same Fare Difference Can Have Different Effects Across the Market
Suppose the local airport’s average fare to a destination is $40 higher than the fare from competing airports. That difference may matter considerably in one ZIP code and relatively little in another.
In a more price-sensitive market, the $40 difference could contribute to leakage. In an affluent market, passengers may place more weight on:
- Drive time
- Parking convenience
- Nonstop service
- Departure time
- Total journey time
This is why airport teams should avoid applying one fare-response assumption to the entire catchment. The same airfare difference can produce different passenger behavior in different parts of the market.
Income and Premium Travel Are Related, but Not the Same
Higher-income communities may generate more first-class, business-class, premium-economy, and flexible-fare travel. However, household income should not be used as a substitute for premium passenger data.
A corporate traveler may fly in a premium cabin because an employer pays for the ticket. At the same time, many affluent leisure travelers regularly purchase economy fares.
A stronger analysis compares household income distribution with estimated premium passenger behavior rather than assuming one directly predicts the other.
This distinction becomes particularly important when building an airline business case for a route where premium revenue could materially affect route economics.
Employment Adds Another Dimension to Travel Demand
Household income and residential demographics remain important for airport catchment analysis because most travelers begin and end their journeys at home. Where passengers live also plays a major role in determining which airport they are most likely to use.
Employment characteristics provide another dimension. A region with large concentrations of corporate headquarters, technology companies, government agencies, consulting firms, hospitals, and other professional employers may generate substantial business travel. These employers can increase travel propensity among residents across the surrounding catchment, even when residential income alone does not fully explain the demand.
For airport air service development, employment data is therefore most useful as a complement to household demographics and actual passenger behavior. Household data helps show where potential passengers live, while employment data helps explain why some markets may generate more business and premium travel.
Use Income to Understand Differences in Airport Share
Income can provide another layer of explanation when neighboring ZIP codes behave differently.
Suppose two ZIP codes have similar populations, drive times, and destination patterns, but very different local airport shares:
- ZIP A: 65% local airport share
- ZIP B: 40% local airport share
If ZIP B is considerably more affluent, the airport might investigate whether those travelers have stronger airline loyalty, premium-product preferences, international travel needs, or frequency requirements that lead them to a larger competing airport.
On the other hand, if the local airport already offers a comparable nonstop product, ZIP B could be an attractive target for convenience-focused marketing. Income provides context for the difference. It does not establish the cause by itself.
Income Can Help Shape Airport Marketing
Economic characteristics can also help airport Marketing teams determine which value propositions are worth testing.
In more price-sensitive markets, messaging might emphasize:
- Competitive fares
- Low-cost service
- Affordable parking
- Total trip savings
In higher-income markets, messaging may place greater emphasis on:
- Time savings
- Nonstop convenience
- Easy airport access
- Simple parking
- Schedule quality
- Premium airline products
This does not mean every person in a high-income ZIP code behaves the same way. The purpose is to use aggregate market characteristics alongside passenger behavior to develop and test more relevant messages.
Use Income to Add Context to Route Opportunities
Two destinations with similar passenger volumes can have different economic characteristics.
Consider:
| Market A (e.g. Orlando) | Market B (e.g. San Francisco) | |
|---|---|---|
| Demand | 100 PDEW | 95 PDEW |
| Household income | Moderate | High |
| Primary demand | Leisure | Business/premium |
Market A has slightly more passengers, but Market B may still warrant close attention because of its stronger business and premium characteristics.
Airlines care about more than passenger volume. Fare potential, passenger mix, premium demand, business traffic, and network contribution can all affect the attractiveness of a route. Income data can help provide context for these factors, particularly when combined with actual passenger and fare information.
Analyze Income Around the Passenger, Not Just the Airport
Describing an entire catchment with a statement such as “Median household income in our market is $92,000” can hide substantial geographic differences.
A more useful analysis examines the economic characteristics of the ZIP codes that matter to a particular question, such as:
- ZIP codes producing the most passengers
- ZIP codes generating demand to a proposed destination
- High-leakage ZIP codes
- ZIP codes generating premium passengers
This connects household income directly to the aviation market being studied.
For example, a ZIP code with high passenger demand, many $150,000+ households, strong premium demand, low local airport share, and heavy usage of a competing hub presents a very different opportunity from a high-income ZIP code with little air travel demand.
How Fligence ZIP-OD Helps Analyze Income and Air Travel
FlightBI’s Fligence ZIP-OD allows airport teams to examine household income alongside passenger geography and airport behavior.
The platform includes ZIP-level heat maps for:
- Median income per person
- Household counts by income bucket
Airport teams can compare those economic patterns with:
- Passenger demand
- Airport market share
- Passenger leakage
- Destination demand
- Premium passenger distribution
This moves the analysis beyond “Where are household incomes highest?” to questions that are more useful for Air Service Development and Marketing:
- Do higher-income ZIP codes generate more passenger demand?
- Does the airport capture those passengers effectively?
- Which destinations are important to affluent communities?
- Are premium travelers concentrated in the same areas?
- Are affluent travelers disproportionately using competing airports?
The objective is to understand whether income helps explain actual passenger behavior, not simply to produce an income map.
Build an Income and Passenger Opportunity Map
One practical approach is to classify ZIP codes using both economic and aviation characteristics:
| Market Profile | Potential Meaning |
|---|---|
| High income + high passenger demand | Important established or potential high-value market |
| High income + low airport share | Potential air service, premium, or marketing opportunity |
| Moderate income + high passenger demand | Large market where fare and value may be especially important |
| High income + high premium demand | Potentially important for business, international, or premium-oriented service |
This gives household income a clear aviation purpose rather than treating it as a standalone demographic statistic.
The Bottom Line
Household income can help explain how frequently people travel, the types of trips they take, their sensitivity to fares, and how they value time and convenience. But it is only one part of airport choice.
Passengers still make decisions based on nonstop availability, fare, frequency, schedule, drive time, airline preference, destination, and many other factors.
For airport teams, the strongest analysis combines household income with actual passenger demand and airport-choice behavior. Fligence ZIP-OD makes it possible to compare median household income and detailed income distributions with ZIP-level passenger demand, leakage, market share, destinations, and premium travel.
The goal is not simply to identify wealthy communities. It is to understand how economic characteristics relate to who travels, how much they travel, where they go, and which airport they choose.