
Airport marketing budgets are limited, so the goal should not be to advertise equally across the entire catchment area. Some communities already use the airport heavily, while others generate substantial air travel but send a large share of their passengers to competing airports.
The strongest marketing opportunities are usually areas that combine high passenger demand, meaningful passenger leakage, reasonable access to the airport, relevant air service, and room for the airport to increase market share.
For airport Marketing teams, the key question is not simply:
“Where do our passengers live?”
It is:
“Where are there enough travelers, and enough opportunity, for marketing to make a difference?”
Start with Total Air Travel Demand
A useful starting point is to identify the ZIP codes that generate the most air travel demand.
Suppose an airport’s broader market includes:
| ZIP Code | Total Air Passenger Demand |
|---|---|
| ZIP A | 50,000 |
| ZIP B | 42,000 |
| ZIP C | 30,000 |
| ZIP D | 18,000 |
| ZIP E | 10,000 |
These figures show where travelers are concentrated, but they do not tell the airport where marketing dollars will have the greatest impact.
A ZIP code generating 50,000 annual trips may look like the obvious target. But if the airport already captures 85% of those passengers, there may be relatively little share left to win. Another ZIP code generating 40,000 trips with only a 35% airport share could offer a much larger growth opportunity.
This is why marketing analysis should combine total passenger demand with current airport market share.
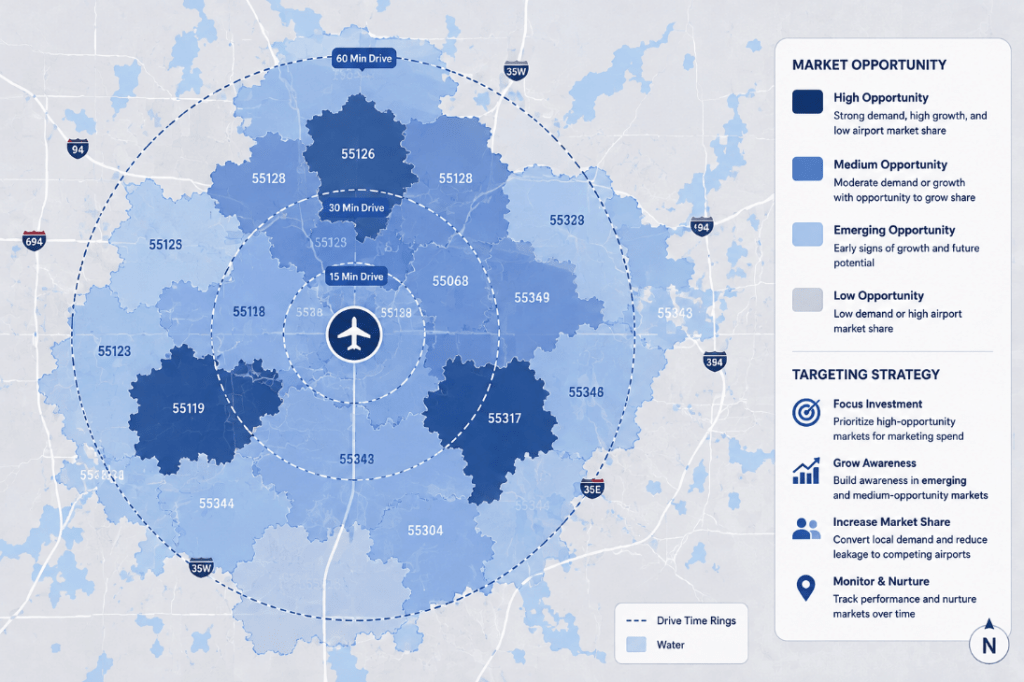
Find High-Demand Markets Where the Airport Underperforms
Consider two ZIP codes:
| ZIP Code | Total Demand | Airport Passengers | Airport Share | Uncaptured Demand |
|---|---|---|---|---|
| ZIP A | 40,000 | 32,000 | 80% | 8,000 |
| ZIP B | 35,000 | 14,000 | 40% | 21,000 |
ZIP A currently sends more passengers to the airport, but the airport already controls most of that market. ZIP B is smaller overall, yet 21,000 annual trips are going through other airports.
For passenger acquisition, ZIP B may deserve more attention.
This distinction matters because airports often focus marketing on the communities that already generate the most airport passengers. Those areas are certainly important, but they may be core markets to retain rather than the best markets for incremental growth.
High Leakage Alone Does Not Make a Good Target
The opposite mistake is to rank markets purely by leakage rate.
A ZIP code with 90% leakage sounds attractive until the airport discovers that it generates only 6,000 annual trips. Another ZIP code with a 45% leakage rate and 50,000 annual trips represents 22,500 uncaptured trips.
The second market may offer much greater potential.
The airport also needs to consider whether those passengers can realistically be won. A community located 110 minutes from the airport and 25 minutes from a major hub may naturally have very low local airport share. Heavy advertising is unlikely to overcome that geographic disadvantage.
A better target may be a community that:
- Generates substantial air travel
- Has meaningful leakage
- Is reasonably close to the airport
- Already considers the airport a viable option
- Has relevant local air service
The objective is not to find the ZIP code with the highest leakage percentage. It is to find the largest pool of realistically addressable passengers.
Air Service Determines Whether Marketing Can Work
Marketing cannot compensate for a weak air service product.
Suppose many residents in a ZIP code use a competing airport because the local airport does not offer service to the destinations they need. Advertising the convenience of the local airport is unlikely to change much.
The situation is very different if the local airport already offers a competitive option, such as:
- Nonstop service
- Reasonable fares
- Useful departure times
- Adequate frequency
- A substantial drive-time advantage
For example, if the airport already offers nonstop Orlando service but many nearby Orlando passengers continue to drive to another airport, the issue may be awareness, perception, habit, or a misunderstanding about fares.
That is a problem marketing can potentially address.
Target the Route as Well as the ZIP Code
Airport marketing becomes much more precise when geography is combined with destination demand.
Instead of simply identifying ZIP 12345 as a marketing target, the airport can determine what residents of that ZIP code actually fly.
Suppose the airport is launching a new Nashville nonstop. Marketing teams can identify ZIP codes based on:
- Total Nashville passenger demand
- Nashville passengers currently using competing airports
- Current local airport share to Nashville
- Drive time to the local airport
- Availability of the new nonstop
This creates a much more relevant audience: people who live within a specific geographic market and have already demonstrated demand for Nashville travel.
The same approach can be used for existing routes. If an airport has strong nonstop service to Orlando but a nearby group of ZIP codes continues to send large numbers of Orlando passengers through another airport, those communities become natural targets for route-specific advertising.
Separate Core Markets from Growth Markets
Not every part of the catchment should receive the same level or type of marketing.
A practical approach is to divide the market into four groups:
| Market Type | Typical Characteristics | Marketing Objective |
|---|---|---|
| Core market | High demand, high airport share | Retention and route awareness |
| Growth market | High demand, moderate/low share, good accessibility | Passenger acquisition |
| Outer market | Meaningful demand, low share, longer drive time | Selective route-specific campaigns |
| Low-opportunity market | Low demand, low share, weak geographic/service advantage | Limited investment |
Growth markets are often the most interesting. Travelers already see the local airport as a viable option, but a substantial portion of the market remains uncaptured.
Core markets still matter, especially when a competitor adds new service or the airport launches a new route. The marketing objective is simply different.
Match the Message to the Market
The reason passengers use another airport can vary by geography, so the same advertisement should not necessarily be used throughout the catchment.
A community with a strong local-airport drive-time advantage might respond to:
“Skip the 90-minute drive. Fly nonstop from your local airport.”
A market where passengers believe the larger airport is always cheaper may need a total-trip-cost message that includes fuel, tolls, parking, and travel time.
For a newly launched route, the message can be much simpler:
“Now nonstop to Nashville from your local airport.”
High-income or premium-oriented markets may respond more to time savings, nonstop convenience, easy parking, and schedule quality than to a message focused entirely on low fares.
The geography identifies who to target. Passenger behavior helps determine what to tell them.
Resident and Visitor Marketing Require Different Geography
Most local passenger-acquisition campaigns focus on residents. The airport identifies where local travelers live and determines which communities have demand that could be shifted from competing airports.
Visitor marketing works in the opposite direction.
A tourism-oriented airport may need to identify the cities and regions where its visitors live. If a beach destination receives substantial visitor demand from Chicago, New York, Boston, and Philadelphia, those origin markets may be more relevant for destination advertising than ZIP codes surrounding the airport.
Hotels, tourism districts, attractions, and second-home locations can help explain where visitors go after arriving, while passenger O&D data identifies where those visitors originate.
Airport teams should therefore keep resident passenger acquisition and inbound visitor marketing separate.
Use Geographic Clusters When They Make Sense
Individual ZIP codes are useful analytically, but marketing campaigns do not always need to be planned one ZIP code at a time.
Several neighboring ZIP codes may have similar characteristics:
- High passenger demand
- Moderate airport share
- Similar drive times
- Strong demand for the same destinations
- Similar demographic characteristics
Together, they may form a meaningful marketing corridor.
These geographic clusters can be easier to use for digital advertising, outdoor media, community partnerships, direct mail, and other campaigns. They also make it easier to compare performance across broader target areas.
A Real-World Example: PVD Competing with Boston Logan
Rhode Island T. F. Green International Airport (PVD) provides a good example. PVD serves Rhode Island and southeastern New England while competing with the much larger Boston Logan International Airport (BOS).
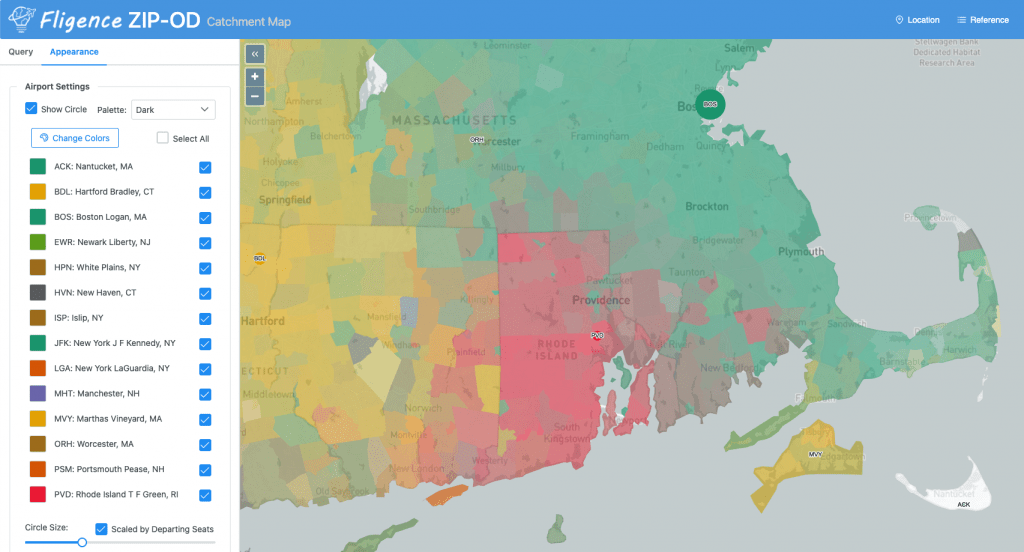
Its broader market can be thought of as three types of communities.
Group A: Communities close to PVD and south of the airport. These areas have significant air travel demand and already generate a high PVD market share. They are important core markets, but because PVD already captures much of the available traffic, the opportunity for additional share may be limited.
Group B: Communities between PVD and BOS. These areas can be particularly interesting. They may have substantial passenger demand and reasonable access to PVD, but only a moderate PVD market share. Travelers already demonstrate that PVD is a viable option, while many continue to drive to BOS.
This can create a strong marketing opportunity. Campaigns can focus on PVD’s nonstop destinations, easier airport access, parking, shorter ground travel, or other advantages relevant to these communities.
Group C: Communities closer to Boston. PVD may capture some passengers from these areas, but convincing large numbers of travelers to bypass BOS is more difficult. Marketing may make sense when PVD offers a unique nonstop, a strong fare advantage, or another specific reason to make the longer drive.
The PVD example illustrates an important point: the communities generating the most airport passengers today are not necessarily the communities offering the greatest potential for growth.
Build a Geographic Marketing Opportunity Score
For a larger airport market with hundreds of ZIP codes, teams can formalize this analysis by creating a marketing opportunity score.
Useful factors include:
| Factor | Question |
|---|---|
| Total air demand | Is the market large enough to matter? |
| Airport share | How much room is there to grow? |
| Leakage volume | How many passenger trips use other airports? |
| Drive time | Is the local airport a practical choice? |
| Route relevance | Does the airport serve the destinations these travelers need? |
| Fare competitiveness | Is the local option reasonably competitive? |
| Demographics | Does the audience fit the campaign? |
| Growth | Is the market expanding? |
The score does not need to replace judgment. Its purpose is to help Marketing teams screen a large number of ZIP codes consistently and identify areas worth deeper analysis.
How Fligence Helps Identify Marketing Targets
FlightBI’s Fligence ZIP-OD helps airport Marketing teams evaluate passenger opportunity geographically rather than relying only on current airport passenger counts.
Teams can analyze:
- Resident passenger demand by ZIP code
- Airport market share and leakage
- Destination-specific demand
- Drive time
- Household income
- Premium passenger distribution
- Migration and market growth
- Visitor and second-home patterns
These dimensions can be combined to identify markets where the airport has both passenger demand and a realistic opportunity to gain share.
For a route-specific campaign, for example, an airport can identify the ZIP codes generating the most demand to that destination, determine how many passengers currently use competing airports, and focus advertising on areas where the local airport’s service is competitive.
A Practical Targeting Process
Airport Marketing teams can use a straightforward process:
- Find the demand. Identify ZIP codes or geographic clusters generating meaningful passenger traffic.
- Measure airport share. Determine how much of that demand the airport currently captures.
- Check addressability. Consider drive time, competing airports, fares, and available service.
- Identify the purpose. Separate core markets that need retention from growth markets where additional passengers can be won.
- Match routes and messages. Promote relevant services to travelers most likely to use them.
- Measure the result. Compare passenger volume and airport market share before and after the campaign.
This turns geographic marketing from broad advertising into a more focused passenger-acquisition strategy.
The Bottom Line
Airports should not automatically concentrate marketing where they already have the most passengers, nor should they simply target the ZIP codes with the highest leakage rates.
The better targets are usually communities with substantial passenger demand, meaningful room to increase airport share, reasonable airport accessibility, and air service that can realistically compete for those travelers.
By combining passenger demand, market share, leakage, drive time, destination patterns, and demographic characteristics, airports can identify where marketing has the best chance of changing passenger behavior.
The question becomes much more useful than “Where should we advertise?”
It becomes:
“Where are the travelers we have the best chance to win?”