
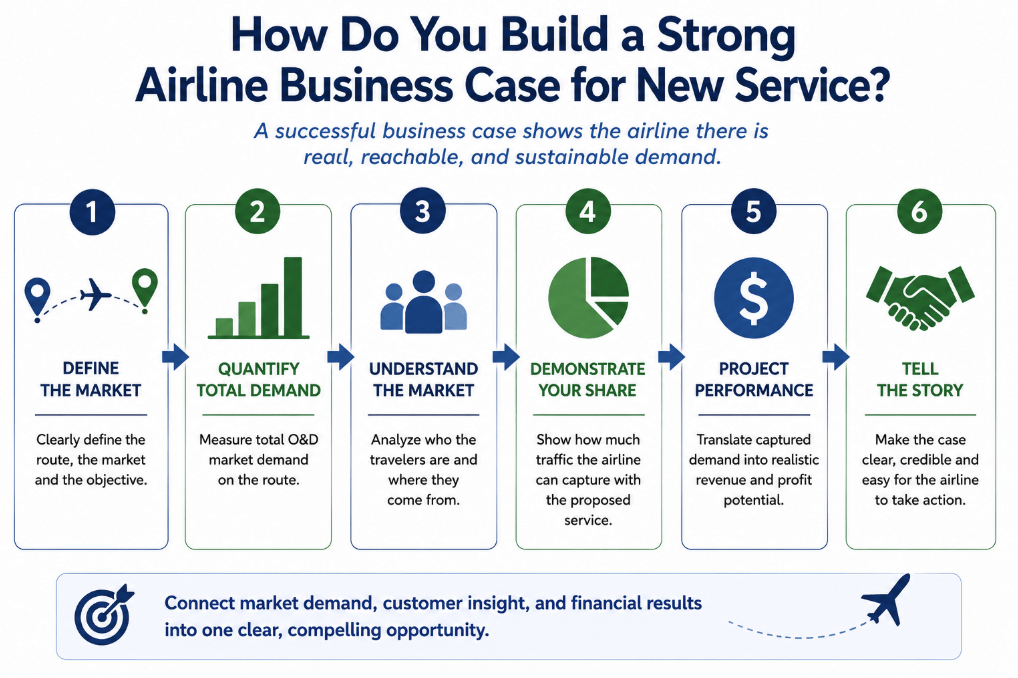
A strong airline business case does more than show that passengers want to travel to a destination. Airlines need evidence that a proposed route can attract enough passengers, fit their network, generate acceptable revenue, and perform under realistic schedule and aircraft assumptions.
For an airport Air Service Development team, a good proposal should answer five basic questions:
- How large is the market?
- How much of that demand is realistically addressable?
- Why would passengers use the proposed service?
- How does the route fit the airline’s network?
- What could the traffic, revenue, and profit impact look like?
The strongest proposals bring market demand, passenger geography, competitive conditions, airline fit, and route economics together into one clear story.
Start with the Airline’s Perspective
An airport may want a route because it would improve connectivity for the community, support economic development, or provide better service for local travelers. Those are benefits to the airport, but they can not justify an airline deploying an aircraft. The airline needs to understand what the route could contribute to its network.
Instead of building the proposal around “Our community needs this flight,” the airport should be able to say:
“Here is the demand, here is where the passengers live, here is how they travel today, and here is how the proposed service could perform within your network.”
That shifts the discussion from community need to a potential airline opportunity.
Establish the True Market Size
Begin with a clear picture of existing passenger demand. For example:
- Proposed route: Airport A–Nashville
- Total market demand: 82 PDEW
- Current local airport traffic: 14 PDEW
- Passengers using competing airports: 68 PDEW
- Current local nonstop service: None
Looking only at the airport’s existing 14 PDEW would substantially understate the market. The airline needs to understand the broader 82-PDEW opportunity and how those passengers currently travel.
This is especially important for regional airports with significant passenger leakage. The airport’s current O&D traffic represents what it captures today, not necessarily the full size of the market.
Show Where the Passengers Live
An 82-PDEW market becomes much more meaningful when the airline can see the geography behind it. Passenger-location analysis can show:
- Which ZIP codes generate the demand
- Where demand is concentrated
- How close passengers live to the local airport
- Which areas contribute the most traffic
- How those locations compare with competing airports
This helps answer an important question: How much of the market is actually addressable?
If most passengers live within 30 to 45 minutes of the local airport but currently drive 90 minutes to a competing airport, the opportunity may be compelling. If much of the demand originates near the competing airport, capturing it may be considerably harder.
A credible business case should make this distinction rather than treating every passenger in the broader market as equally likely to switch.
Explain Where the Leakage Is Going
Once the geographic market is established, show which airports currently capture the passengers.
For example:
| Airport Used | PDEW to Destination |
|---|---|
| Local airport | 14 |
| Competitor A | 38 |
| Competitor B | 20 |
| Other airports | 10 |
| Total | 82 |
The next question is not simply how many passengers are leaking. It is why they are choosing those airports.
The analysis should examine the competitive environment, including:
- Nonstop availability
- Frequency
- Airlines
- Schedules
- Fares
- Drive time
For example, knowing that Competitor A captures 38 PDEW becomes more useful when the airline also learns that Competitor A offers two daily nonstops while the local airport offers only connecting service.
Show the Fare Environment
Airfare affects both passenger choice and potential airline revenue. An airport can compare its current average fare to a destination with the weighted average fare available from competing airports.
A large fare difference may help explain why passengers leave the local market. On the other hand, strong fares already being paid by passengers at competing airports may indicate attractive revenue potential for a new local service.
The purpose of fare analysis is not to prove that the local airport will always be cheaper. It is to help the airline understand what passengers currently pay and how fare interacts with their airport choice.
Make the Business Case Airline-Specific
The same route can have very different value to different airlines. A proposal should therefore be built for the carrier being approached rather than presented as a generic route opportunity.
Important considerations include:
- Hub structure and network connectivity
- Existing presence at the airport
- Fleet and aircraft availability
- Frequency strategy
- Current customer base
- Passengers already using the airline
Suppose a substantial number of passengers from the airport’s catchment already drive to another airport to fly the target airline. That demonstrates that the airline already has customers in the local market.
However, this traffic should be presented carefully. If those passengers switch to the new local flight, some of the traffic may simply move from one station to another. The stronger opportunity comes from a combination of retaining existing airline customers, capturing passengers from competing airlines, and stimulating additional demand.
Show the Network Value
For a proposed hub route, local O&D demand may represent only part of the opportunity.
Suppose an airport is proposing new service to Dallas/Fort Worth. The business case should examine not only passengers traveling to Dallas, but also passengers who could connect through DFW to destinations such as:
- Phoenix
- Austin
- San Antonio
- Mexico
- Latin America
- Other domestic and international markets
A well-timed hub flight may create useful one-stop itineraries to dozens of destinations. That connecting traffic can be an important part of the route’s value.
The business case should therefore distinguish between local O&D passengers and connecting passengers rather than evaluating the route only on demand to the hub itself.
Propose a Specific Service, Not Just a Destination
“Please consider service to Nashville” gives an airline relatively little to evaluate. A stronger business case tests a specific service pattern, such as:
- One daily round trip
- 76-seat aircraft
- Morning departure
- Evening return
The airport can then compare that proposal with alternatives. For example:
| Scenario | Frequency | Aircraft |
|---|---|---|
| A | 1 daily | 76 seats |
| B | 2 daily | 76 seats each |
| C | 3 weekly | 150 seats |
Each configuration changes schedule utility, capacity, passenger capture, connecting opportunities, load factor, revenue, and operating cost.
A destination may be attractive while a particular service configuration is not. Finding the right combination of frequency, schedule, and aircraft is part of building the business case.
Forecast How Passengers Would Respond
Historical O&D demand establishes the market, but it does not tell the airline exactly what will happen after a new flight is introduced.
Passengers on the proposed service may come from several sources:
- Existing passengers connecting through the local airport
- Passengers captured from competing airports
- Passengers captured from competing airlines
- Passengers shifted from the airline’s existing itineraries
- New demand stimulated by the improved service
- Connecting passengers using the proposed flight
These sources have different implications for the airline. A passenger captured from another airline may represent incremental traffic. A passenger who simply moves from the same airline at a competing airport may involve some cannibalization. A passenger who begins traveling because the nonstop makes the trip practical represents stimulated demand. Showing these components separately makes the forecast much easier to understand and defend.
Use QSI to Model Passenger Choice
A Quality Service Index (QSI) model can estimate how passengers may redistribute after the proposed service is added.
QSI compares competing itineraries using factors such as:
- Nonstop versus connecting service
- Frequency
- Schedule
- Connection quality
- Aircraft
- Circuity
- Airline presence
The proposed flight is evaluated against the travel options passengers already have. This provides a more realistic estimate of market share than simply assuming, for example, that a new nonstop will capture 60% of existing demand.
A QSI-based scenario can also account for traffic diverted from existing itineraries and demand stimulated by the improved service.
Connect the Traffic Forecast to the Aircraft
Once passenger traffic has been forecast, it needs to be compared with the proposed capacity.
Suppose the forecast estimates 67 passengers per departure. On a 76-seat aircraft, that represents an estimated load factor of:
67 ÷ 76 = 88%
The same 67 passengers on a 150-seat aircraft would produce only a 45% load factor.
The destination and underlying market have not changed, but the route economics have changed substantially. This is why an airline business case should connect the demand forecast to a specific aircraft and frequency.
Move from Passenger Demand to Route Economics
Passenger volume alone does not determine whether a route is attractive. Two flights can carry the same number of passengers and produce very different financial results because of differences in fares, stage length, aircraft, and operating costs.
A route business case should therefore move beyond PDEW and estimate:
- Passenger traffic
- Average fare
- Passenger revenue
- Connecting revenue
- Aircraft operating cost
- Load factor
- Estimated profitability
This gets closer to the airline’s actual decision: What could this route contribute financially compared with other opportunities for the same aircraft?
Compare Alternative Scenarios
Airline route economics can change significantly when the schedule, frequency, or aircraft changes.
An airport might evaluate:
| Scenario | Frequency | Aircraft | Forecast LF | Revenue | Profit |
|---|---|---|---|---|---|
| A | 1 daily | 76 seats | 88% | Higher | Positive |
| B | 2 daily | 76 seats | 75% | Higher total | Positive |
| C | 1 daily | 150 seats | 48% | Lower efficiency | Weak |
These figures are illustrative, but the principle is important. The airport is not simply asking whether Nashville is a good market. It is asking which Nashville service, if any, produces the strongest result.
Scenario comparison also makes the business case more useful to the airline because it recognizes that aircraft and frequency decisions are part of route development.
Use Demand Stimulation Carefully
A new nonstop can expand the total market by making travel easier, but the proposal should not depend on an aggressive stimulation assumption.
Instead, show the components separately. For example:
- Existing market: 80 PDEW
- Existing demand captured from competing airports: 25 PDEW
- Additional stimulated demand: 15 PDEW
This is more transparent than simply stating that the new service will create a much larger market. The airline can see what demand already exists and what portion of the forecast depends on future passenger behavior.
Add Economic and Community Evidence That Supports the Route
Economic and demographic information can strengthen the proposal when it explains why this particular city pair should generate demand.
Useful evidence may include:
- Population growth and migration
- Major employers
- Corporate travel between the markets
- Universities
- Tourism activity
- Second-home ownership
- Industry concentrations
- Business relationships between the two regions
For business-oriented routes, direct evidence from employers and other organizations can also help. A corporate letter supporting a flight is useful, but evidence showing that the company’s employees already generate substantial travel between the markets is much stronger.
The goal is not to fill the presentation with demographic statistics. A few relevant data points that explain the market are more useful than dozens of charts that have little connection to the proposed route.
Keep the Airline Presentation Focused
Airline network planning teams evaluate many route opportunities. The airport should make its argument easy to understand without requiring the airline to work through a large amount of supporting material.
A practical presentation might include:
- Opportunity summary
- True market demand
- Passenger geography and addressability
- Competing airport and airline behavior
- Fare and existing service environment
- Proposed schedule and aircraft
- QSI passenger forecast
- Revenue and profit impact
- Relevant economic and community evidence
- Requested next step
Detailed supporting data can be available as backup, but the main presentation should keep the route opportunity clear.
Be Credible About What the Airport Can Capture
Overstating the opportunity can weaken an otherwise strong proposal.
If 100 PDEW currently use competing airports, the airport should not imply that all 100 passengers will switch. Some may live closer to another airport, prefer another airline, need a different schedule, or use the competing airport because of its broader network.
A stronger analysis identifies the addressable portion of the leakage and explains why those passengers are likely to respond to the proposed service.
This is where passenger geography, airport drive times, current airline usage, fares, schedules, and QSI analysis become particularly useful. Conservative assumptions that can be defended are generally more valuable than an aggressive forecast built to produce a large number.
Tailor the Story to the Airline
A proposal to Southwest should not look identical to a proposal to United, American, Delta, or a leisure-focused carrier.
For a network carrier, hub connectivity and connecting traffic may be central to the opportunity. For a leisure carrier, local O&D demand, fares, seasonality, and the ability to stimulate new traffic may carry more weight.
The underlying passenger market may be the same, but the business case should reflect how the target airline actually operates.
How Fligence Planning Supports an Airline Business Case
FlightBI’s Fligence products help airports establish the market behind a proposed route, including:
- True O&D demand
- Passenger geography
- Competing airport traffic
- PDEW
- Fare conditions
With Fligence Planning, an ASD team can then add a proposed flight to the schedule and use QSI-based scenario modeling to estimate how passenger behavior could change.
The model can account for:
- Demand stimulation
- Traffic captured from competing airports and airlines
- Traffic diverted from existing itineraries
- New connecting opportunities
The proposed service can then be evaluated for its potential impact on passenger traffic, market share, load factor, revenue, and profit.
This allows the airport to move beyond presenting historical market statistics and show the airline a forward-looking scenario for the proposed service.
The Bottom Line
A strong airline business case brings several pieces of evidence together. It shows that the market exists, identifies where the passengers live and how they travel today, explains why the proposed service could change their behavior, demonstrates how the route fits the airline’s network, and tests whether the resulting traffic can support the proposed aircraft and schedule.
Most importantly, it should remain realistic about which passengers are truly addressable and which traffic may simply shift from the airline’s existing services.
The final question an airport needs to help the airline answer is straightforward:
Why should the airline deploy this aircraft, on this schedule, in this market instead of using it somewhere else?