
A new nonstop flight can generate more passenger demand than existed before the service was introduced. This additional traffic is called passenger stimulation.
Stimulation occurs because a nonstop changes the attractiveness of a trip. Travelers may make trips they previously avoided, travel more frequently, or choose flying instead of another mode of transportation because the journey has become easier.
For an airport Air Service Development team, historical O&D demand is an important starting point, but it should not always be treated as the maximum potential market. The more useful question is: How much larger could the market become if a convenient nonstop option were introduced?
There is no standard stimulation percentage that works for every route. The result depends on the destination, existing service, fares, schedule, passenger mix, competing airports, and how much the proposed nonstop improves the travel experience.
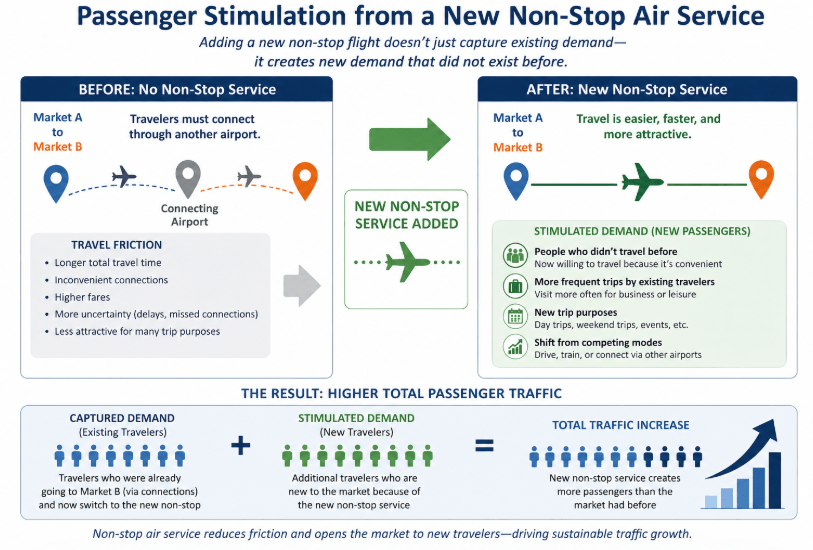
What Is Passenger Stimulation?
Passenger stimulation is the increase in total market demand that occurs after air service improves.
Suppose a market currently generates 60 PDEW with no nonstop service. After a new nonstop begins, total demand increases to 78 PDEW.
The stimulated demand is:
78 PDEW − 60 PDEW = 18 PDEW
The stimulation rate is:
18 ÷ 60 = 30%
The important point is that these additional 18 PDEW represent growth in the total market. They are different from passengers who were already traveling but simply changed which airport or flight they used.
Passenger Capture Is Not the Same as Stimulation
This distinction is important when evaluating a proposed route.
Suppose an airport’s broader market already generates 80 PDEW, but only 15 PDEW currently use the local airport while 65 PDEW use competing airports.
If a new nonstop causes 25 PDEW to switch from competing airports to the local airport, the airport has captured those passengers. The regional market remains 80 PDEW.
If the convenience of the new service also causes total market demand to increase from 80 to 95 PDEW, the additional 15 PDEW represent stimulated demand.
A new route can therefore draw traffic from several sources:
- Existing passengers already using the local airport
- Passengers captured from competing airports
- Newly stimulated demand
- Connecting passengers, when the flight serves an airline hub
These components should be evaluated separately rather than treating every passenger on the proposed flight as new demand.
Why Does a New Nonstop Stimulate Demand?
A nonstop can materially change the amount of time and effort required to make a trip. Before the route begins, a traveler may have to drive 90 minutes to another airport or take a connecting itinerary from the local airport. A local nonstop removes some of that inconvenience.
Better service can change travel behavior in several ways. Passengers may:
- Take trips they previously postponed or avoided
- Travel more frequently
- Take shorter trips because less travel time is required
- Visit friends and relatives more often
- Make additional business trips
- Take weekend trips that were previously impractical
- Shift from driving to flying
For this reason, historical passenger demand does not necessarily represent the ceiling for a new nonstop market.
The Size of the Service Improvement Matters
The amount of stimulation often depends on how much the new flight improves the travel experience.
Consider two markets:
| Market A | Market B | |
|---|---|---|
| Current option | One-stop itinerary | Nonstop from nearby airport |
| Current travel time | 6 hours | 2-hour flight plus airport drive |
| New option | 2-hour local nonstop | 2-hour local nonstop |
Both new flights may attract passengers, but the effects are different.
For Market A, the new nonstop transforms a six-hour connecting journey into a two-hour flight. That major improvement could generate meaningful new travel.
For Market B, passengers already have a convenient nonstop option, although they must drive to another airport to use it. The local nonstop may primarily shift existing passengers between airports rather than generate as much new travel.
This distinction matters when estimating stimulation.
Fare Matters Too
Convenience alone does not determine passenger behavior. A new nonstop that saves three hours but charges a large fare premium may generate less stimulation than expected.
A route that combines nonstop convenience with competitive fares is more likely to change passenger behavior. Fare should therefore be considered alongside travel time, schedule, frequency, and airport accessibility rather than applying the same stimulation factor to every new route.
Short-Haul and Long-Haul Markets Behave Differently
The alternatives available to passengers also depend on trip distance. On shorter routes, a new flight may compete with:
- Driving
- Rail
- Bus
- Flights from competing airports
For longer routes, the main comparison may be between a nonstop and a connecting itinerary.
Reducing a seven-hour connecting journey to a three-hour nonstop can fundamentally change the attractiveness of a trip. On a shorter route, however, travelers may still choose to drive if the total door-to-door travel time and cost are competitive.
The source of stimulation therefore depends partly on what passengers were doing before the flight existed.
Leisure Markets Can Generate Strong Stimulation
Leisure passengers often have flexibility over whether, when, and where they travel. A destination that requires two flights, a connection, and most of a day in transit may not be attractive for a short vacation. A three-hour nonstop can change that calculation.
Improved service may stimulate:
- Weekend trips
- Short vacations
- Family travel
- Seasonal trips
- Repeat visits
Competitive fares can strengthen this effect. This helps explain why leisure-focused airlines can sometimes develop successful routes even when historical O&D demand initially appears modest.
Business Markets Stimulate for Different Reasons
For business travelers, the value of a nonstop may come from time savings and schedule utility rather than simply making the destination accessible.
A new route can create additional business demand when it provides:
- Shorter total travel time
- Same-day travel
- Better departure and arrival times
- More predictable travel
- Fewer missed-connection risks
For example, a connecting itinerary may require a traveler to arrive the night before a meeting. An early-morning nonstop with an evening return could make a same-day business trip possible. That can create trips that were impractical under the previous schedule.
VFR and Community-Based Markets Can Also Respond
Visiting-friends-and-relatives markets can respond strongly when two regions have significant family, cultural, or community ties. Making the journey easier can lead to more frequent visits, additional holiday travel, and trips by passengers who previously avoided inconvenient connections.
This can be particularly important for international markets and markets with concentrated ethnic or immigrant communities. In these cases, understanding where relevant passenger communities live can add useful context to the historical O&D numbers.
Tourism Development Can Add to the Effect
Sometimes the flight itself is only one part of the change. A new route may coincide with destination marketing, new hotels, convention activity, attractions, or broader tourism development.
If destination awareness and air access improve at the same time, demand can grow beyond what historical O&D patterns would suggest. Tourism-oriented airports should also consider both sides of the market because stimulation may include local residents traveling outbound and new visitors traveling inbound.
Why a Fixed Stimulation Percentage Can Be Misleading
It may be tempting to apply a standard 10%, 20%, or 30% stimulation factor to every proposed nonstop. Markets are too different for that approach to be reliable.
Consider two potential routes:
| Route A | Route B |
| No existing nonstop Long connecting itinerary High current fares Strong underlying O&D demand | Several nonstop alternatives at nearby airports Short drive to the competing airport Competitive existing fares Little improvement in total travel time |
Applying the same 25% stimulation assumption to both routes would ignore major differences in passenger behavior. Route A changes the travel experience substantially, while Route B may mostly redistribute existing passengers.
Stimulation assumptions should therefore reflect the specific improvement created by the proposed service.
Start with a Reliable Base Market
Before estimating stimulation, the airport needs a credible estimate of existing O&D demand. That base market should account for passengers currently using the local airport as well as relevant passengers using competing airports.
Suppose the true market is estimated at 70 PDEW. Scenario analysis can then estimate how that 70-PDEW market might change after the new flight is introduced.
If the base market is understated, applying even a sophisticated stimulation assumption to it will still produce a misleading forecast.
Use Multiple Stimulation Scenarios
Because stimulation is uncertain, it can be useful to test several assumptions rather than relying on one forecast.
| Scenario | Base Demand | Stimulation | Future Market |
|---|---|---|---|
| Conservative | 70 PDEW | 10% | 77 PDEW |
| Base | 70 PDEW | 20% | 84 PDEW |
| High | 70 PDEW | 35% | 94.5 PDEW |
The purpose is not simply to produce three forecasts. It is to determine how dependent the route is on stimulation.
If a proposed route performs well under the conservative case, the opportunity may be relatively robust. If it works only when demand increases by 35%, the airline and airport should understand that risk.
Frequency and Schedule Affect Stimulation
A twice-weekly nonstop does not change a market in the same way as daily or twice-daily service. Frequency determines how useful the route is to different types of passengers.
For example:
- Two weekly flights may work for flexible leisure travelers.
- Daily service provides much greater flexibility.
- Twice-daily service may make the route more useful for business travelers and connecting passengers.
Departure times matter as well. A morning outbound and evening return may support same-day business travel, while a late-afternoon outbound may not.
Stimulation should therefore be tied to the actual proposed schedule, not just the existence of a nonstop flight.
Capacity Can Limit the Traffic Actually Captured
Potential demand and passengers carried are not always the same.
Suppose a market could grow to 95 PDEW after a new nonstop is introduced, but the proposed flight provides only 76 seats each way per day. The flight cannot carry the entire potential market, particularly after accounting for connecting passengers and normal load-factor constraints.
A route forecast should therefore distinguish between:
- Potential total market demand
- Stimulated demand
- Demand attracted to the proposed service
- Available seats
- Passengers the flight can realistically carry
This becomes particularly important when a proposed route is expected to operate at high load factors.
Hub Flights Can Add Connecting Traffic
A proposed flight to an airline hub can generate traffic beyond the local O&D market.
For example, a new flight to Dallas/Fort Worth may carry local DFW passengers as well as travelers connecting to Phoenix, Austin, San Antonio, Mexico, Latin America, and other destinations.
This network traffic should not be confused with stimulation of the local DFW market. A route forecast should distinguish among:
- Local O&D demand
- Passenger leakage captured from competing airports
- Stimulated local demand
- Connecting traffic
Together, these components determine the potential traffic on the proposed flight.
Model the Service, Not Just a Stimulation Percentage
A more complete route analysis considers what actually changes when the proposed flight is added. The new service changes the set of itineraries available to passengers, including nonstop availability, frequency, connection times, schedule quality, and network connectivity.
Passenger behavior can then be modeled against those new choices. This provides a better foundation for estimating market share and passenger capture than simply multiplying historical O&D demand by a fixed stimulation percentage.
How Fligence Planning Evaluates a New Nonstop
FlightBI’s Fligence Planning allows airport Air Service Development teams to build proposed flight scenarios and evaluate how a new schedule could affect passenger behavior and airline economics.
Airport teams can add a proposed flight and use QSI-based network analysis to evaluate changes in factors such as:
- Nonstop availability
- Frequency
- Connections
- Aircraft
- Passenger capture
- Market share
The resulting scenario can then be evaluated using passenger traffic, load factor, revenue, and profitability.
Instead of asking “Should we assume 20% stimulation?”, the airport can evaluate how a specific proposed service changes the choices available to passengers and how those changes could affect the route.
Compare Different Service Scenarios
This becomes especially useful when several service patterns are possible. An airport might compare:
| Frequency | Aircraft | |
|---|---|---|
| Scenario 1 | 3 weekly flights | 150 seats |
| Scenario 2 | Daily | 76 seats |
| Scenario 3 | Daily | 150 seats |
Each scenario can produce different levels of passenger capture, stimulation, connecting traffic, load factor, revenue, and profitability.
The best option is not necessarily the one with the most seats. A smaller aircraft with higher frequency, for example, may provide greater schedule utility and produce better network economics in some markets.
Validate Stimulation After the Route Starts
Once service begins, airports can compare the forecast with actual passenger behavior. Useful measures include:
- Pre-launch versus post-launch total market demand
- Changes in competing-airport usage
- Local airport passenger growth
- Destination-specific PDEW
- Changes in airport and airline market share
This helps separate passengers who simply changed airports from true growth in the overall market. Over time, these observations can also improve stimulation assumptions used for future route studies.
The Bottom Line
There is no universal answer to how much passenger demand a new nonstop can stimulate. The result depends on how much the proposed service improves the passenger’s existing travel options.
Stimulation is more likely to be meaningful when a new nonstop provides a major reduction in travel time, competitive fares, useful frequency and schedules, or a convenient alternative to a long drive or connecting itinerary. The characteristics of the market, including business, leisure, visitor, and VFR demand, also matter.
Most importantly, airport teams should keep base O&D demand, captured leakage, stimulated demand, and connecting traffic separate. They represent different sources of passengers and have different implications for an airline evaluating a new route.
With Fligence Planning, ASD teams can test proposed schedules using QSI-based scenario analysis and evaluate the resulting passenger traffic, market share, load factor, revenue, and profitability. The goal is not to find a standard stimulation percentage. It is to determine how much additional demand a specific service could reasonably create in a specific market.