
Estimating true origin-and-destination (O&D) passenger demand means determining how many passengers actually want to travel between a local market and a destination, regardless of which airport they currently use or whether they connect along the way.
For Air Service Development teams, this is one of the most important measurements in route planning. Airport traffic alone may understate the size of a market because some local travelers connect through a hub or use different airports within the region.
The objective is to answer a broader question: How many passengers in our market are actually traveling between this region and this destination?
What Is Origin-and-Destination Passenger Demand?
Origin-and-destination demand represents the passenger’s true starting point and final destination, rather than every airport used along the way.
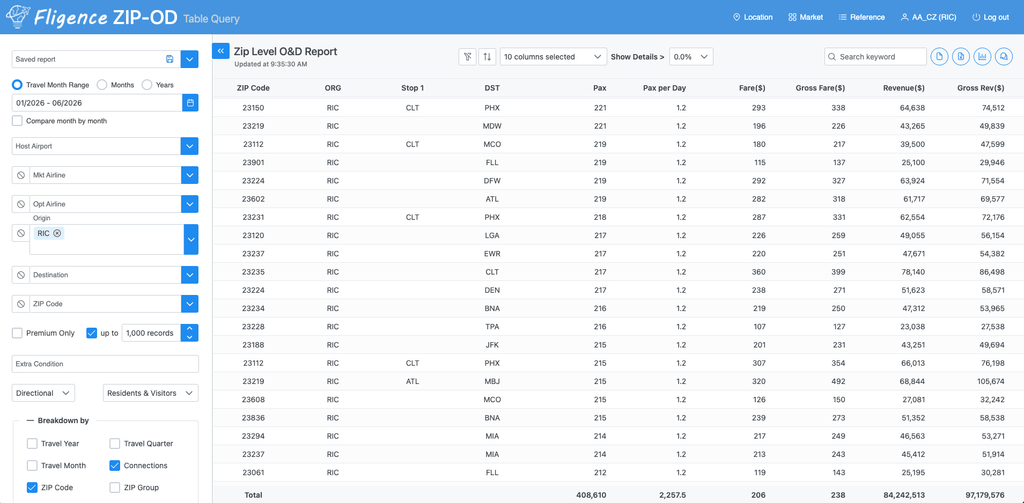
For example, consider a passenger traveling:
Richmond (RIC) → Charlotte (CLT) → Phoenix (PHX)
The itinerary contains two flight segments, RIC – CLT and CLT – PHX. But the passenger’s true O&D market is Richmond – Phoenix.
For air service development, Richmond – Phoenix demand is usually more important than the individual segments because it represents the passenger’s actual travel need. This distinction becomes especially important when an airport is evaluating whether a nonstop flight could be supported.
Segment Traffic Is Not the Same as O&D Demand
Segment traffic tells an airport how many passengers flew on a particular flight. O&D data tells the airport where those passengers actually started and ended their journeys.
Suppose a flight from Salt Lake City to Chicago carries 100 passengers. Those passengers could include:
- 40 ending their trips in Chicago
- 25 connecting to New York
- 15 connecting to Boston
- 10 connecting internationally
- 10 connecting to other destinations
The flight carries 100 passengers, but only 40 belong to the Salt Lake City – Chicago local O&D market. Using all 100 passengers as Chicago demand would significantly overstate the market.
Start with Airline O&D Data
In the United States, one of the primary sources for estimating O&D demand is U.S. Department of Transportation airline passenger O&D data. These datasets provide information such as:
- Travel month
- Origin and destination airports
- Connecting airports
- Airlines
- Fares
- Purchase window
- Dwell time
However, O&D datasets are based on samples rather than complete passenger records. The observed records therefore need to be expanded and calibrated before they can represent total market demand.
Why Raw O&D Data Needs Calibration
The U.S. DOT airline passenger O&D dataset has evolved from DB1A to DB1B and, most recently, DB1C. Before July 2025, the dataset was known as DB1B and included tickets whose ticket numbers ended in 0 from reporting airlines. Beginning in July 2025, DB1C expanded the sample to tickets ending in 0, 2, 7, and 9, increasing the overall sample to approximately 40% of tickets issued by reporting airlines.
However, the sampling rate for an individual market and time period can be significantly higher or lower than 40%, particularly in small markets. For example, suppose a market has only three tickets with ticket numbers ending in 0, 1, and 2. DB1C would capture two of those three tickets, resulting in a sample rate of about 67%. In another small market with four tickets ending in 2, 3, 4, 5 and 6, the sample could be only 20%. For this reason, the overall 40% sampling rate should not be applied mechanically to every market.
The fact that sampling occurs at the ticket level can also create issues when estimating traffic by month. This is particularly important around holidays and other periods when trips cross calendar months. For example, many passengers may purchase round-trip tickets for Christmas travel with the outbound coupon in December and the return coupon in January. If the entire ticket is assigned to December based on its first coupon, December traffic may be overstated while January traffic is understated. Traffic estimates should therefore account for the actual travel dates of individual coupons rather than simply assigning the complete ticket to one month.
International markets introduce another limitation. DOT O&D data includes U.S. reporting carriers and certain foreign carriers, including carriers with antitrust immunity relationships, such as Air Canada, British Airways, and Japan Airlines. However, it does not include every foreign carrier operating in the U.S. market. As a result, raw DOT O&D data can understate passenger demand in international markets where non-reporting foreign airlines carry a meaningful share of traffic.
For these reasons, raw O&D sample data should not be treated as complete market demand or expanded using a single fixed factor. A better approach is to use the detailed O&D records to understand passenger itineraries and market patterns, then calibrate those patterns against broader passenger traffic totals.
Combine O&D Data with Total Traffic Data
Different aviation datasets answer different parts of the demand question. O&D data provides information about who is traveling where, while other traffic datasets help establish how many passengers actually traveled.
In the United States, useful inputs can include:
- O&D ticket data
- T-100 traffic data
- Airport throughput data
Rather than relying on one source, a calibrated methodology uses these datasets together so that detailed itinerary patterns remain consistent with broader traffic totals.
Expand Beyond the Airport’s Existing Passengers
One of the biggest mistakes in route analysis is assuming that an airport’s current passengers represent its entire local market.
Suppose Airport A currently carries 25 PDEW to Nashville. Based only on airport O&D data, Nashville may appear to be a relatively small market. However, passenger-location analysis identifies another 55 PDEW from nearby communities traveling to Nashville through competing airports. The broader market therefore generates approximately 80 PDEW.
For airports with significant passenger leakage, this distinction can materially change the route opportunity. Airport-level O&D shows what the airport captures today. Catchment-level O&D provides a better picture of how much demand actually exists in the surrounding market.
Define the Geographic Market Correctly
Estimating true O&D demand also requires deciding whose demand should be included. A county boundary may exclude important passengers, while a large fixed radius may include communities that are naturally oriented toward another airport.
Passenger-location and catchment analysis provide a more detailed approach. For each ZIP code, an airport can examine:
- Total air travel demand
- Destination-specific demand
- Airport currently used
- Drive time to the local and competing airports
This makes it possible to build the market from actual passenger geography rather than assuming everyone within an arbitrary radius belongs equally to the airport.
Measure Destination Demand at the ZIP-Code Level
Consider an airport evaluating Nashville service. Passenger demand across five ZIP codes might look like this:
| ZIP Code | Total Nashville PDEW | Local Airport | Competing Airports |
|---|---|---|---|
| ZIP A | 12 | 6 | 6 |
| ZIP B | 18 | 4 | 14 |
| ZIP C | 20 | 5 | 15 |
| ZIP D | 10 | 2 | 8 |
| ZIP E | 15 | 3 | 12 |
| Total | 75 | 20 | 55 |
Looking only at the local airport suggests a 20-PDEW market. Looking at passenger demand across the surrounding ZIP codes shows a 75-PDEW regional market.
The difference is important. The 75 PDEW provides a much better starting point for evaluating the potential route, although the airport still needs to determine how much of that demand it could realistically capture.
Separate Residents from Visitors
Passenger geography means different things for residents and visitors. For a resident, the relevant location is where the traveler lives. For a visitor, it may be where the traveler stays or spends time after arriving.
This distinction can be particularly important for tourism-oriented airports. A complete analysis may need to consider:
- Resident-origin demand
- Visitor-origin demand
- Seasonal residents
- Second-home owners
A destination airport with a modest permanent population may have substantially more air travel demand once visitor and seasonal travel are included.
Avoid Double Counting Connecting Passengers
Connecting passengers must be handled carefully when calculating O&D demand. Consider this itinerary:
Airport A → Hub B → Destination C
This represents one O&D passenger traveling from Airport A to Destination C. The passenger should not be counted once in the A–B market and again in the B–C market when estimating A–C demand.
Reconstructing the complete itinerary is particularly important for airports whose passengers frequently connect through major airline hubs.
Use a Consistent Measure of Demand
Passenger demand is often expressed as PDEW, or Passengers Daily Each Way, because it makes market size easier to compare with proposed airline capacity.
For example:
36,500 annual directional passengers ≈ 100 PDEW
Analysts should be clear about whether a dataset represents one-way passengers, round-trip passengers, or directional demand. Mixing these definitions can create large errors when comparing market demand with aircraft capacity or proposed frequency.
Account for Seasonality
Annual averages can hide major differences during the year. A destination might average 60 PDEW annually, for example, while ranging from 35 PDEW in September to 95 PDEW in March.
For route planning, it can be useful to analyze demand by month and by season.
A market that does not support daily year-round service may still support seasonal or less-than-daily service during periods of stronger demand.
Account for Incomplete Data
No aviation dataset captures every passenger perfectly. Some markets have limited sample sizes, incomplete carrier reporting, international data gaps, charter traffic, low passenger volumes, or new airlines without much historical data.
These markets may require additional calibration or supplemental information. It is also useful to distinguish between directly observed demand and modeled or estimated demand rather than presenting every estimate as equally precise.
Historical Demand Is Not the Same as Future Demand
True O&D demand describes the market under existing or historical service conditions. It does not necessarily tell an airport how large the market would become after a new nonstop flight is introduced.
Suppose a market currently generates 70 PDEW without nonstop service. After a nonstop is introduced:
- Passengers may switch from competing airports.
- Local passengers who previously connected may choose the nonstop.
- Existing travelers may make more trips.
- New passengers may travel because the trip has become easier.
The additional traffic created by improved service is generally referred to as demand stimulation. Route planning should therefore distinguish between base O&D demand and potential demand after the proposed service is introduced.
Measure True Demand Before Forecasting a New Route
A useful ASD workflow separates two related but different questions.
1. How large is the market today?
Estimate true O&D demand using aviation O&D data, traffic calibration, passenger geography, and competing-airport usage.
2. What could happen if new service is introduced?
Use route scenario modeling to estimate:
- Passenger capture
- Traffic redistribution
- Demand stimulation
- Load factor
- Revenue
- Profitability
The first calculation establishes the base market. The second estimates how passenger behavior could change under the proposed service.
Why Airport-Level O&D Can Understate Regional Demand
This issue is especially important for regional airports located near larger airports.
Suppose Airport A reports only 18 PDEW to Austin, while residents throughout its broader market generate 72 PDEW to Austin. Much of the difference may consist of passengers driving to competing airports.
From an airline’s perspective, the market is not necessarily limited to 18 PDEW. The broader regional market may be 72 PDEW, although only part of that traffic will be realistically addressable by Airport A.
Understanding that difference can change which destinations rise to the top of an airport’s new-service opportunity list.
How Fligence Estimates Market Demand
FlightBI’s Fligence ZIP-OD platform combines aviation passenger data with geographic passenger-location information to help airports measure demand beyond the passengers currently using their airport.
Air Service Development teams can examine:
- Airport-level O&D demand
- Catchment-level O&D demand
- ZIP-level passenger origins
- Passengers using competing airports
- Destination-specific PDEW
This helps distinguish between the traffic an airport captures today and the larger passenger market available within its surrounding region.
From True O&D Demand to Route Opportunity
Once the broader market has been measured, an ASD team can move beyond the basic passenger count. The next analysis should consider:
- How much demand does the local airport already capture?
- Where do the remaining passengers live?
- Which competing airports do they use?
- Which airlines carry them?
- How seasonal is the market?
- How much of the leakage is realistically addressable?
- Could a new nonstop stimulate additional demand?
These questions turn an O&D estimate into something much more useful for airline discussions.
A Practical Framework
A practical process for estimating true O&D demand is:
- Identify true passenger itineraries. Separate O&D trips from flight tickets.
- Expand and calibrate aviation data. Reconcile detailed itinerary information with broader passenger totals.
- Define the geographic market. Identify the ZIP codes and communities that contribute meaningful demand.
- Include passengers using competing airports. Measure regional demand rather than only passengers already using the local airport.
- Calculate destination demand. Estimate passenger volumes and PDEW for each market.
- Segment the market where useful. Examine resident, visitor, domestic, international, premium, or seasonal demand separately.
- Validate the estimates. Compare results with multiple aviation and passenger data sources.
- Use the result as the base market. Apply scenario modeling separately to estimate what could happen after new service is introduced.
The Bottom Line
True O&D passenger demand measures how many travelers in an airport’s broader market actually want to travel between that region and a destination, regardless of which airport or connecting itinerary they currently use.
The strongest estimates combine O&D itinerary data, total traffic calibration, geographic passenger demand, and competing-airport usage rather than relying only on the passengers already using the airport.
An airport may carry only 20 PDEW to a destination today while its broader market generates 70 or 80 PDEW. Understanding that difference gives Air Service Development teams a stronger foundation for identifying new nonstop opportunities and determining which markets deserve deeper route analysis.