Daily and hourly airport traffic is crucial for businesses related to airports, including airport authorities, airlines, retailers, ground handlers, rental car companies, and hotels. If you belong to any of these industries, utilizing daily airport traffic data can help you plan your operations, schedule your resources, forecast revenue, and plan budgets more accurately. Additionally, this data can help you target your marketing and promotional efforts more specifically, leading to more effective business strategies.
FlightBI collects and normalizes the airport passenger throughput data from US Transportation Security Administration (TSA). In addition, it has developed a product called Fligence TSA, which features a wide variety of data visualizations. FlightBI is currently offering a two-week, no-obligation trial of Fligence TSA for you to explore valuable insights from the airport traffic data.
This article summarizes US air traffic using the aforementioned tool, utilizing actual airport-level data as of Nov. 4th, 2023. Our analysis will examine trends in different segments of air travel, such as domestic versus international flights and leisure versus business travel. To learn more about the specific airports chosen to represent these markets, please refer to this article.
US Overall Airport Traffic Status
Figure 1 depicts how U.S. air traffic exceeded pre-pandemic 2019 levels approximately around Labor Day this year and has consistently maintained this position above the benchmark. This suggests a strong possibility of sustained growth, surpassing 2019 levels for the remainder of the year.
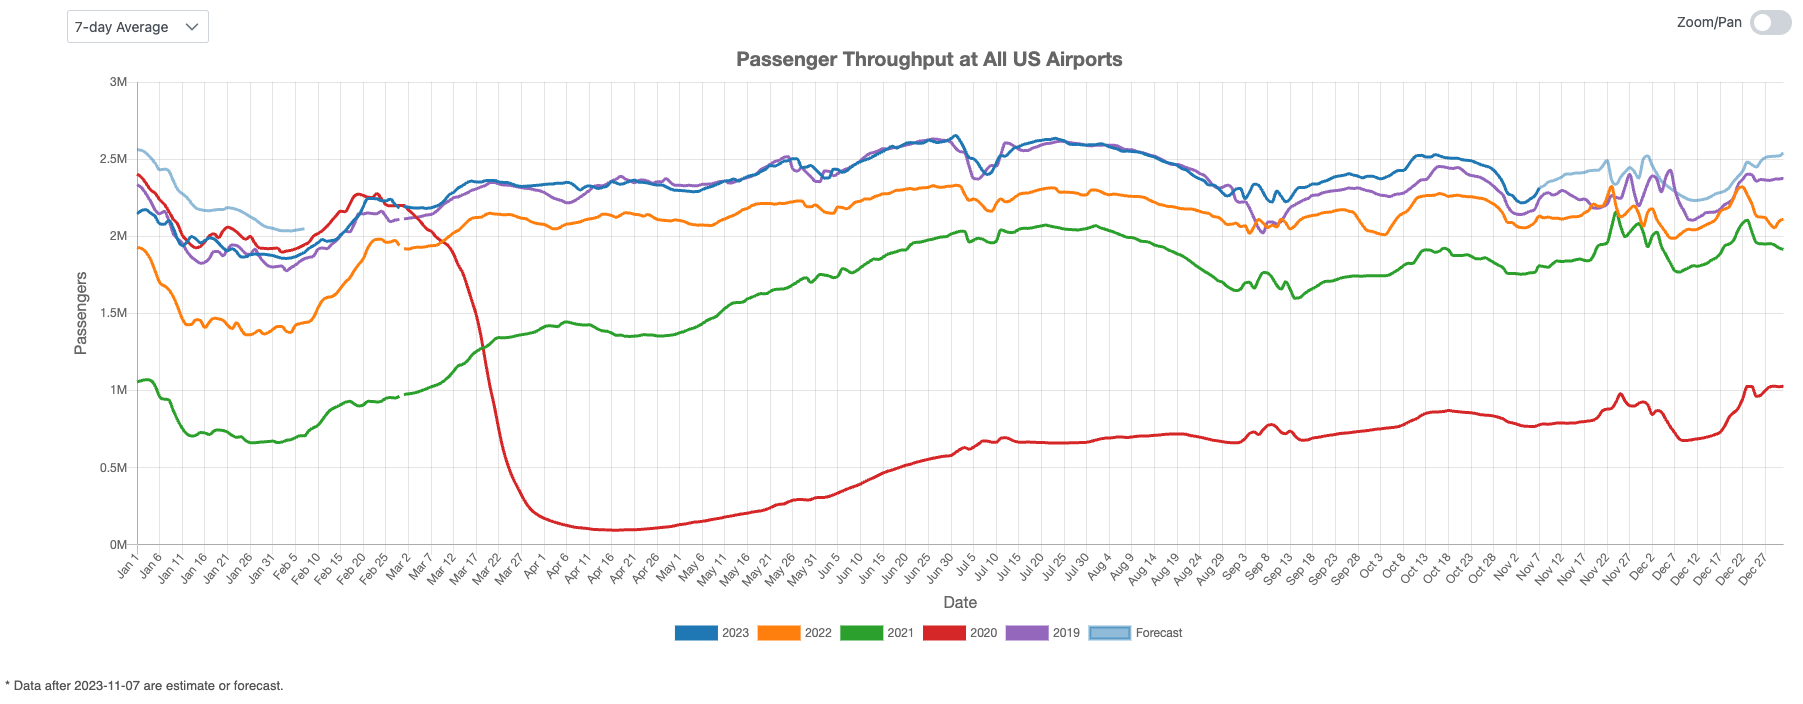
Figure 1: US Overall Air Traffic Trend
Domestic Airport Traffic Indicator
Figure 2 underscores the trend in domestic U.S. air traffic. In October 2023, domestic traffic surpassed the 2019 levels by over 10%. We project robust growth in November, with an expected continuation of 5% to 10% above the highest historical levels on record.
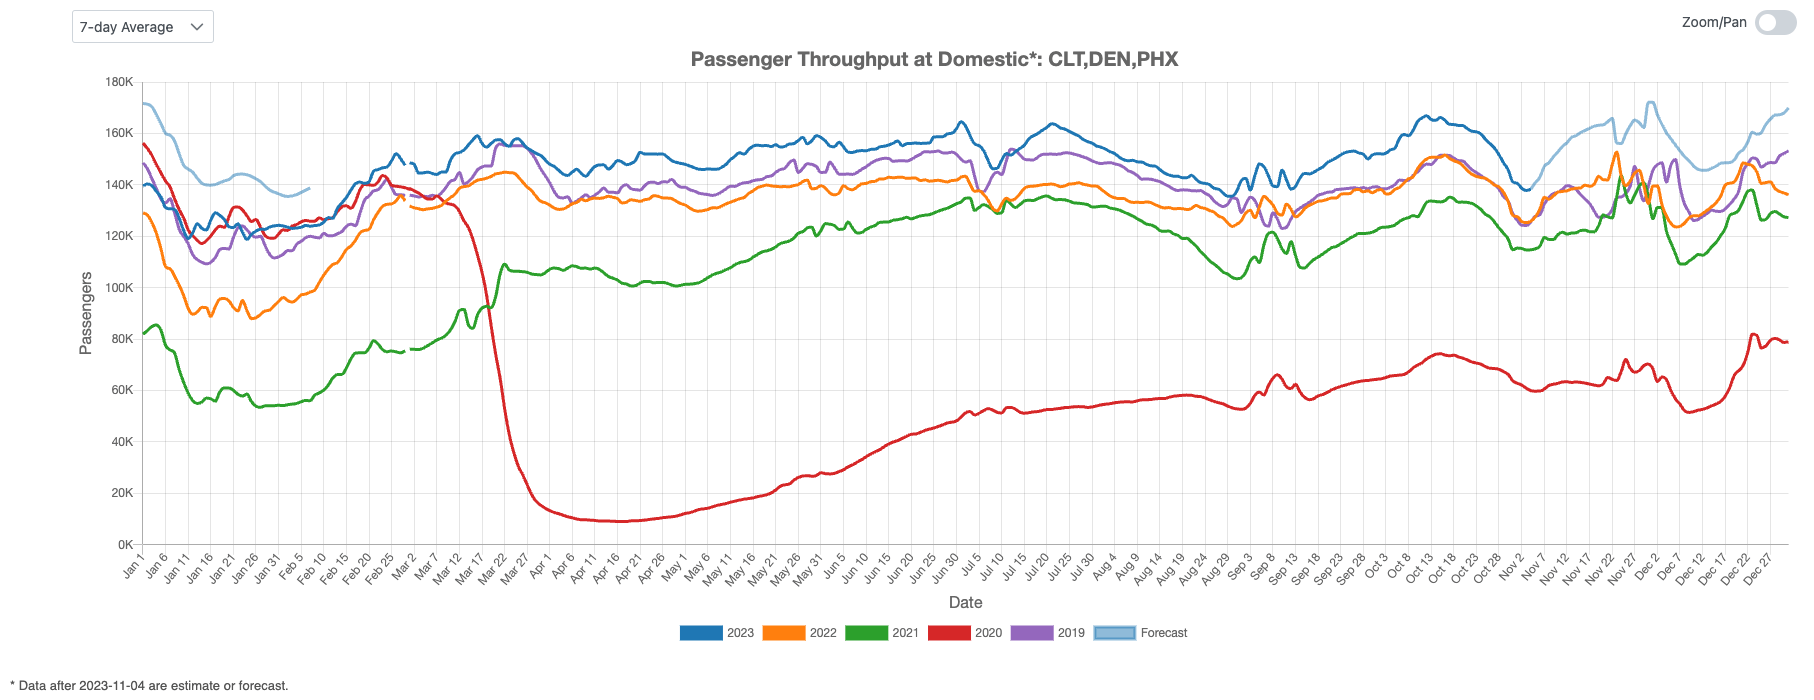
Figure 2: US Domestic Air Traffic Indicator
International Airport Traffic Indicator
Figure 3 illustrates the index of international air traffic in the U.S., with the 2023 curve positioned between the 2022 and 2019 curves. We anticipate that, in the coming months, international traffic will continue its trajectory to not only recover but also surpass pre-COVID-19 levels.
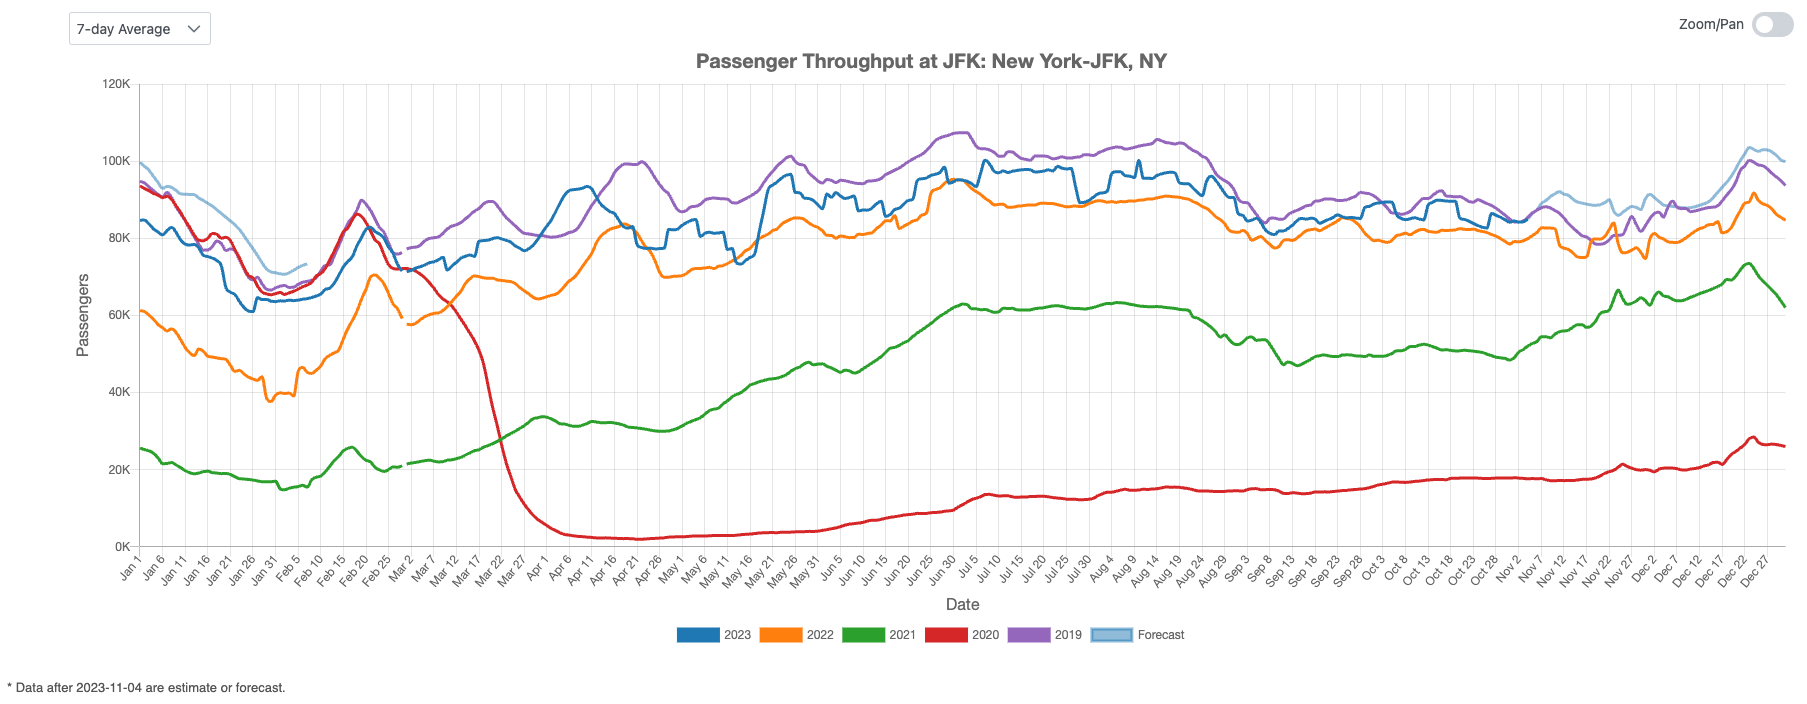
Figure 3: US International Air Traffic Indicator
Leisure Air Traffic Indicator
Leisure air travel experienced a resurgence in early October, followed by a dip towards the end of the month. As we examine the upcoming airline schedules, we expect to witness another upswing in November, underscoring the enduring strength of the leisure air travel industry.
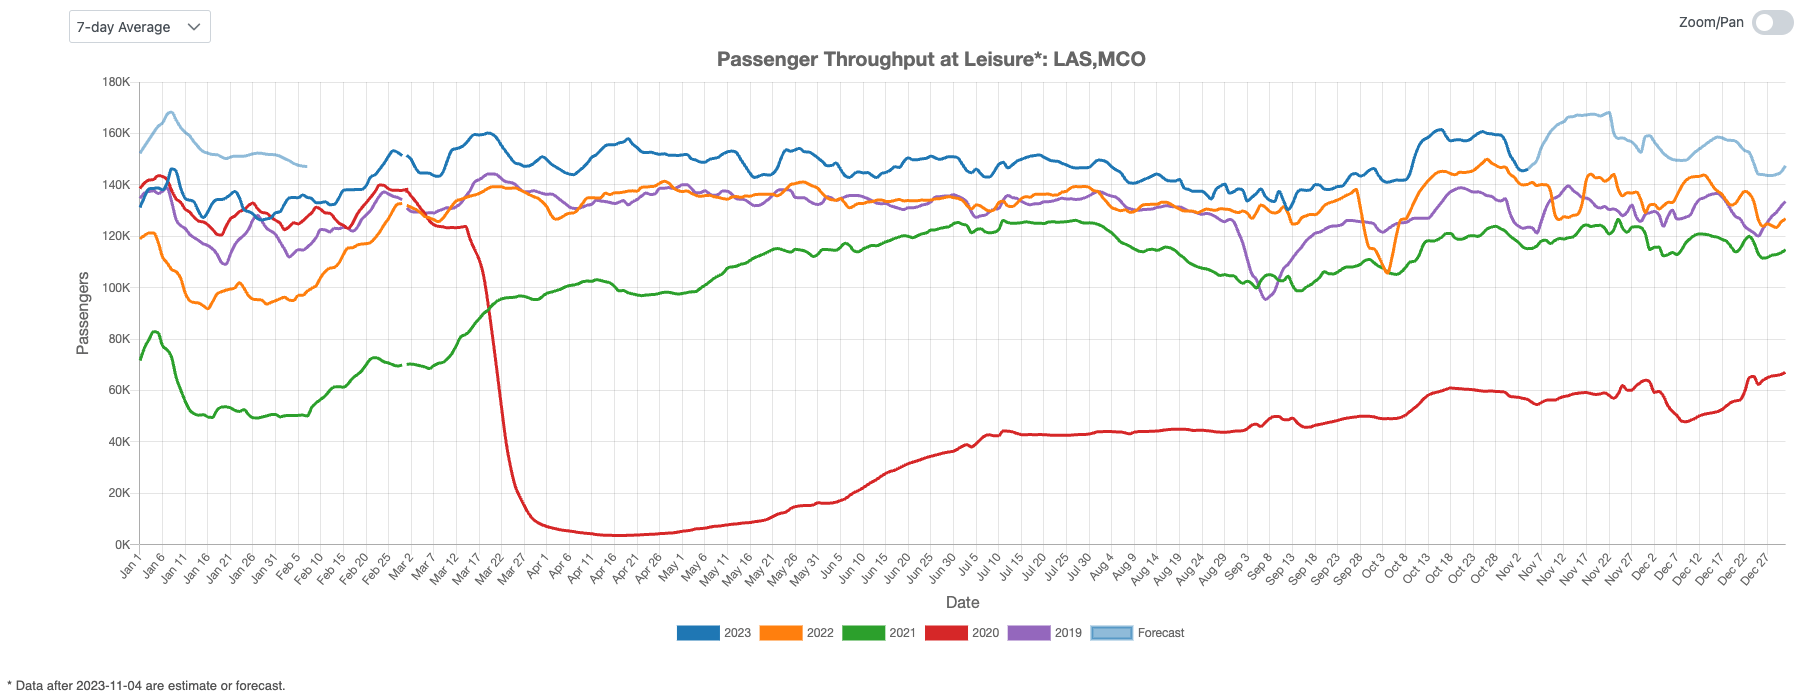
Figure 4: US Leisure Air Traffic Indicator
Business Air Traffic Indicator
Shifting our focus to business-related air travel, Figure 5 highlights a decline in business travel towards the end of October. Nonetheless, our projection anticipates a resurgence in mid-November, with business travel expected to maintain at pre-pandemic levels for the remainder of the year.
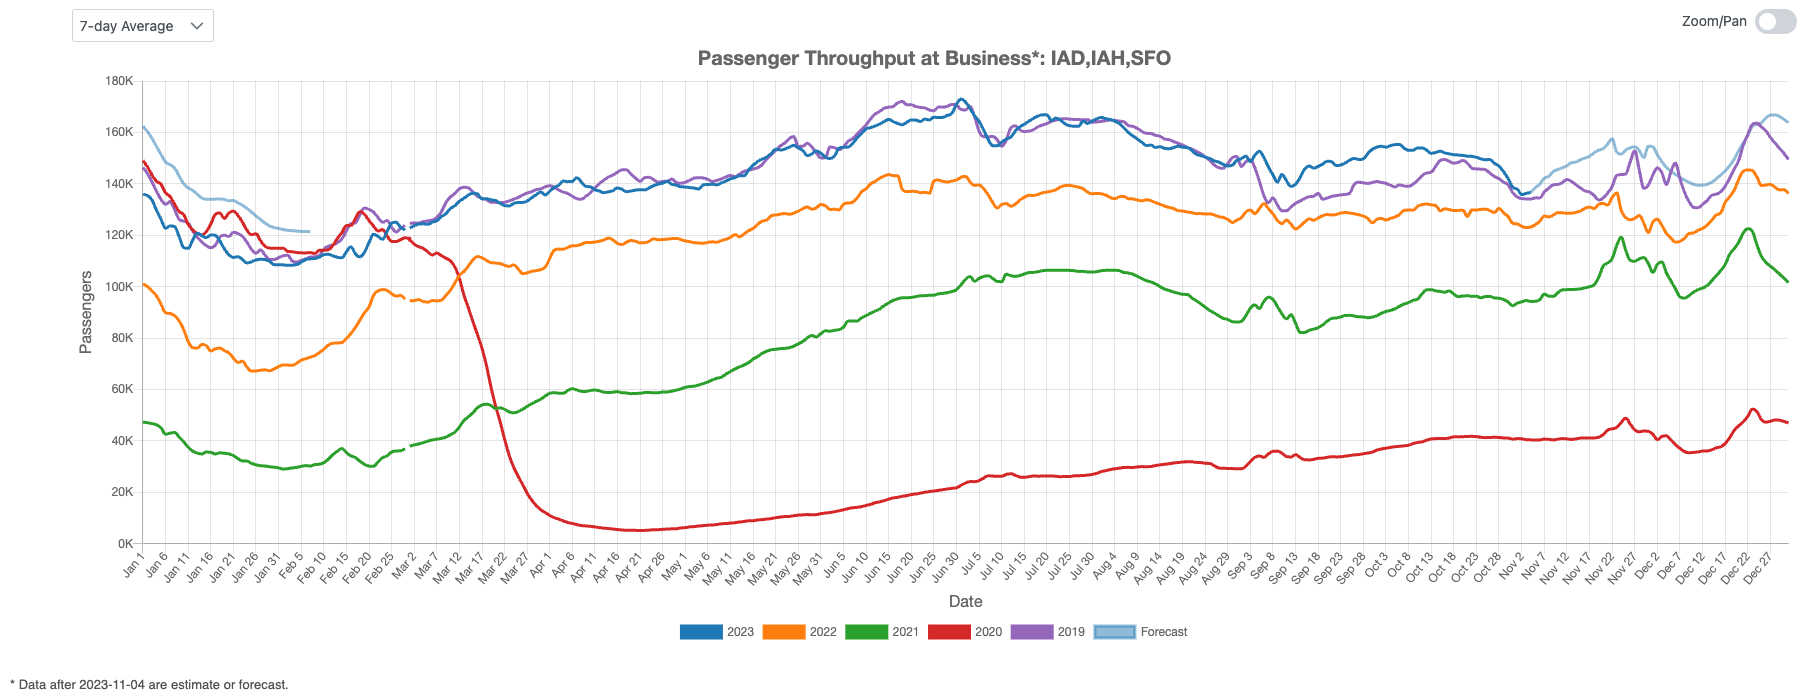
Figure 5: US Business Air Traffic Indicator
U.S. air travel trends indicate a strong domestic recovery, surpassing pre-pandemic levels by over 10% in October, with further growth expected in November. International travel is positioned to return to and exceed pre-COVID-19 levels. Leisure travel remains robust despite fluctuations in October, while business travel, after a dip, is forecasted to stay at pre-pandemic levels for the remainder of the year.