The US BizAv (Business Aviation) market has been booming since March 2021. This series of articles track the traffic trend of this market. We define the BizAv market as part-135 on-demand for-hire private flying by business jets or certain turboprop planes. The numbers in the following charts exclude part-91 private flights. If you are interested in all flights by business jets, or detailed flights by route and operator, please get in touch with us.
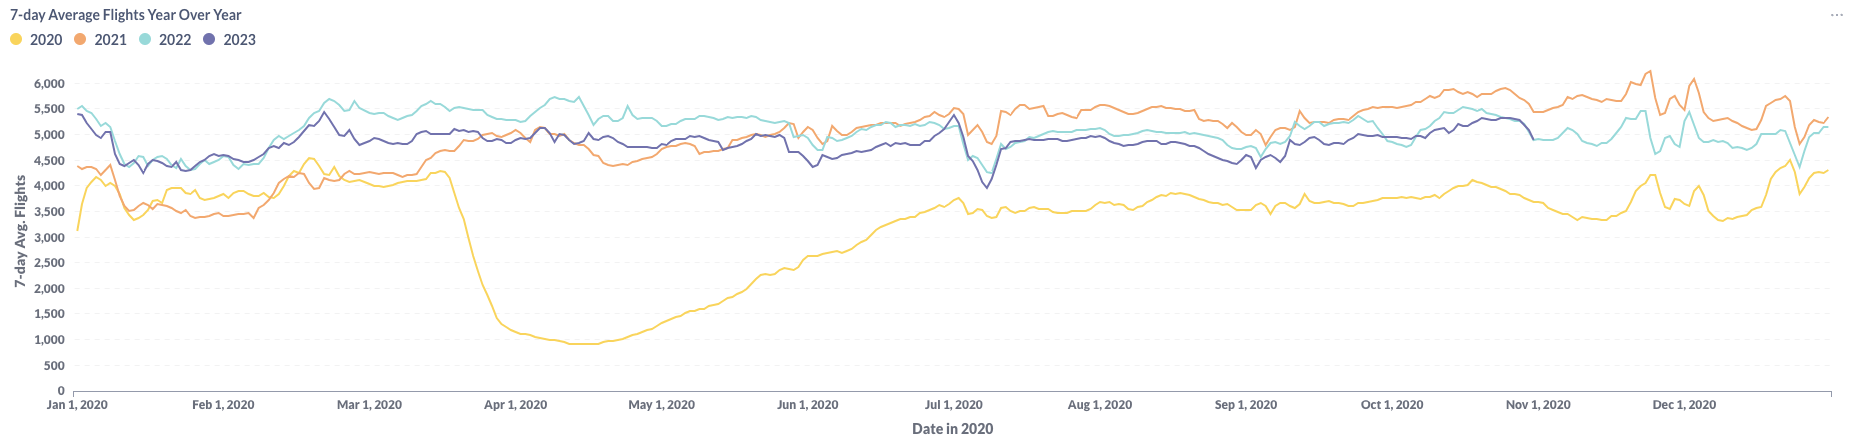
Figure 1: Year over Year Trend of the U.S. BizAv Market
Figure 1 provides a visual representation of the trajectory of U.S. Business Aviation (BizAv) traffic spanning from January 2020 to October 2023. Notably, the graph illustrates an upsurge in traffic during October 2023, albeit followed by a subsequent decline that nullified the gains made. As of the conclusion of October 2023, the 7-day average flight count has reverted to levels comparable to those seen in 2022. However, it is crucial to acknowledge that the current volume still lags behind the record-high observed in 2021 by 11%.

Figure 2: Comparison of the U.S. BizAv Flights This Month vs. Last Month
Figure 2 presents a side-by-side comparison of flight data for September 2023 and October 2023. In this specific timeframe, there was a noteworthy 6% increase in daily flights compared to the preceding month, and daily flight hours showed a substantial gain of 8.8%. It’s important to note that the overall monthly figures for both flights and flight hours were elevated due to the additional day in October. Across all aircraft types, there was a month-to-month growth in activity. Particularly noteworthy was the surge in flights by Large Jets, which significantly contributed to the 2.6% increase in hours per flight.
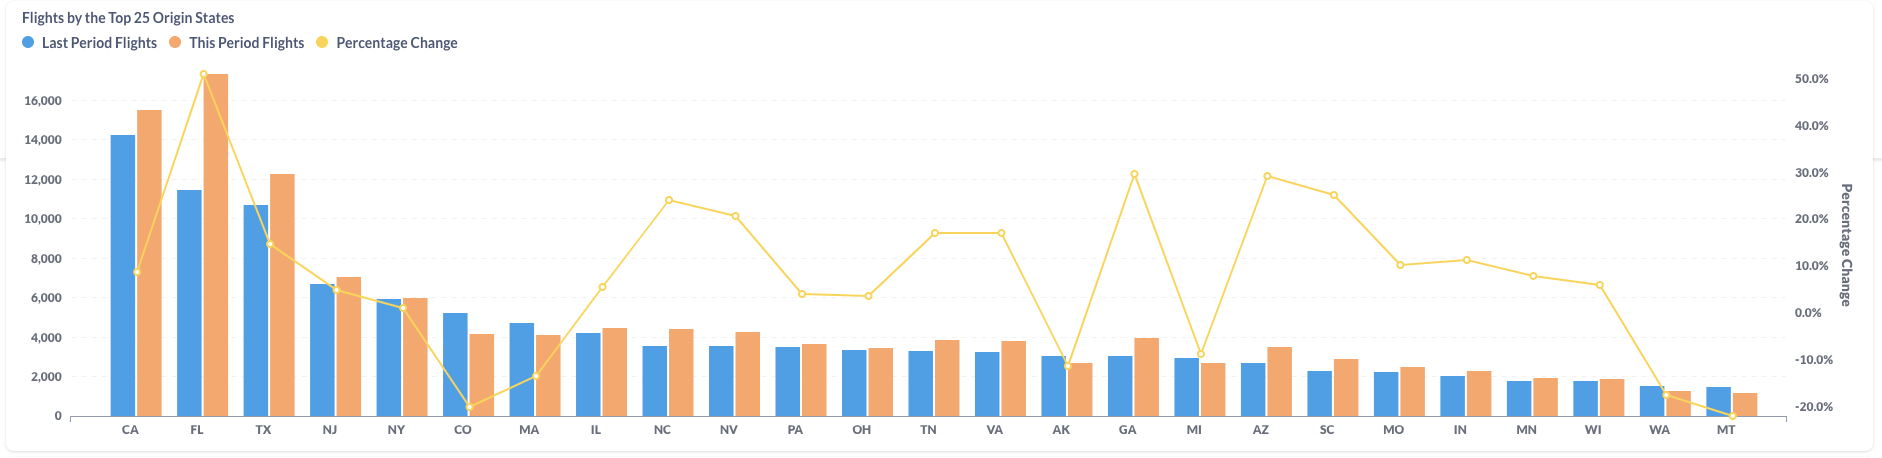
Figure 3: Comparison of the U.S. BizAv Flights by the Top 25 Origin States (This Month vs. Last Month)
In the transition from September to October 2023, the majority of U.S. states experienced some degree of growth in their aviation activity. Notably, Florida (FL) emerged as the most prominent winner, with a substantial month-to-month growth of 51%, catapulting it back to the top position as the leading origin state for flights. Similarly, other top states such as California (CA) and Texas (TX) also reported robust growth in their aviation activity.
On the flip side, certain states, like Colorado (CO) and Massachusetts (MA), saw a decline in flight activity during the same period.

Figure 4: Comparison of the U.S. BizAv Flights This Year vs. Last Year
In contrast to October 2022, October 2023 witnessed a nearly 2% decrease in the overall number of business flights. This reduction in flight frequency was accompanied by a more modest 1% decline in total flight hours, which can be attributed to an increase in the average hours per flight.
Among the various aircraft categories, half of them experienced a decline in activity, with the most substantial decrease observed in the Very Light Jets category, registering a notable drop of 14.3%. Conversely, the Super Midsize Jet and Large Jet categories demonstrated resilience, showing gains of 5.0% and 5.8%, respectively.

Figure 5: Comparison of the U.S. BizAv Flights by the Top 25 Origin States (This Year vs. Last Year)
When examining flight data for October 2022 and October 2023, it becomes evident that various states exhibited differing trends in flight numbers. For instance, Florida (FL) witnessed a modest increase of 1.6% in its flight activity. In contrast, California (CA) and Texas (TX) both experienced declines, with California seeing a 4.4% decrease and Texas registering a 3.6% reduction in flight activity during the same period.