Traffic and fare data by airline and route can provide valuable insights into market trends, demand, and competition. By analyzing this data, airlines can optimize their pricing strategies, plan their capacity, and make informed decisions about their route network. The data can also be used for market and competitive analysis, helping airlines identify profitable routes and gain a competitive advantage.
Based on initial true O&D level data from FlightBI released this week, both US domestic and US international air traffic experienced a decline from July to August. Meanwhile, average airfares fell slightly.
Volume Trend
The US air market returned to its normal trend in passenger volume according to the latest Origin and Destination (O&D) data. In August 2023, US domestic air travel registered 54.1 million passengers, a 5% decrease from 57.0 million in July due to seasonality. However, the August 2023 traffic is 3% above the pre-pandemic passenger count of 52.4 million recorded in August 2019. Concurrently, the international sector of the US air market was decreased from 23.5 million to 22.0 million.
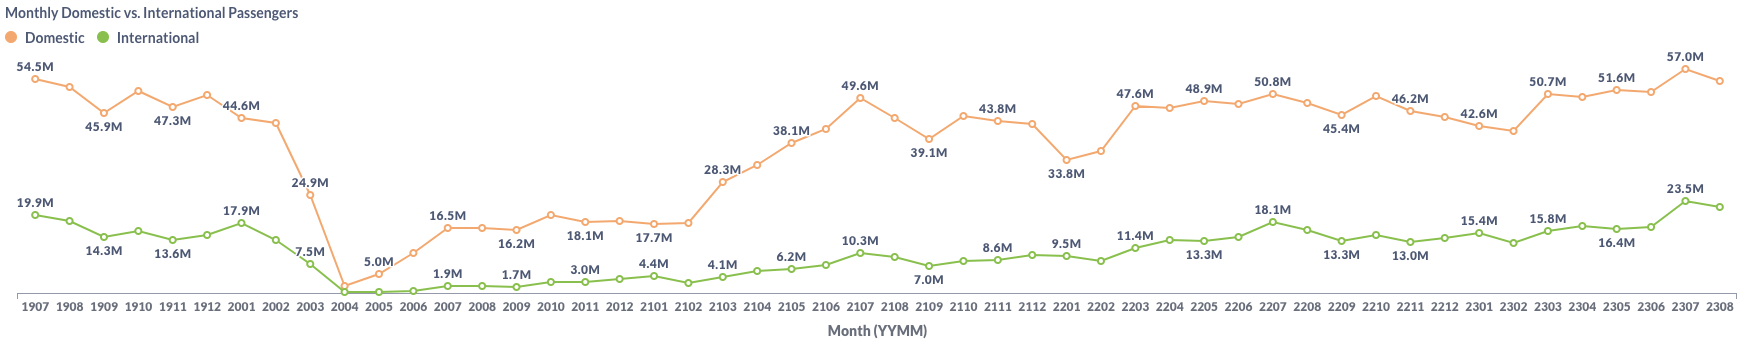
Figure 1: US Domestic and International Air Traffic by Month
Airfare Trend
Airfare trends in the domestic market have shown a stabilization, as evidenced by the average gross fare for air travel from $220 in July to $217 in August. Simultaneously, the average net fare has dropped from $189 in July to $186 in August.
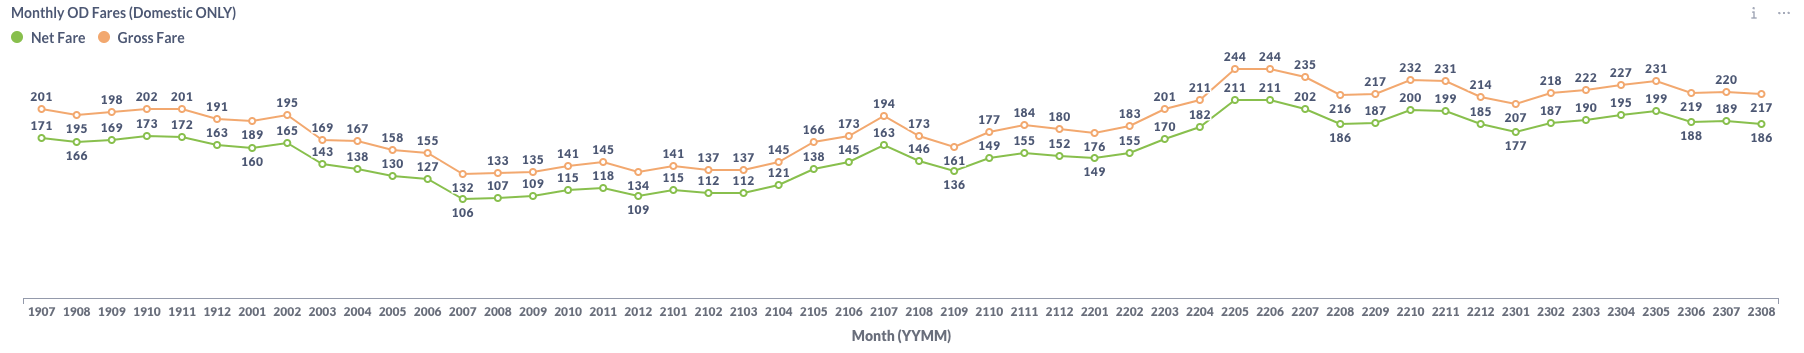
Figure 2: US Domestic Average Airfare by Month
According to the Energy Information Administration (EIA), jet fuel prices rose again in August, as shown in the chart below. This suggests a potential reduction in profit margins for airlines.
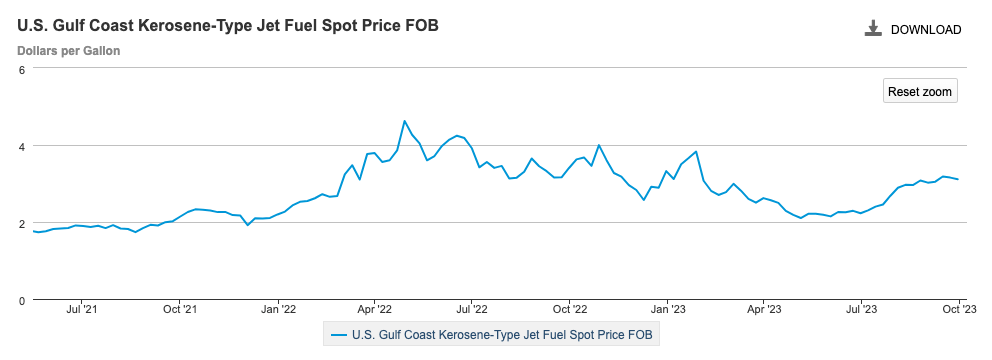
Figure 3: US Jet Fuel Price
Load Factor Trend
In August, the average load factor for major US airlines fell to 80.2%, down from 84.4% in July 2023, as illustrated in Figure 4 below. Two airlines with headquarters in Dallas, Southwest (WN) and American (AA), played a significant role in this descend because fewer people travelled in August from Dallas.
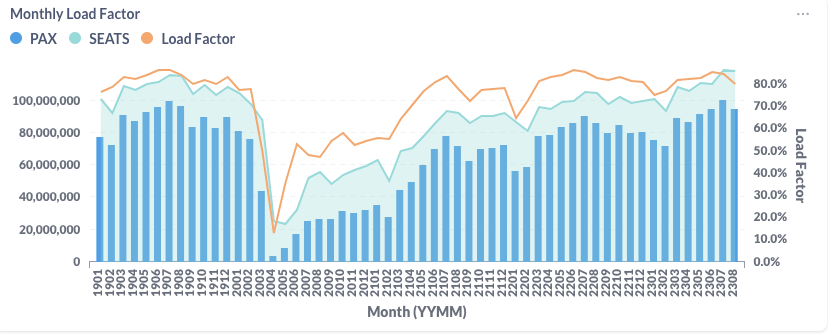
Figure 4: US Airlines’ Average Load Factor by Month
Month Over Month Comparison
From July to August 2023, all major US airlines obtained traffic decrease. This is a normal seasonality. The significant decline of traffic by Allegiant (G4) also reflected their business pattern, although this year it dropped quicker from July to August. Besides Allegiant(G4), Southwest (WN) also experienced a 7.3% decrease, followed by American (AA) at 6.1%.
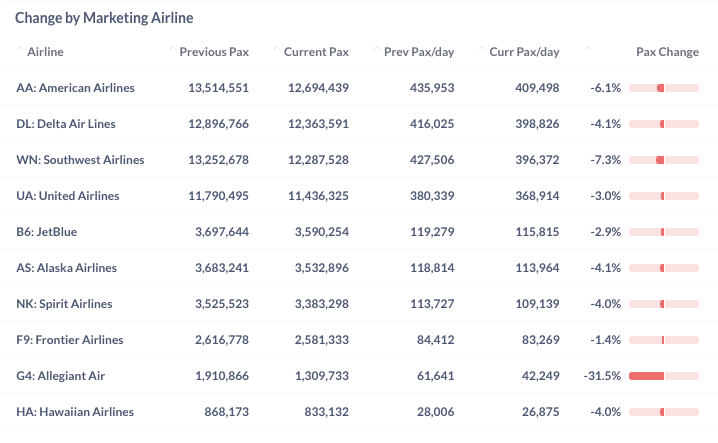
Figure 5: Air Traffic by Dominant Marketing Airlines in July 2023 (Previous) vs. August 2023 (Current)
During the same period, all top airports except Boston (BOS) saw a decline in daily passenger traffic from the previous month. Dallas (DFW) and Orlando (MCO) led the month-to-month drop, with 9.9% and 6.7% decrease.
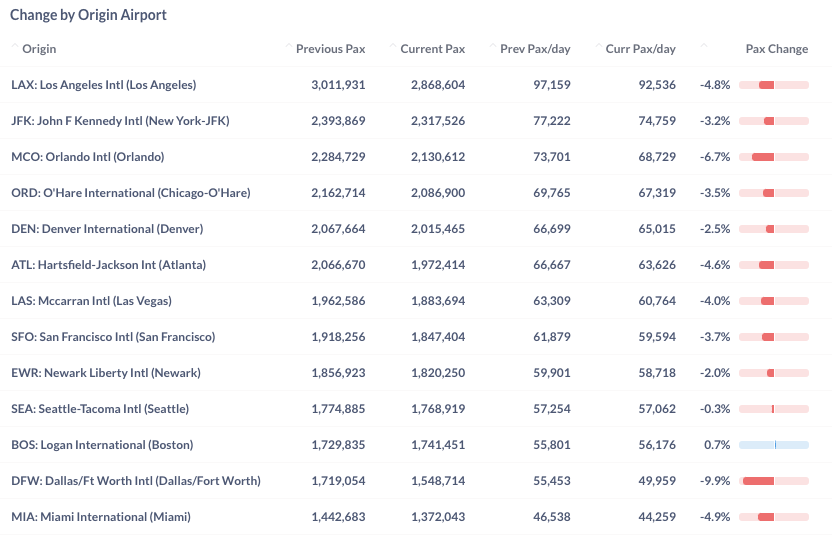
Figure 6: Air Traffic by Top Origin Airports in July 2023 (Previous) vs. August 2023 (Current)
Year Over Year Comparison
In a year-over-year comparison with August 2022, all major US airlines, with an exception of Allegiant (G4), recorded positive growth. Notably, United (UA), Frontier (F9), and Delta (DL) led year-over-year growth with 24.6%, 24.1% and 15.2%, respectively. Conversely, Allegiant (G4) experienced a 5.2% decline from last year.
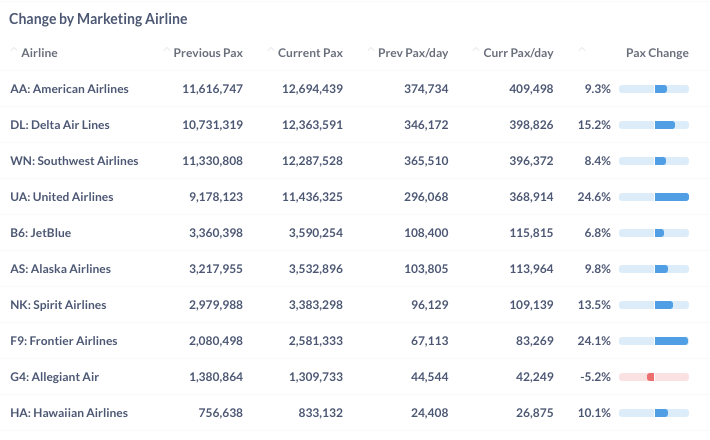
Figure 7: Air Traffic by Dominant Marketing Airlines in August 2023 (Current) vs. August 2022 (Previous)
Between August 2022 and August 2023, all top airports exhibited growth above 9%. Particularly, two California airports, San Francisco (SFO) and Los Angeles (LAX), spearheaded the year-over-year growth, boasting substantial increases of 27.6% and 23.7% respectively.
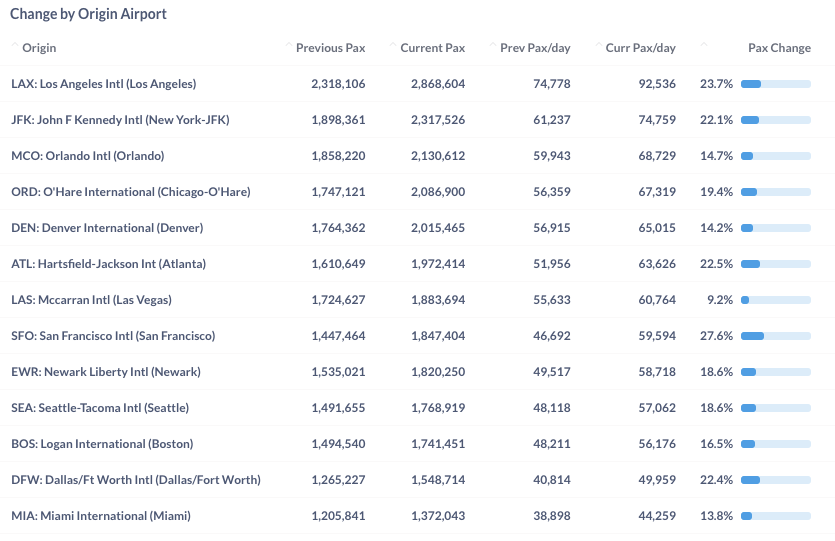
Figure 8: Air Traffic by Top Origin Airport in August 2023 (Current) vs. August 2022 (Previous)
For more detailed information on traffic and fares by route and airline, please contact service@flightbi.com or request a demo of Fligence USOD. They will be able to provide you with customized information to meet your specific needs and requirements.