Daily and hourly airport traffic is crucial for businesses related to airports, including airport authorities, airlines, retailers, ground handlers, rental car companies, and hotels. If you belong to any of these industries, utilizing daily airport traffic data can help you plan your operations, schedule your resources, forecast revenue, and plan budgets more accurately. Additionally, this data can help you target your marketing and promotional efforts more specifically, leading to more effective business strategies.
FlightBI collects and normalizes the airport passenger throughput data from US Transportation Security Administration (TSA). In addition, it has developed a product called Fligence TSA, which features a wide variety of data visualizations. FlightBI is currently offering a two-week, no-obligation trial of Fligence TSA for you to explore valuable insights from the airport traffic data.
This article summarizes US air traffic using the aforementioned tool, utilizing actual airport-level data as of Sep. 2nd, 2023. Our analysis will examine trends in different segments of air travel, such as domestic versus international flights and leisure versus business travel. To learn more about the specific airports chosen to represent these markets, please refer to this article.
US Overall Airport Traffic Status
Figure 1 illustrates that US air traffic has rebounded to its pre-pandemic state, matching the volume seen in 2019 — the last normal year before the COVID-19 outbreak. Notably, traffic around and post-Labor Day this year surpassed that of 2019. Based on these trends, we anticipate that air traffic in the next three months will likely surpass 2019 levels.
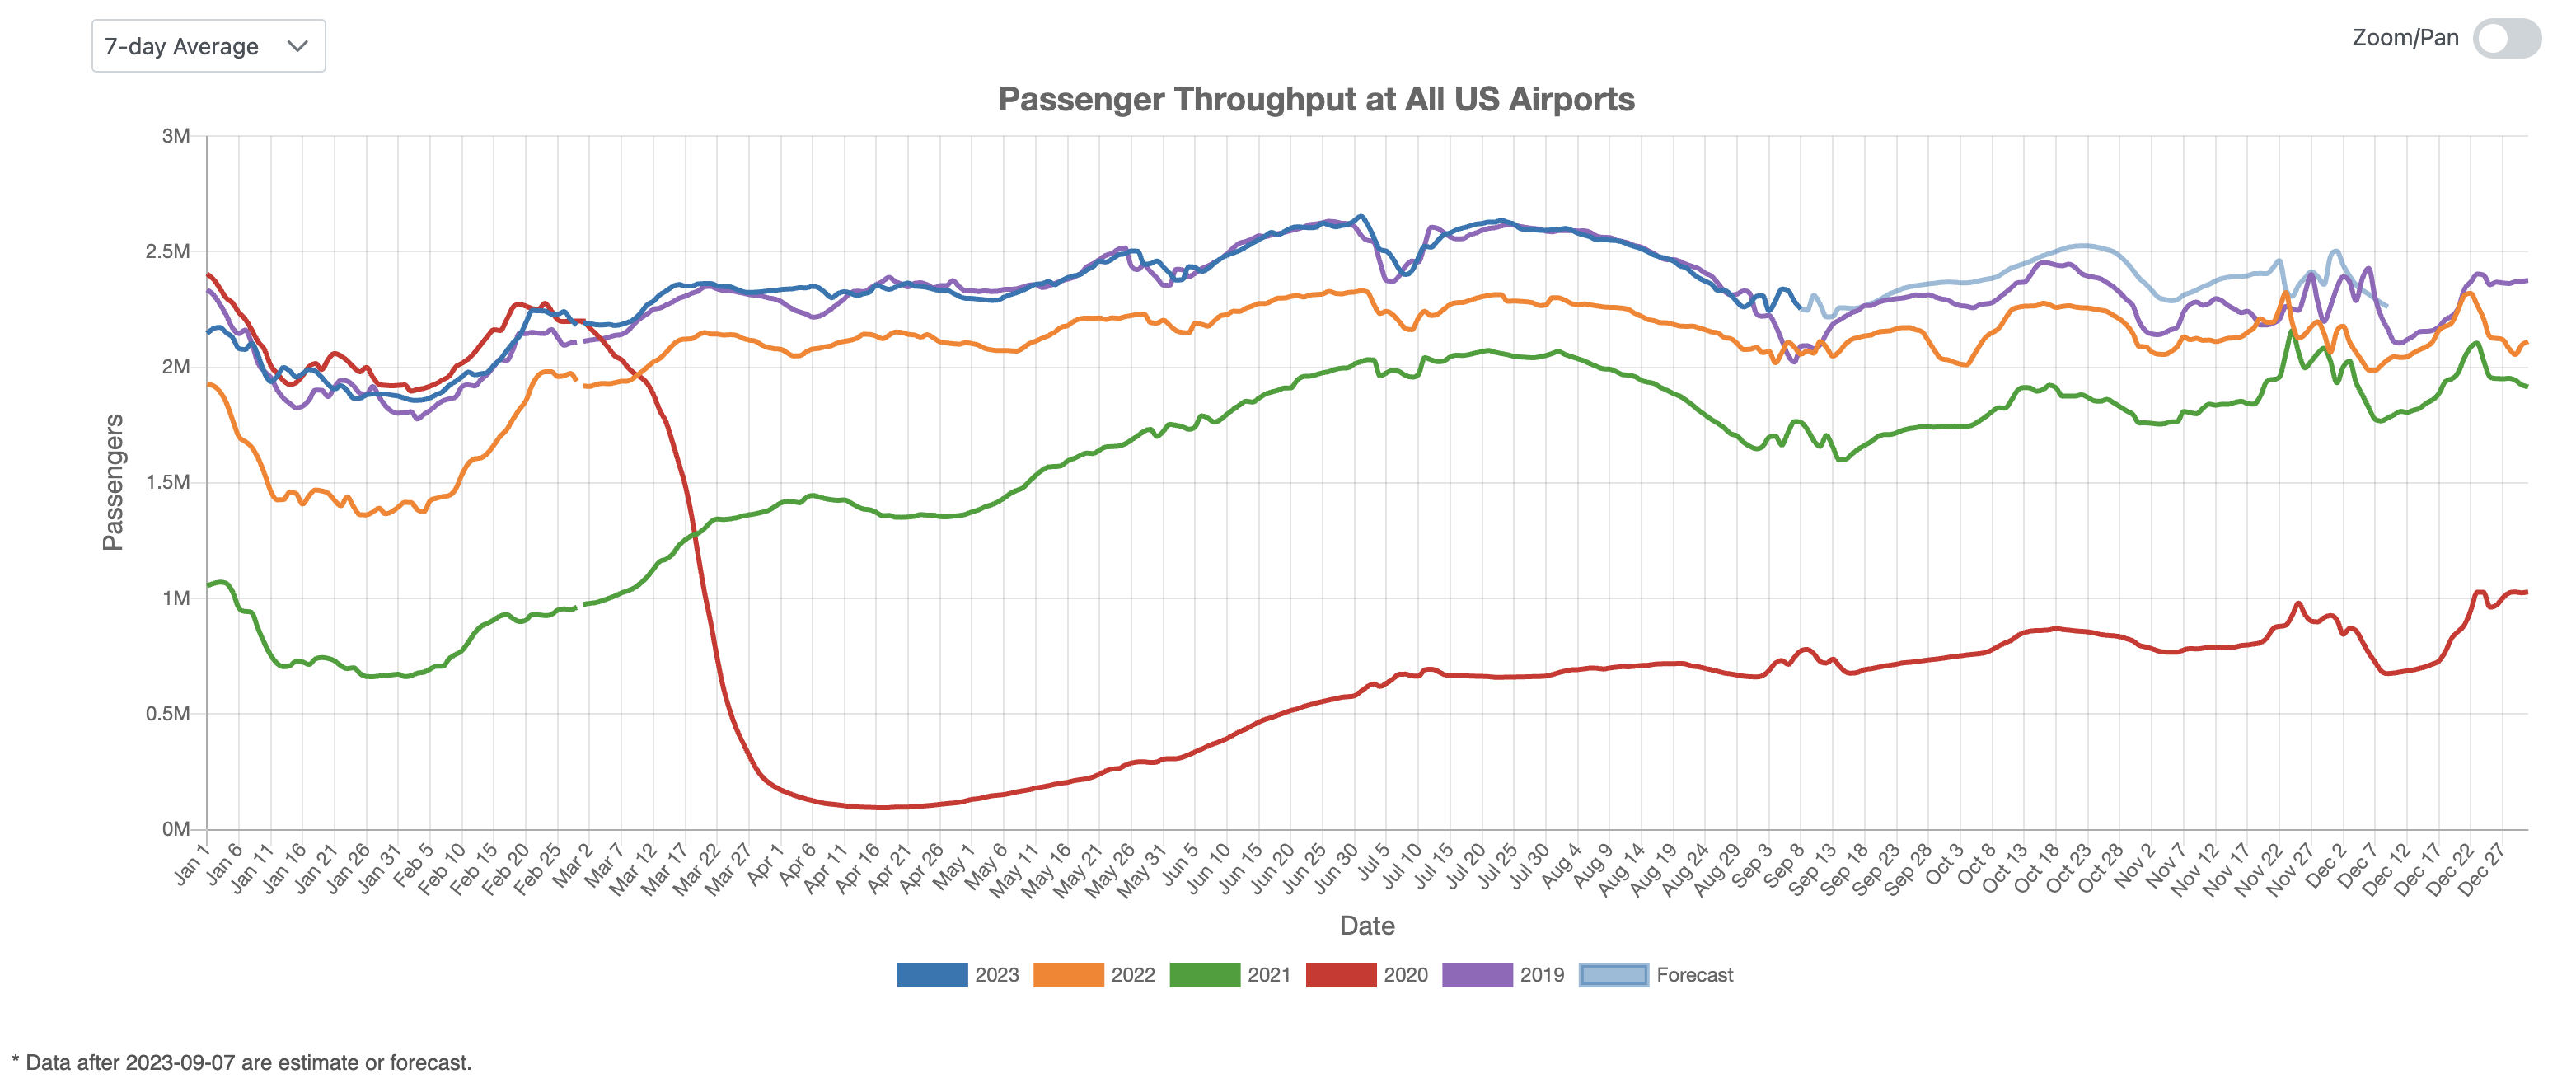
Figure 1: US Overall Air Traffic Trend
Domestic Airport Traffic Indicator
Figure 2 showcases the trend in domestic US air traffic, with a decline observed from mid-July through early September. This year’s decline mirrors that of 2021 but is more pronounced than in previous years. Despite this, the overall volume remains above pre-pandemic levels. Post-September, we anticipate a robust resurgence in traffic, projecting an increase of 5% to 10% over the highest recorded historical levels.

Figure 2: US Domestic Air Traffic Indicator
International Airport Traffic Indicator
Figure 3 presents the index of international air traffic in the US, highlighting stability in August. The gap between 2023 and 2019 figures is expected to narrow in September, indicating a sustained recovery in international air travel and suggesting a bright outlook for the industry’s resilience.

Figure 3: US International Air Traffic Indicator
Leisure Air Traffic Indicator
In August, leisure air travel experienced a downturn. However, as Figure 4 reveals, 2023’s leisure air traffic volume remains above that of 2019 and 2022, though the lead is diminishing. Moving ahead, we foresee significant growth post-September, underscoring the enduring strength of the leisure air travel sector.
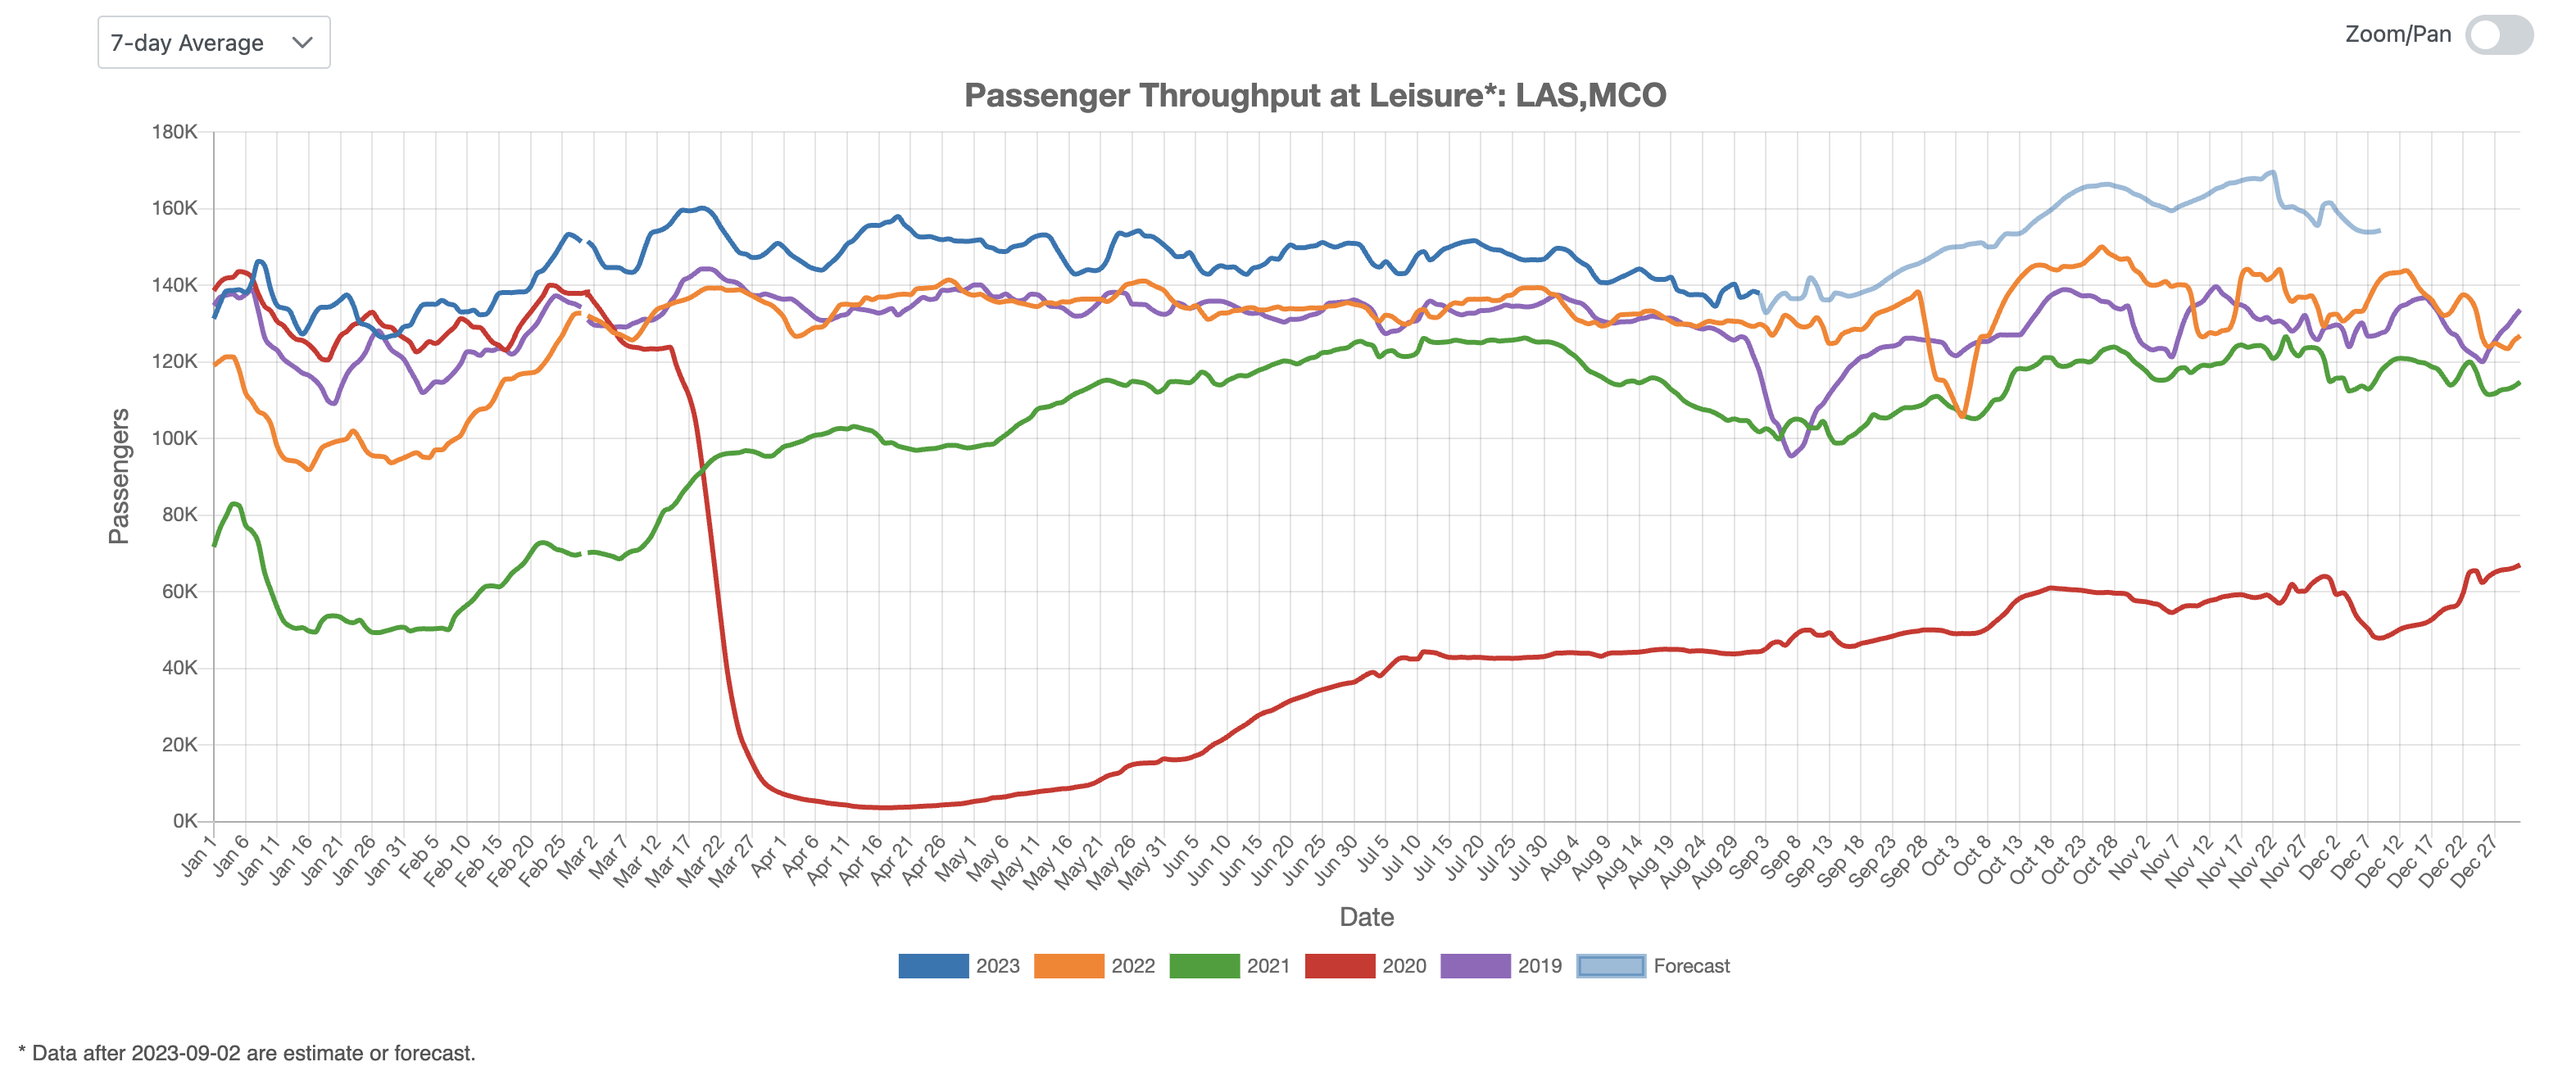
Figure 4: US Leisure Air Traffic Indicator
Business Air Traffic Indicator
Focusing on business-related air travel, Figure 5 reveals that 2023’s trends align with 2019’s levels. Forecasts suggest that business air traffic is on track to surpass previous historical peaks. This trend offers an optimistic view of the business travel sector’s recovery, hinting at potential growth beyond pre-pandemic levels.
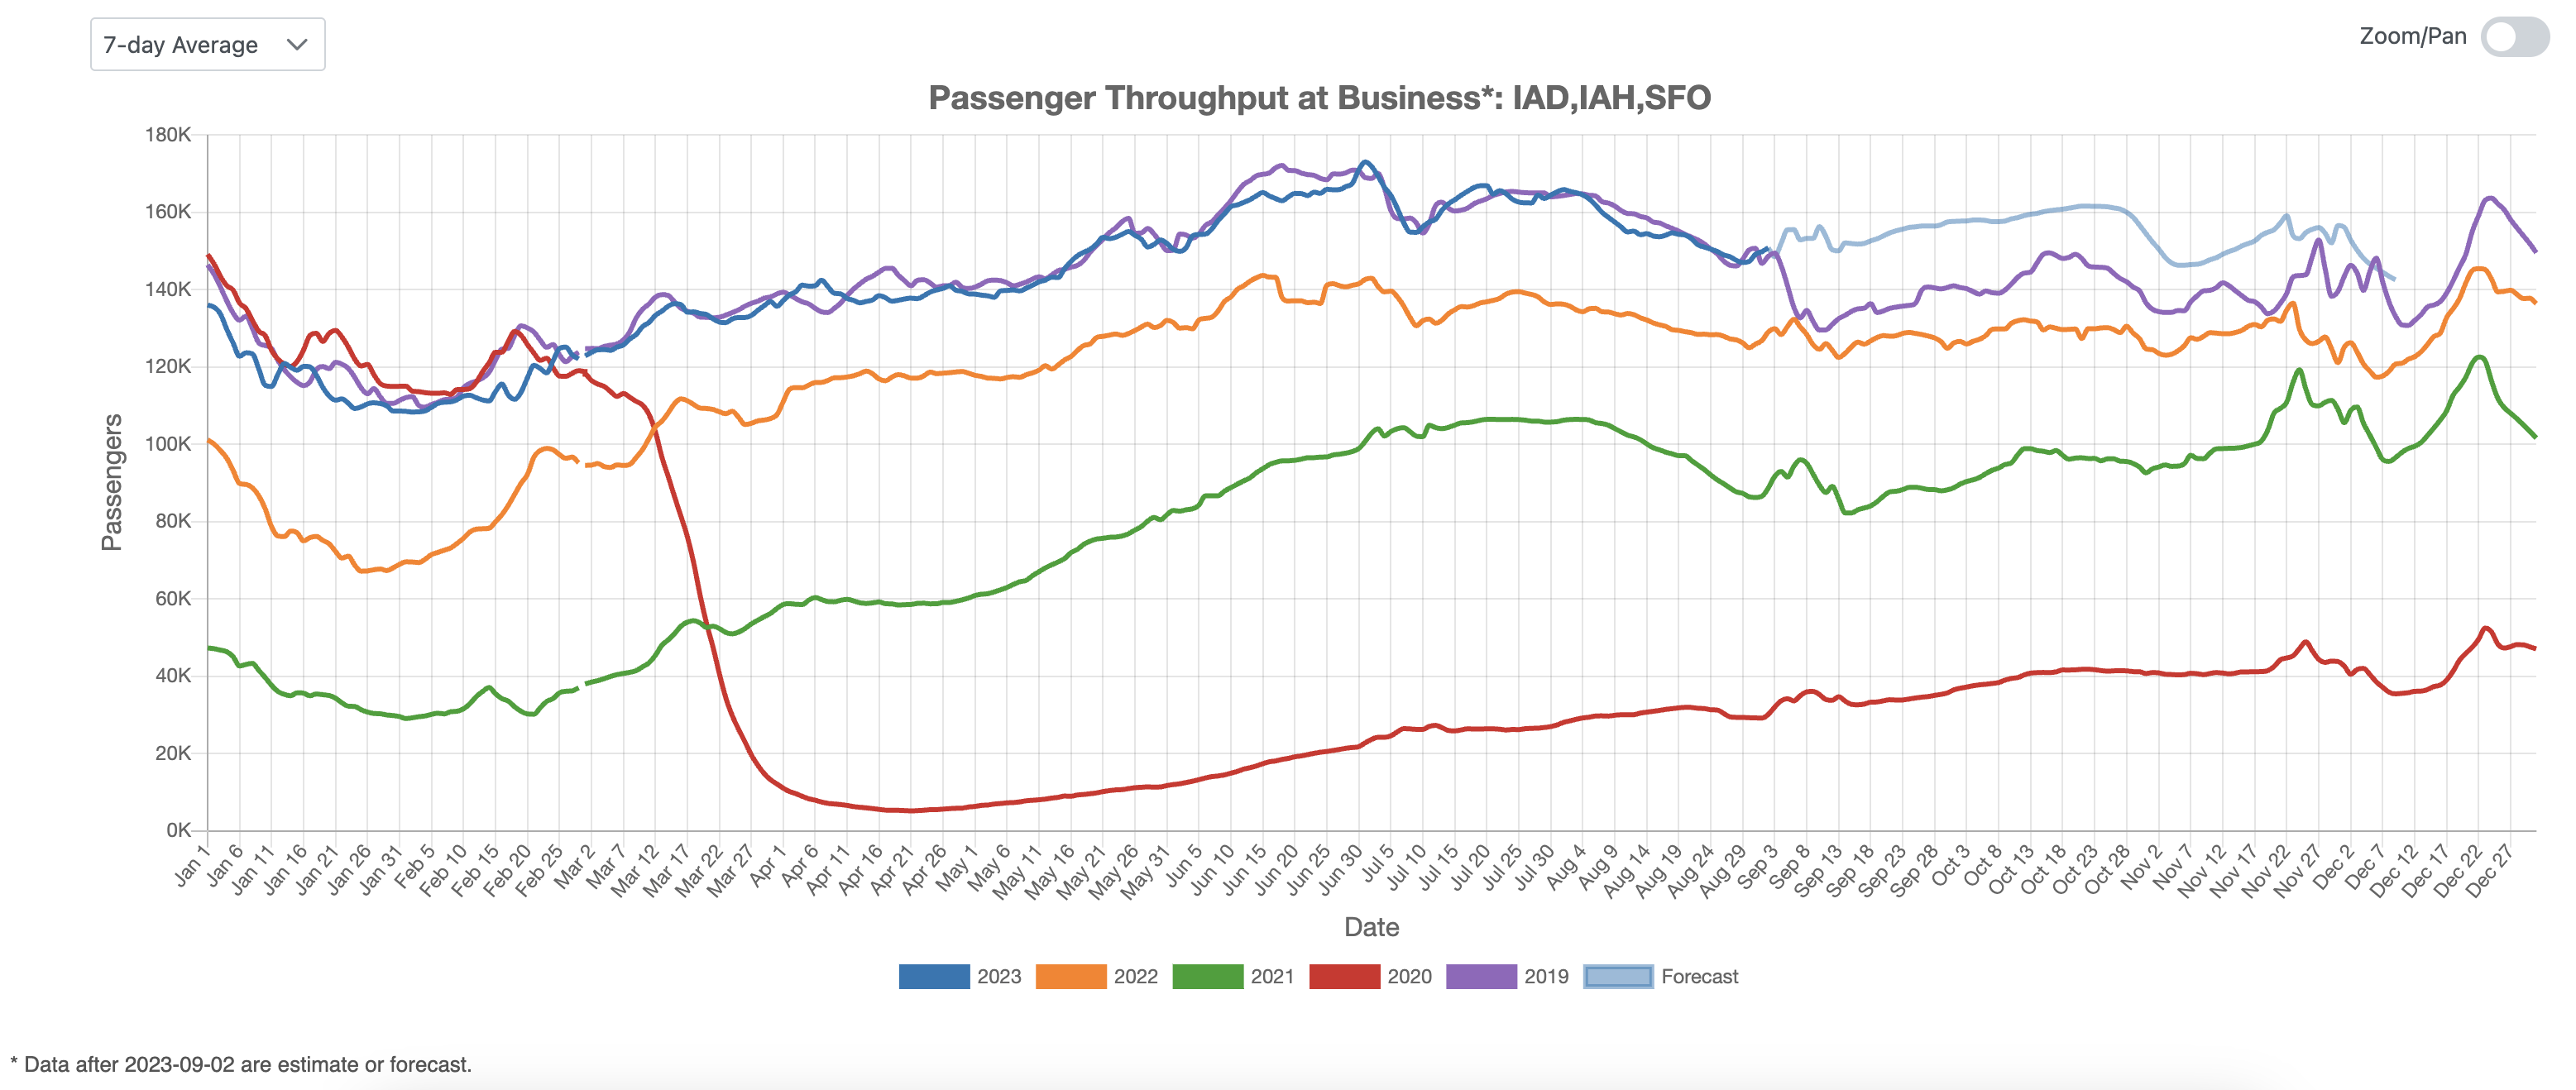
Figure 5: US Business Air Traffic Indicator
To summarize, domestic air traffic saw a dip from mid-July to early September but retained an overall volume above pre-pandemic levels. International flights remained stable in August, with a narrowing gap between 2023 and 2019 figures, pointing to a continued recovery. Leisure travel witnessed a downturn in August, although 2023’s volume still surpasses that of both 2019 and 2022. Last but not least, business air travel trends in 2023 mirrored 2019, signaling an optimistic recovery.