The US BizAv (Business Aviation) market has been booming since March 2021. This series of articles track the traffic trend of this market. We define the BizAv market as part-135 on-demand for-hire private flying by business jets or certain turboprop planes. The numbers in the following charts exclude part-91 private flights. If you are interested in all flights by business jets, or detailed flights by route and operator, please get in touch with us.
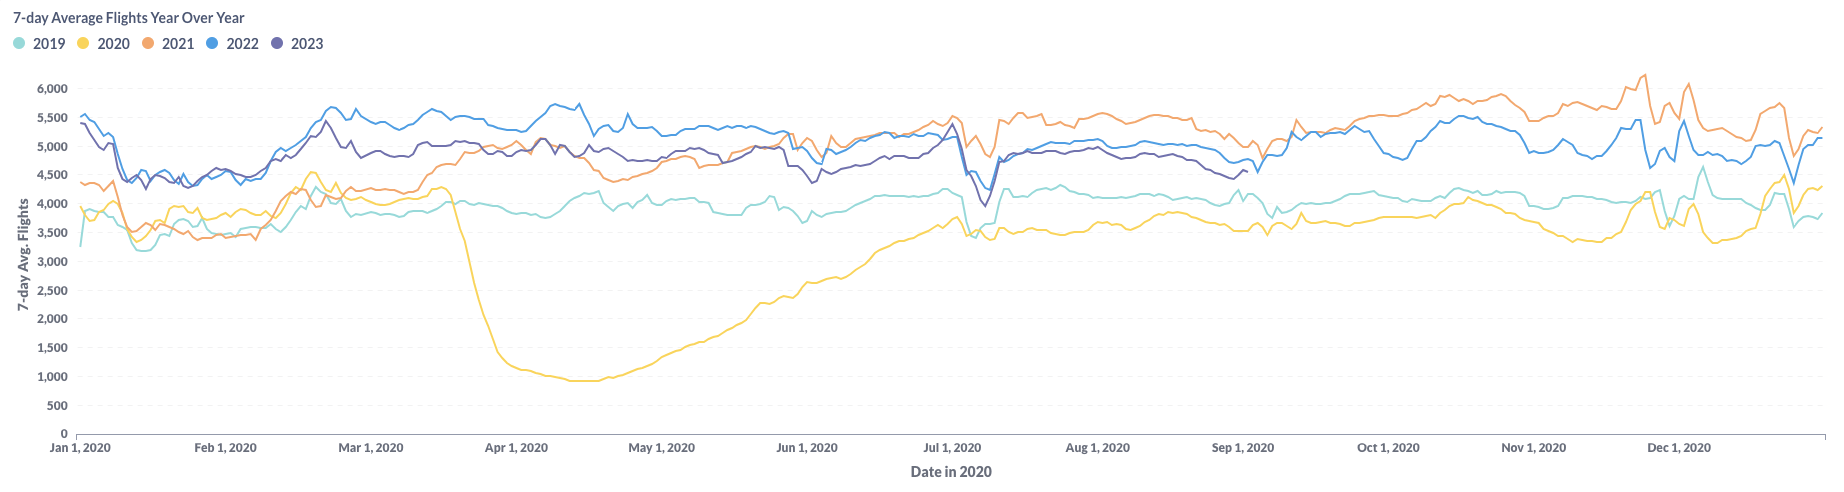
Figure 1: Year over Year Trend of the U.S. BizAv Market
Figure 1 visually represents U.S. BizAv traffic from January 2019 to August 2023. This depiction suggests a declining trend in the overall U.S. BizAv market. While there’s been a customary dip in traffic during the latter part of August over the last three years, the disparity between 2023 and 2022 has widened.
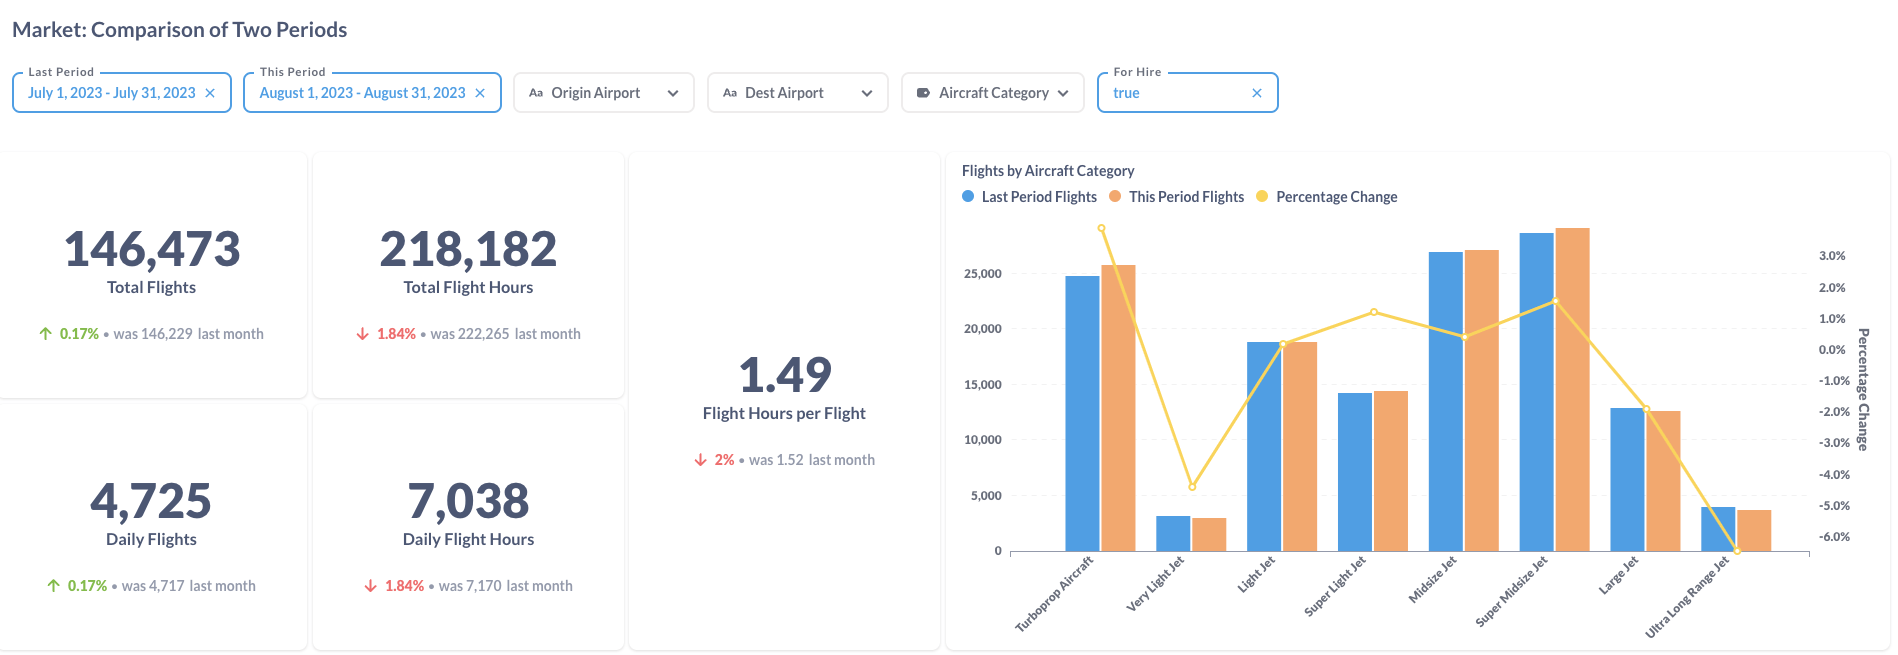
Figure 2: Comparison of the U.S. BizAv Flights This Month vs. Last Month
Figure 2 offers a side-by-side comparative of flight data from July 2023 to August 2023. While the number of flights remained largely consistent, There was a notable reduction in total flight hours. August saw a 3.9% increase in flights operated by Turboprop compared to July. Conversely, flight by Ultra Long Range Jet decreased by 6.5%, which primary accounts for the reduction in total flight hours.

Figure 3: Comparison of the U.S. BizAv Flights by the Top 25 Origin States (This Month vs. Last Month)
From July to August 2023, flight trends diverged across U.S. states. Some states witnessed an increase in flight numbers, while others experienced a decline. The most substantial reductions were noted in Florida (FL) and Colorado (CO). In contrast, California (CA), Texas (TX) and Now York (NY) registered growth in flight activity.
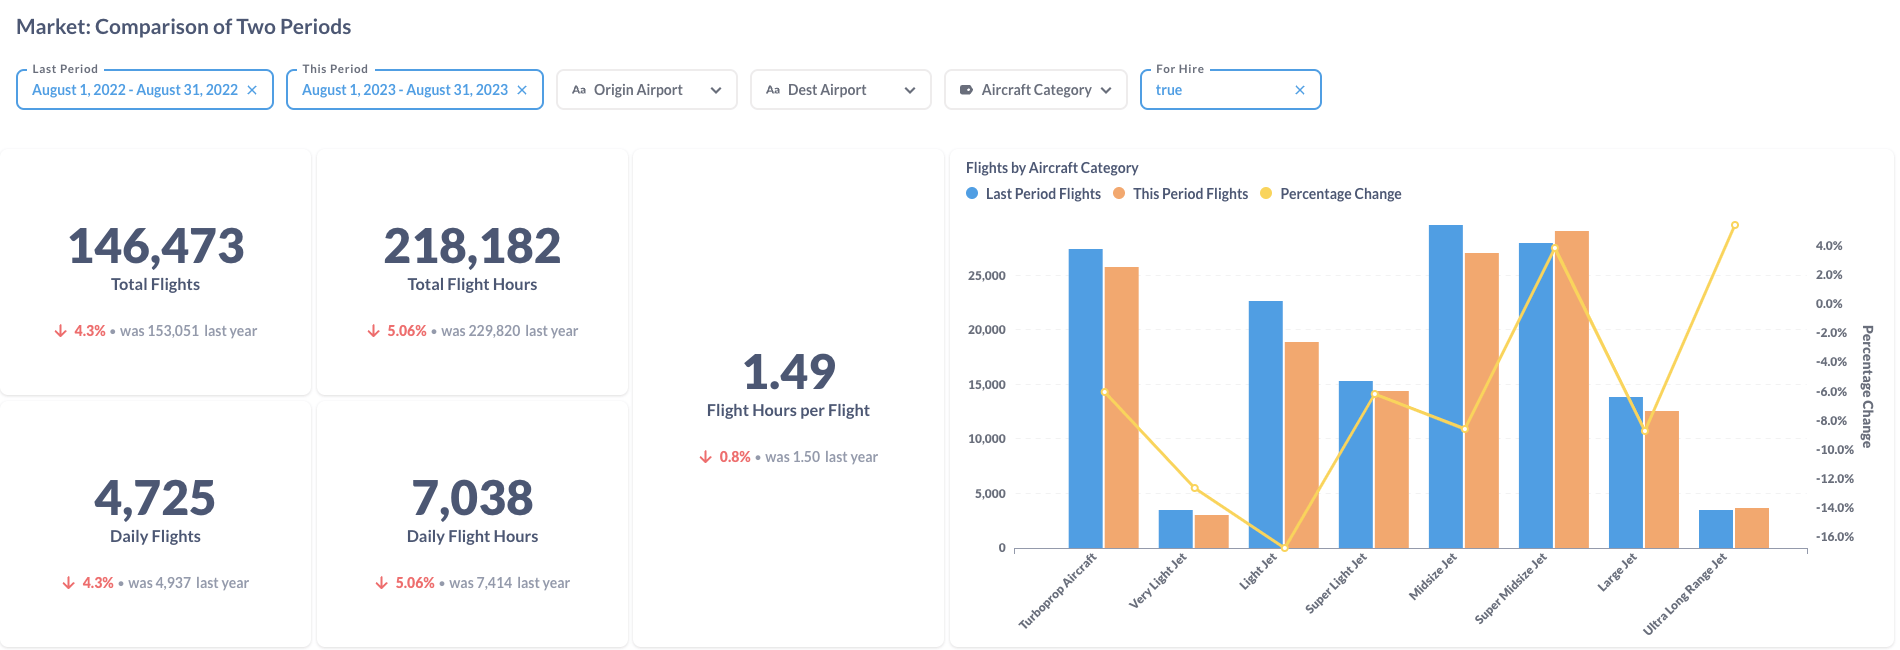
Figure 4: Comparison of the U.S. BizAv Flights This Year vs. Last Year
Compared to August 2022, the total number of business flights in August 2023 decreased by 4.3%. The decline in total flight hours was even steeper at 5.06%, attributed mainly to a contraction in average hours per flight. While the majority of aircraft categories saw a decline ranging between 6-17% drop, Super Midsize Jet and Ultra Long Range Jet gained 3.9% and 5.4%, respectively.

Figure 5: Comparison of the U.S. BizAv Flights by the Top 25 Origin States (This Year vs. Last Year)
When comparing flight data between August 2022 and August 2023, more states recorded a decline in flight numbers than those seeing an uptick. Despite a 10.2% year-over-year dip, California (CA) maintained its lead in August 2023 with the highest number of originating flights. Florida (FL) and Texas (TX) followed, with respective declines of 2.6% and 5.3% year over year.