Traffic and fare data by airline and route can provide valuable insights into market trends, demand, and competition. By analyzing this data, airlines can optimize their pricing strategies, plan their capacity, and make informed decisions about their route network. The data can also be used for market and competitive analysis, helping airlines identify profitable routes and gain a competitive advantage.
Based on initial true O&D level data from FlightBI released this week, both US domestic and US international air traffic experienced growth from June to July. Meanwhile, average airfares remained consistent with the previous month’s figures.
Volume Trend
The US air market continued the upward trend in passenger volume according to the latest Origin and Destination (O&D) data. In July 2023, US domestic air travel registered 57.5 million passengers, a 6.7% increase from 53.9 million in June. The July 2023 traffic is also above the pre-pandemic passenger count of 54.5 million recorded in July 2019. Concurrently, the international sector of the US air market was increased by 6.8% from 22.0 million to 23.5 million.
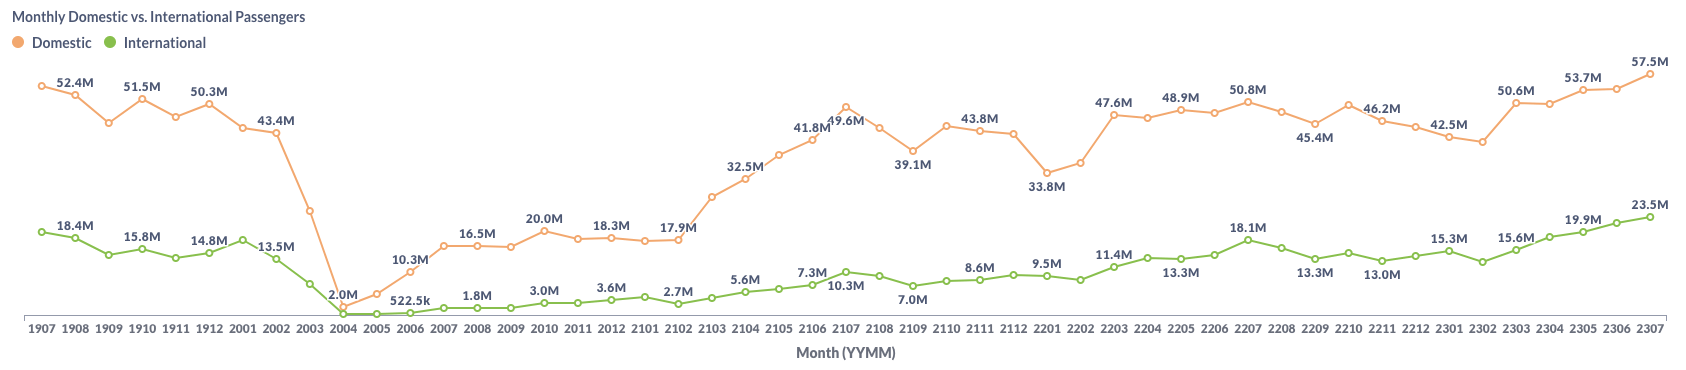
Figure 1: US Domestic and International Air Traffic by Month
Airfare Trend
Airfare trends in the domestic market have shown a stabilization, as evidenced by the average gross fare for air travel from $225 in June to $224 in July. Simultaneously, the average net fare has stayed at $192, the same as that in June.
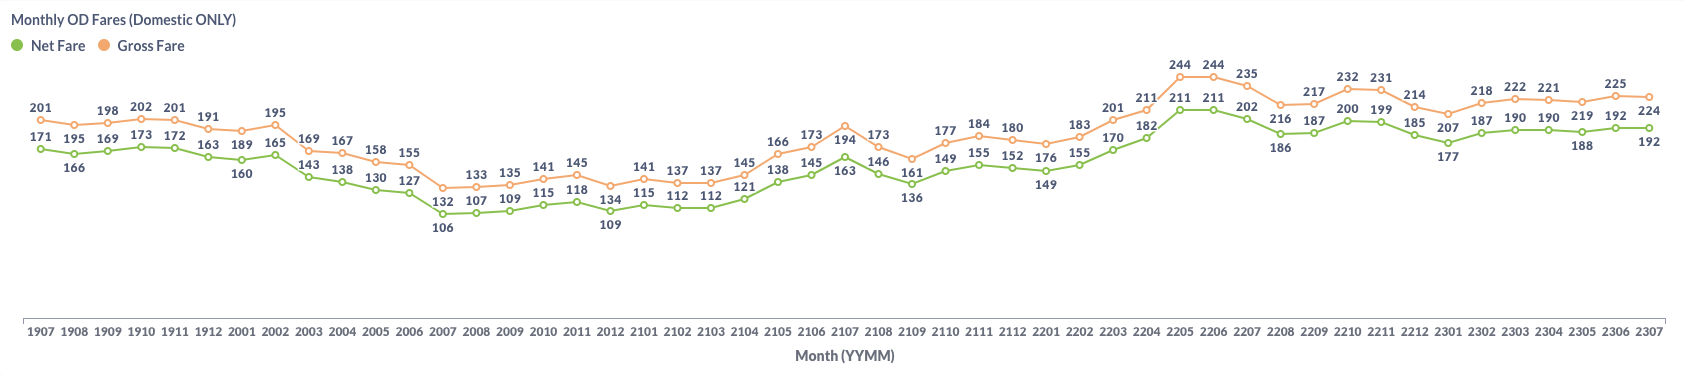
Figure 2: US Domestic Average Airfare by Month
According to the Energy Information Administration (EIA), jet fuel prices began to rise from July, as shown in the chart below. This suggests a potential future increases in airfares.
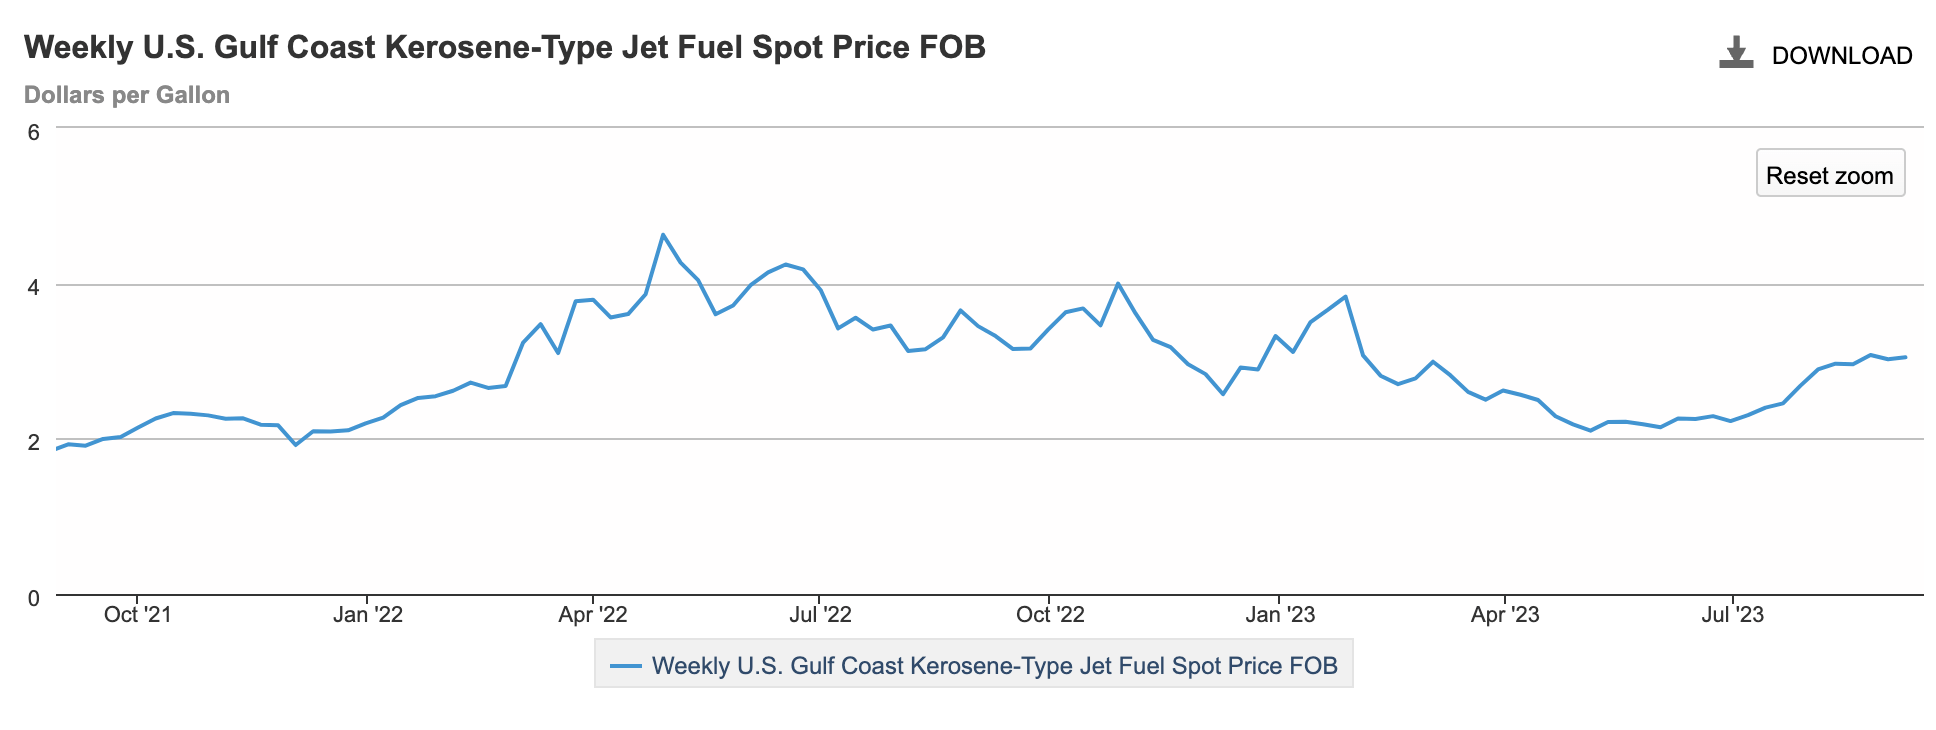
Figure 3: US Jet Fuel Price
Load Factor Trend
In July, the average load factor for major US airlines rose to 84.4%, up from 83.0% in June 2023, as illustrated in Figure 4 below. United (UA) and Southwest (WN) played a significant role in this uptick, probably due to overcoming previous operational challenges. Additionally, Spirit (NK) and JetBlue (B6) experienced enhanced utilization, buoyed by the surge in summer traffic.
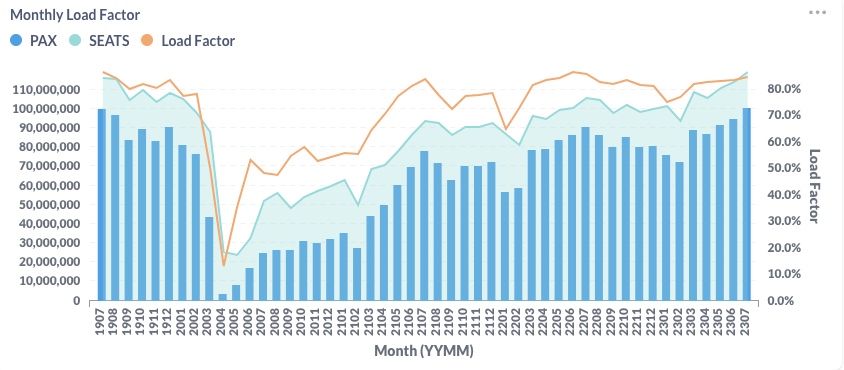
Figure 4: US Airlines’ Average Load Factor by Month
Month Over Month Comparison
From June to July 2023, all major US airlines except American (AA) obtained daily traffic growth. Southwest (WN) topped the list with a 7.9% increase, followed by United (UA) at 5.1%. Conversely, American (AA) recorded a 0.3% decline in daily traffic during the same period.
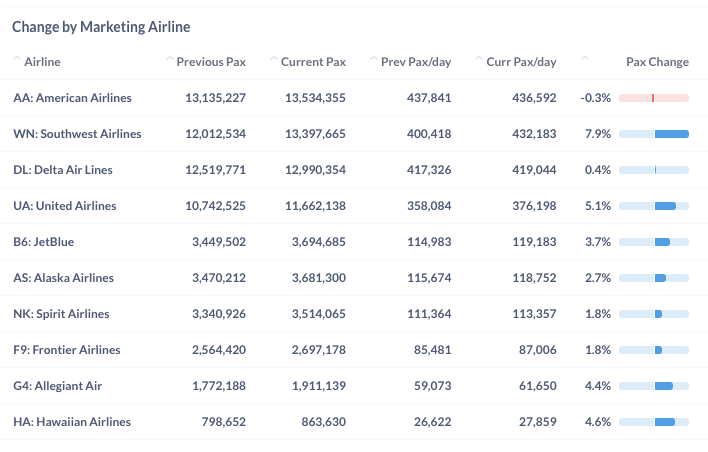
Figure 5: Air Traffic by Dominant Marketing Airlines in June 2023 (Previous) vs. July 2023 (Current)
In July 2023, some top airports saw a rise in daily passenger traffic from the previous month while others reported a decline. Denver (DEN), Orlando (MCO) and Ft. Lauderdale (FLL) led the month-to-month growth, with increases ranging from 4.7% to 6.7%. On the other hand, Dallas (DFW), Phoenix (PHX) and San Francisco (SFO) were among the top airports witnessing a 3.7-3.9% drop in daily traffic compared to the previous month.
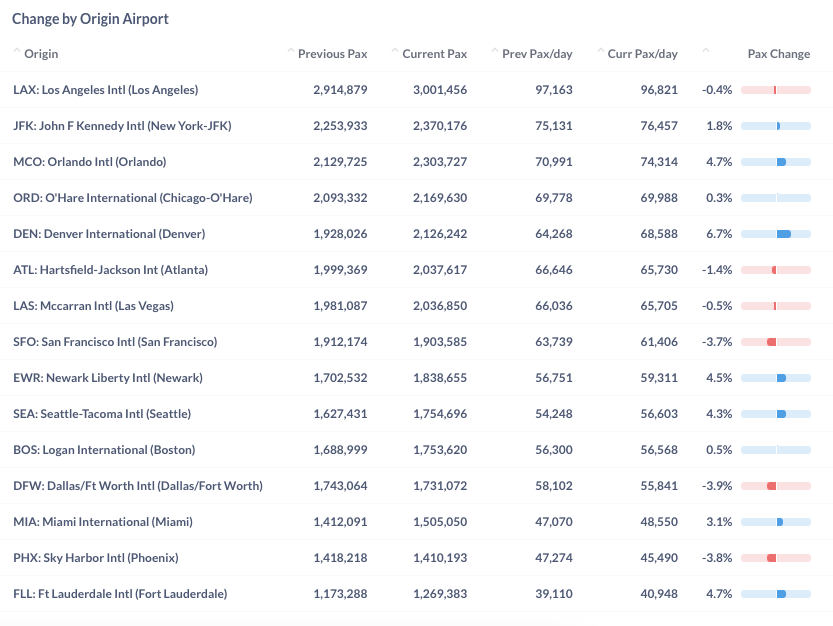
Figure 6: Air Traffic by Top Origin Airports in June 2023 (Previous) vs. July 2023 (Current)
Year Over Year Comparison
In a year-over-year comparison with July 2022, all major US airlines, with an exception of Allegiant (G4), recorded positive growth. Notably, Frontier (F9), United (UA) and Delta (DL) led year-over-year growth with 22.1%, 18.0% and 17.2%, respectively. While Allegiant (G4) was among the first to recover from COVID, it appears to have plateaued in terms of daily traffic.
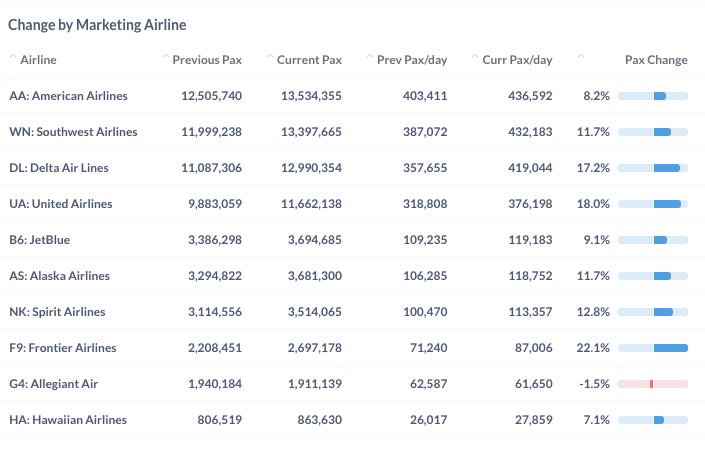
Figure 7: Air Traffic by Dominant Marketing Airlines in July 2023 (Current) vs. July 2022 (Previous)
Between June 2022 and June 2023, all top airports exhibited growth from 10.8% to 25.2%. Particularly, San Francisco (SFO) and Atlanta (ATL) spearheaded the year-over-year growth, boasting substantial increases of 25.2% and 23.4% respectively.
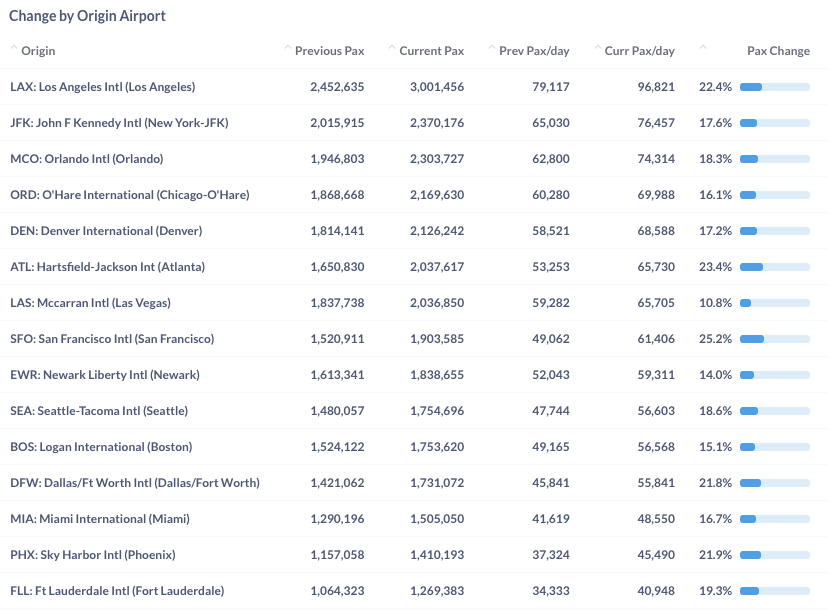
Figure 8: Air Traffic by Top Origin Airport in July 2023 (Current) vs. July 2022 (Previous)
For more detailed information on traffic and fares by route and airline, please contact service@flightbi.com or request a demo of Fligence USOD. They will be able to provide you with customized information to meet your specific needs and requirements.