Traffic and fare data by airline and route can provide valuable insights into market trends, demand, and competition. By analyzing this data, airlines can optimize their pricing strategies, plan their capacity, and make informed decisions about their route network. The data can also be used for market and competitive analysis, helping airlines identify profitable routes and gain a competitive advantage.
According to preliminary true O&D level data released by FlightBI this week, the US domestic air traffic was relatively flat from May 2023 to June 2023 and the international traffic had a healthy growth month over month. On the other hand, the average air fare bounced back from the previous month.
Volume Trend
The US air market continued the upward trend in passenger volume according to the latest Origin and Destination (O&D) data. In June 2023, US domestic air travel registered 53.9 million passengers, a slight increase from 53.7 million in May. The June 2023 traffic is well above the pre-pandemic passenger count of 51.1 million recorded in June 2019. Concurrently, the international sector of the US air market was increased by 10% from 19.9 million to 22.0 million.
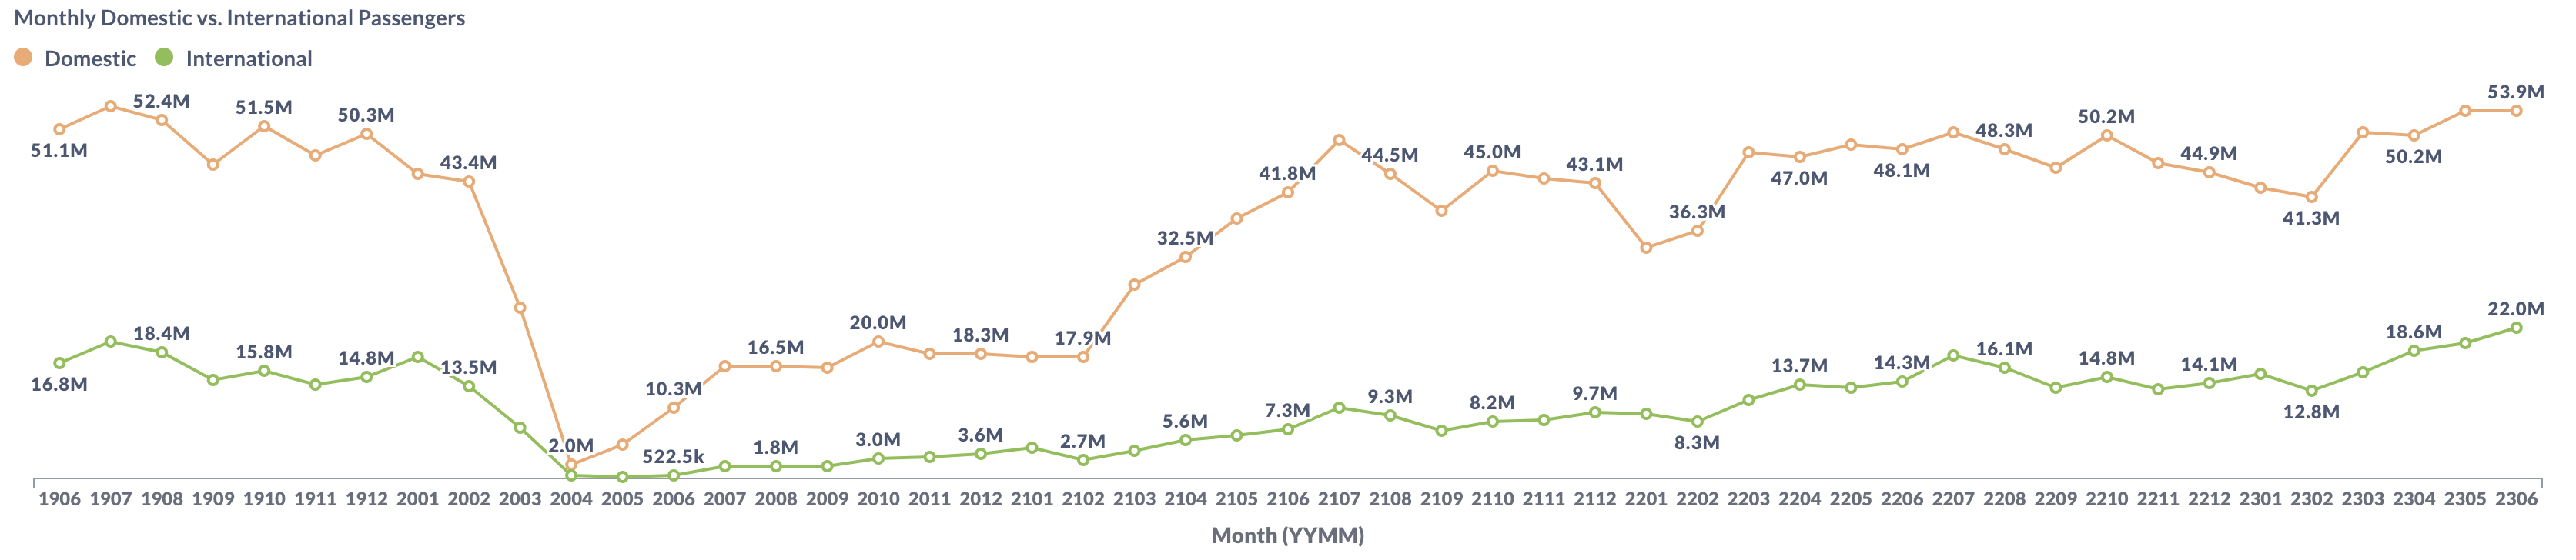
Figure 1: US Domestic and International Air Traffic by Month
Airfare Trend
Airfare trends in the domestic market have shown an increase, as evidenced by the average gross fare for air travel from $219 in May to $225 in June. Simultaneously, the average net fare demonstrated a similar upward trend, escalating from $188 to $192 during the same time frame.
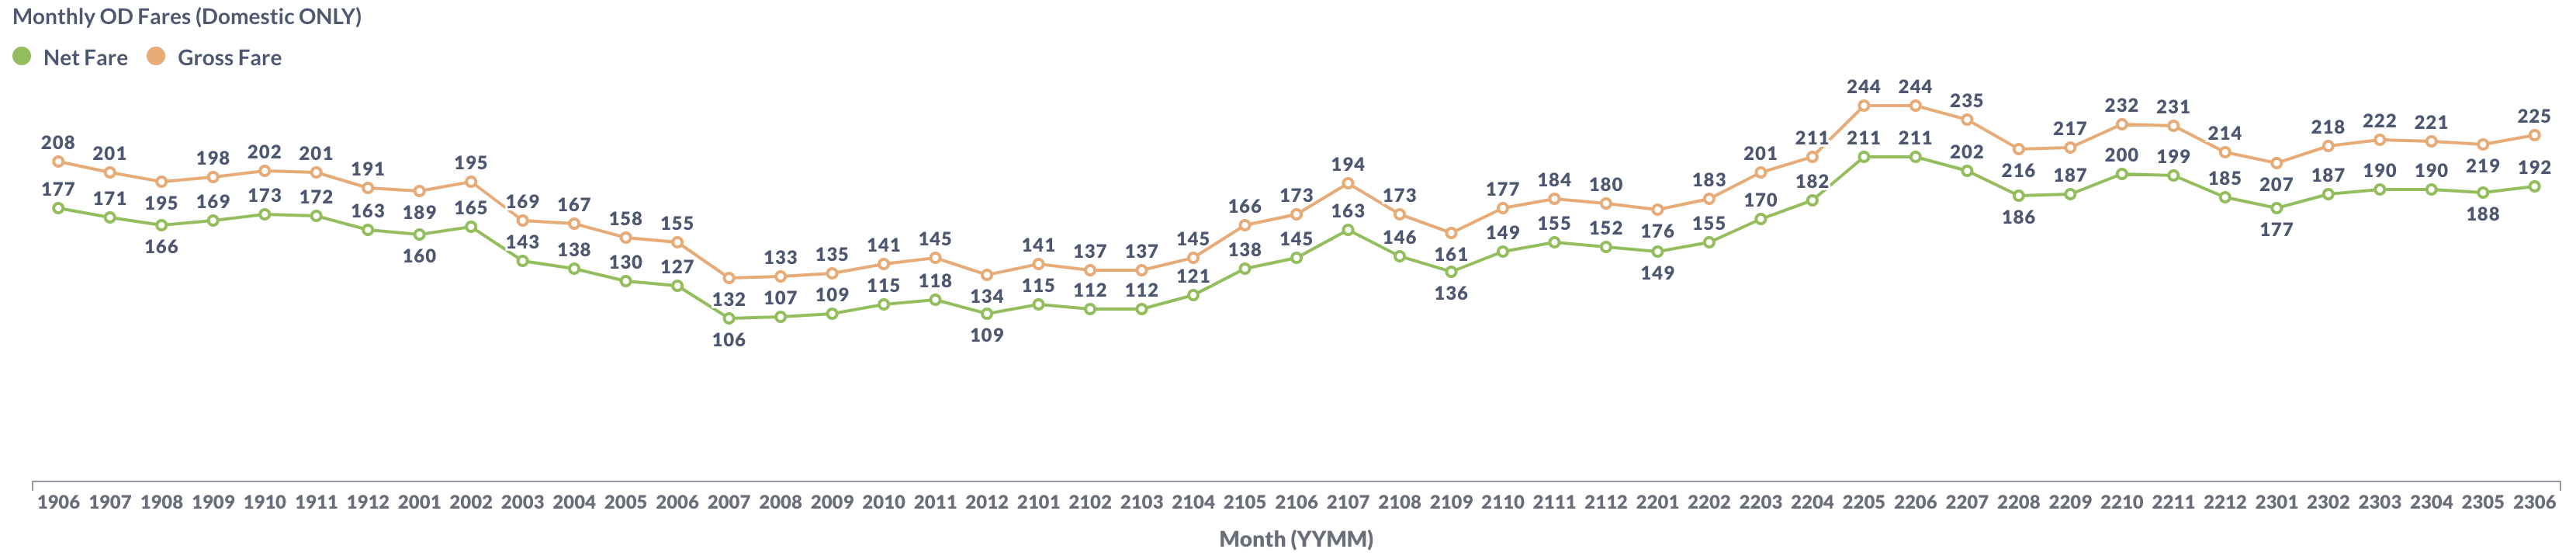
Figure 2: US Domestic Average Airfare by Month
There is an correlation between average airfare and jet fuel price. Data from the Energy Information Administration (EIA) indicates a small increase in jet fuel prices from May to June 2023, as shown in the chart below.
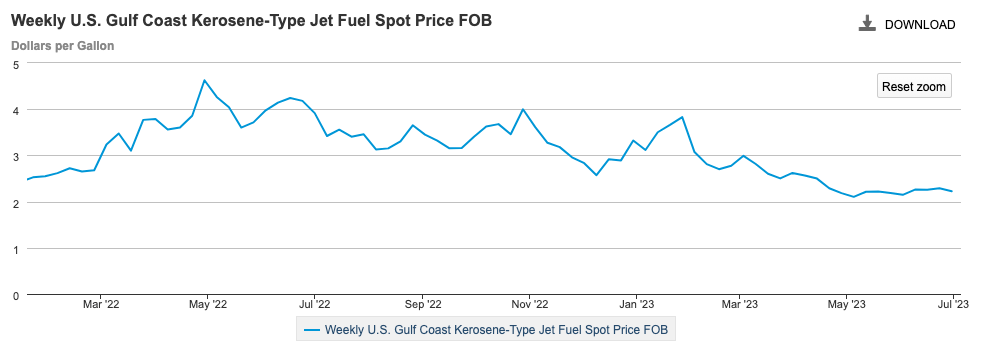
Figure 3: US Jet Fuel Price
Load Factor Trend
The average load factor of major US airlines in June improved to 83.0% from 82.8% recorded in May 2023, as illustrated in Figure 4 below. The load factor change is a mixed picture. Some airlines such as Delta (DL) and American (AA) improved their load factors from May 2023 to June 2023 while others such as Southwest (WN) and United (UA) saw an decline during the same period.
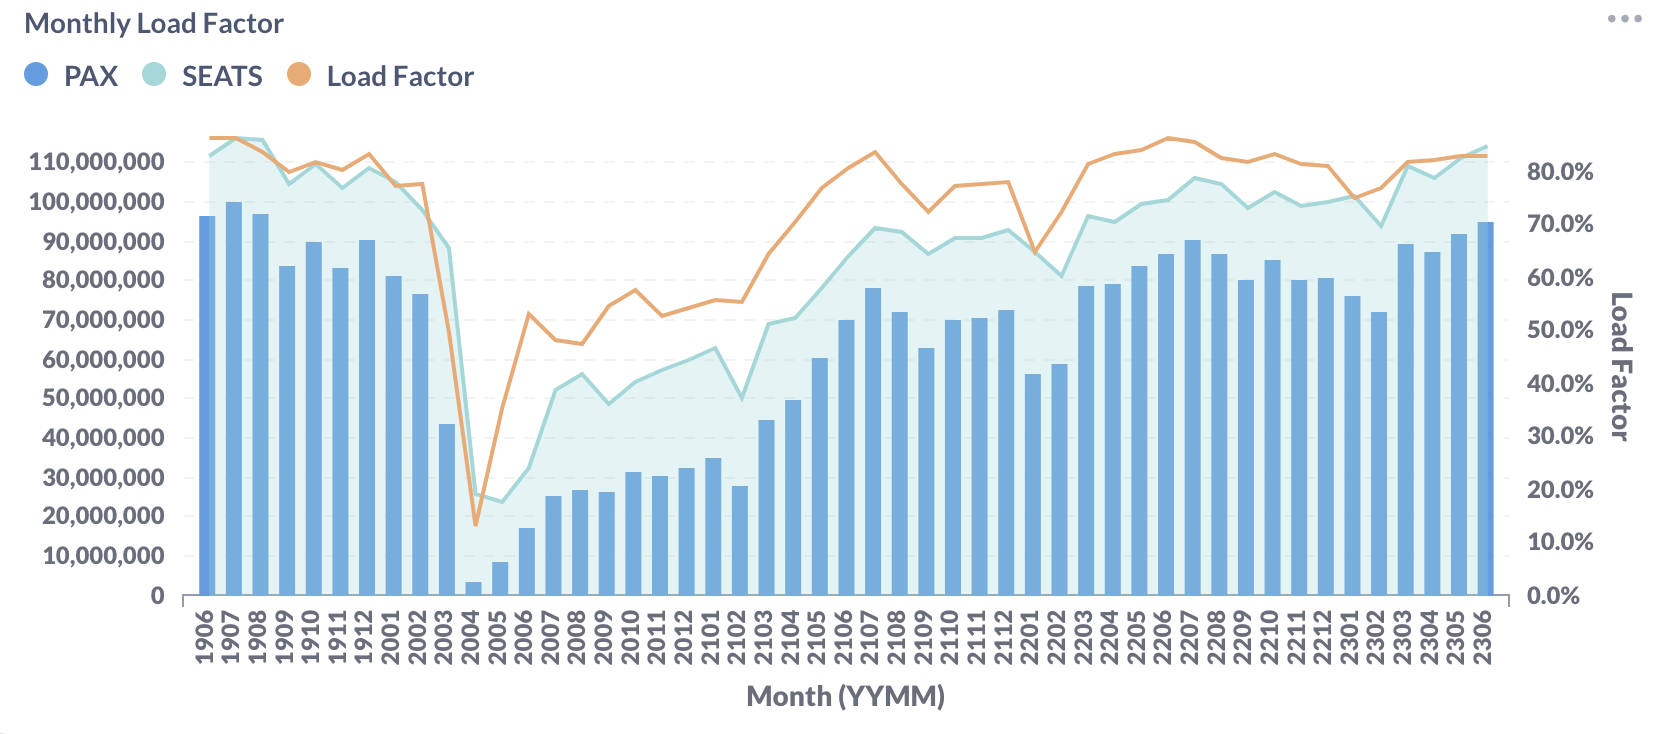
Figure 4: US Airlines’ Average Load Factor by Month
Month Over Month Comparison
Between May and June 2023, Allegiant Air (G4) had the biggest increase at 31.6%. American (AA), Delta (DL) and Alaska (AS) saw some growth in a range of 6.7% to 8.5%. But Spirit (NK) and Southwest (WN) observed a small dip in daily traffic during this period.
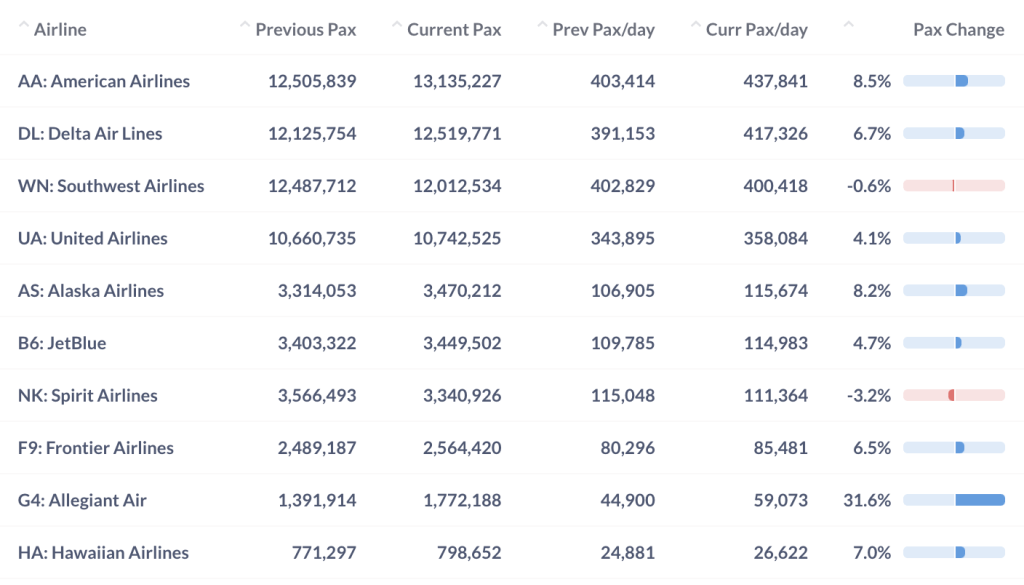
Figure 5: Air Traffic by Dominant Marketing Airlines in May 2023 (Previous) vs. June 2023 (Current)
In June 2023, many top airports registered an increase in daily passenger traffic compared to the previous month. Notably, Seattle (SEA) and San Francisco (SFO) led the month-to-month growth with a 17.6% and 13.9% surge in daily traffic. Phoenix (PHX), Orlando (MCO) and Las Vegas (LAS) experienced some decrease from the previous month.
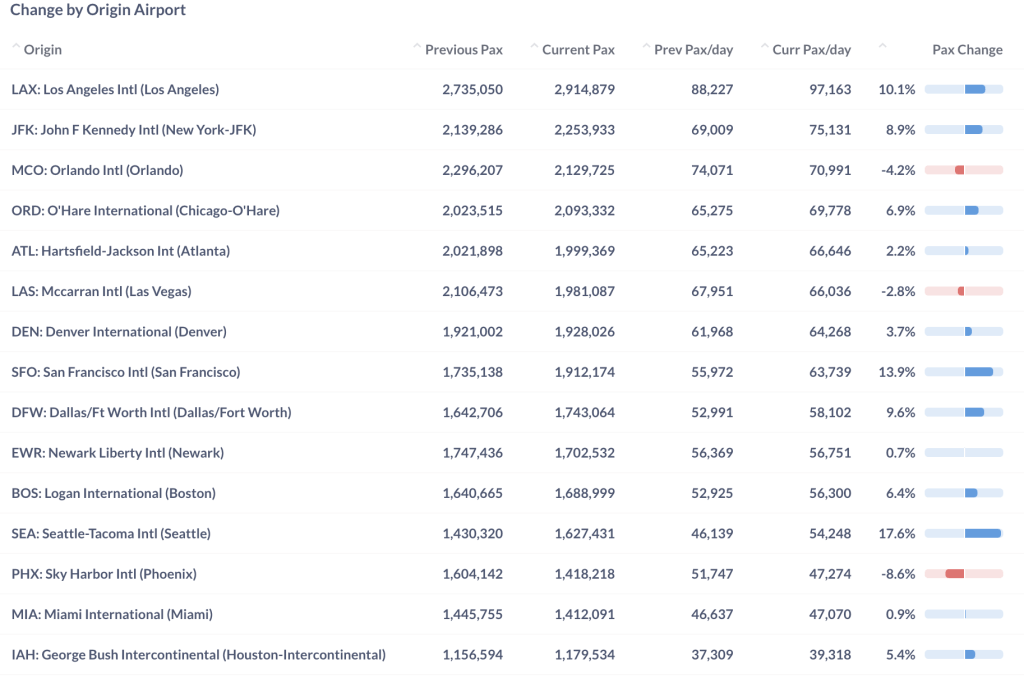
Figure 6: Air Traffic by Top Origin Airports in May 2023 (Previous) vs. June 2023 (Current)
Year Over Year Comparison
In a year-over-year comparison with June 2022, all prominent US airlines recorded positive growth. Notably, Frontier (F9), Delta (DL) and United (UA) led year-over-year growth with 26.8%, 20.2% and 20.1%, respectively, thereby leading the growth trajectory among the major US airlines.
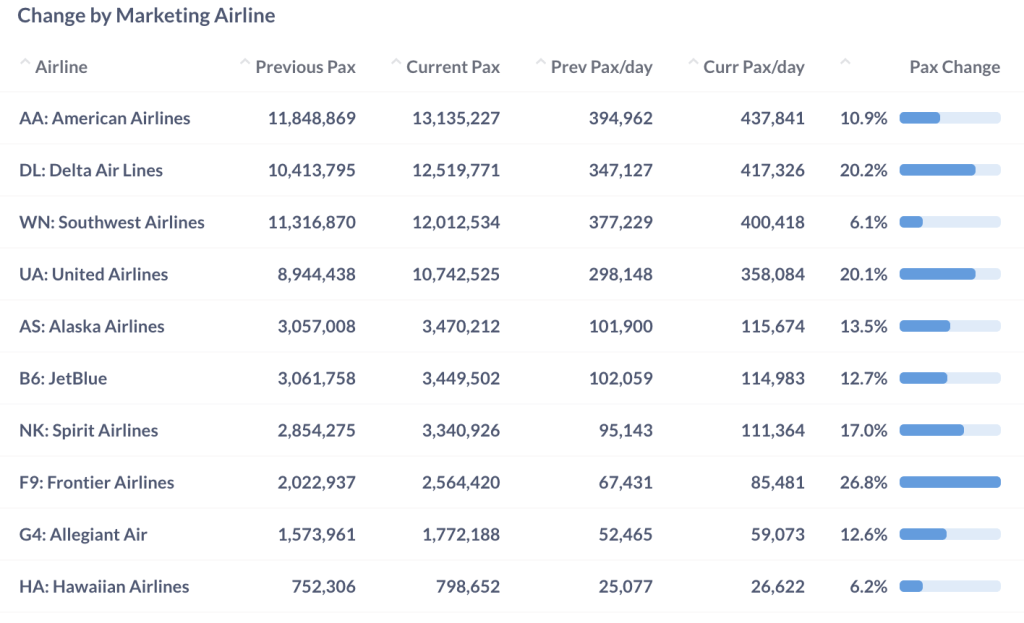
Figure 7: Air Traffic by Dominant Marketing Airlines in June 2023 (Current) vs. June 2022 (Previous)
Between June 2022 and June 2023, the top airports exhibited impressive growth, recording an increase from 10.3% to 26.7%. Particularly, San Francisco International Airport (SFO) and John F. Kennedy International Airport in New York (JFK) spearheaded the year-over-year growth, boasting substantial increases of 26.7% and 26.3% respectively.
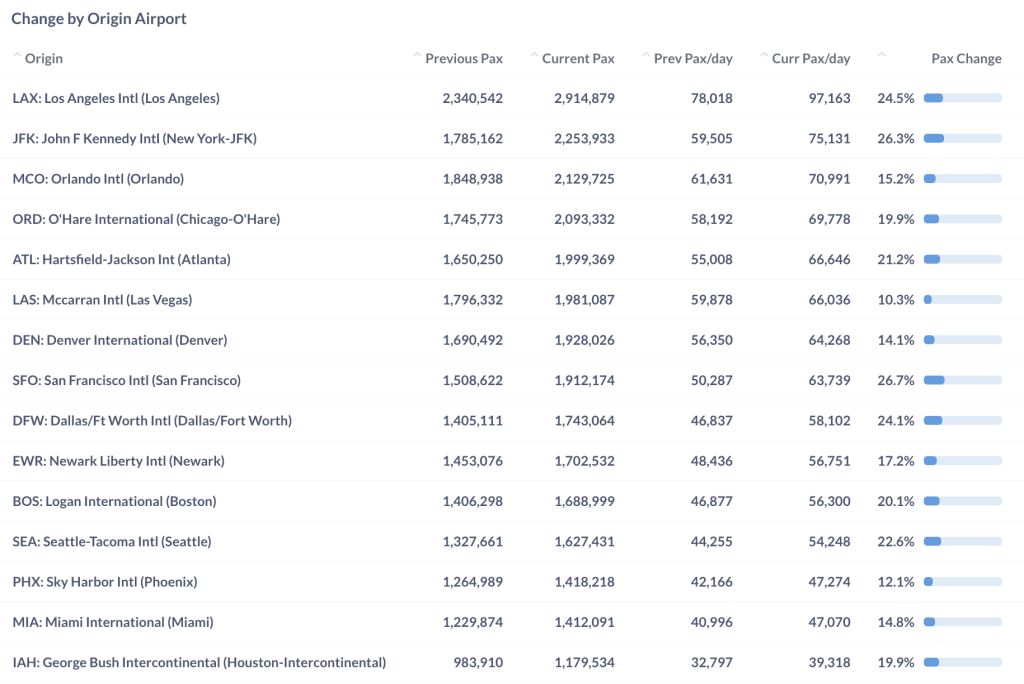
Figure 8: Air Traffic by Top Origin Airport in June 2023 (Current) vs. June 2022 (Previous)
For more detailed information on traffic and fares by route and airline, please contact service@flightbi.com or request a demo of Fligence USOD. They will be able to provide you with customized information to meet your specific needs and requirements.