The US BizAv (Business Aviation) market has been booming since March 2021. This series of articles track the traffic trend of this market. We define the BizAv market as part-135 on-demand for-hire private flying by business jets or certain turboprop planes. The numbers in the following charts exclude part-91 private flights. If you are interested in all flights by business jets, or detailed flights by route and operator, please get in touch with us.
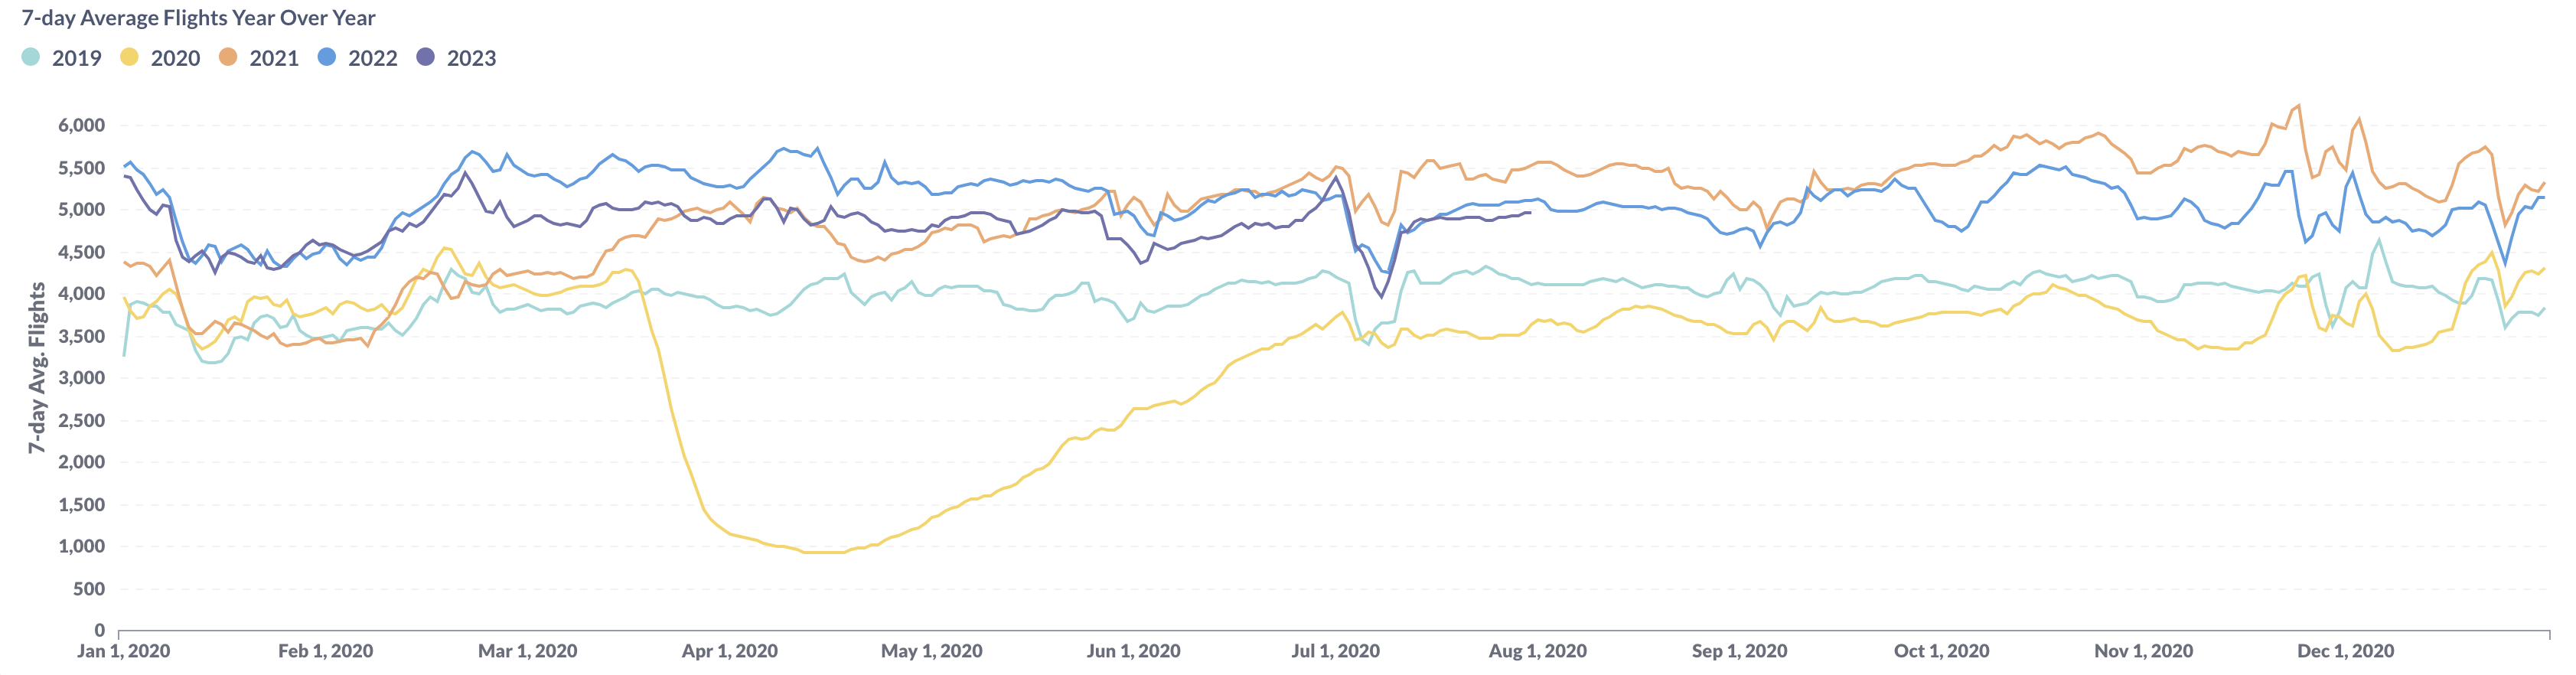
Figure 1: Year over Year Trend of the U.S. BizAv Market
Figure 1 graphically portrays U.S. BizAv traffic for July 2023, indicating that, it followed the pattern of the previous year but did not meet the levels observed in 2022 at the end of the month. Notably, there was a surge before the July 4th holiday and a dip after. Then, the traffic level become stable.
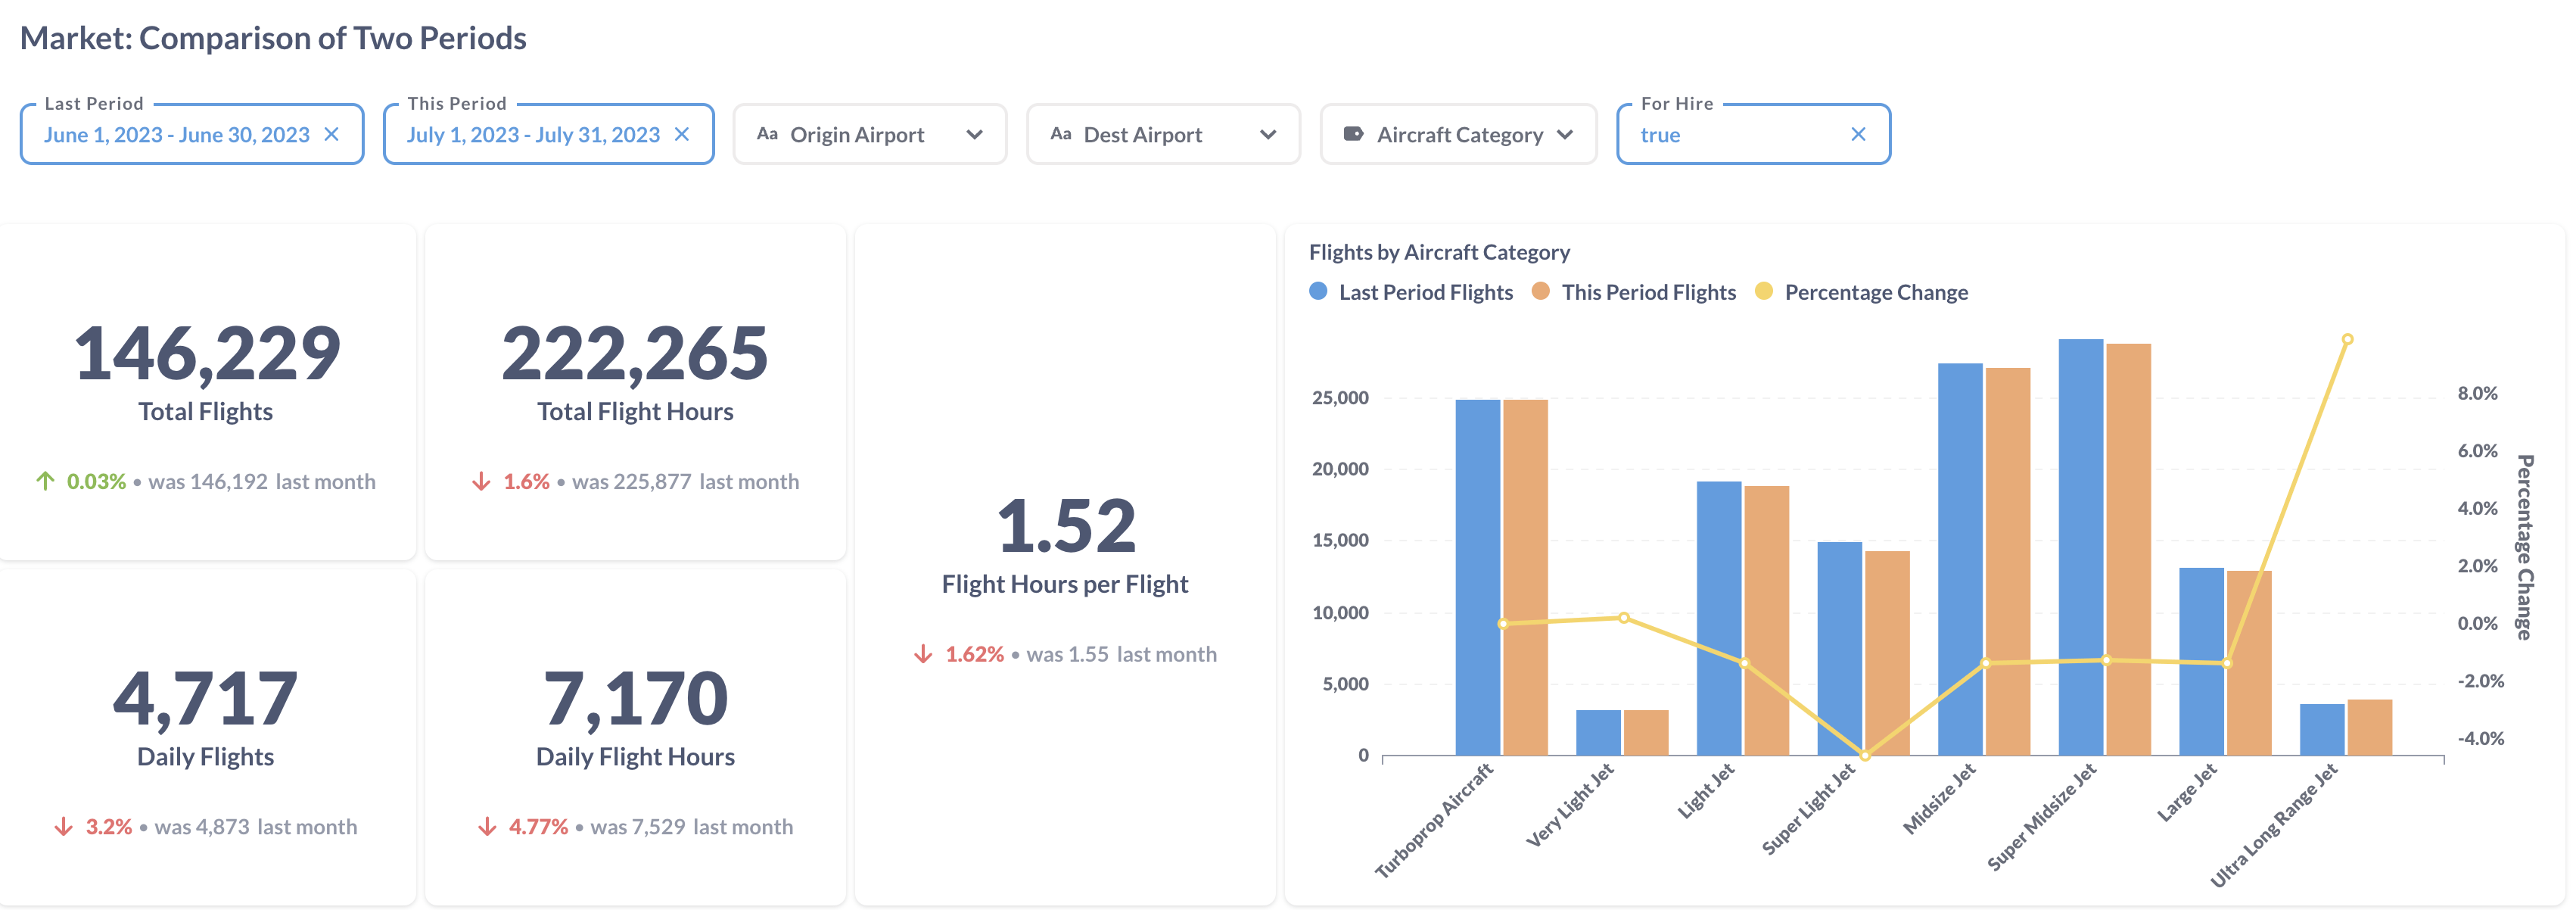
Figure 2: Comparison of the U.S. BizAv Flights This Month vs. Last Month
Figure 2 presents a comparative analysis of flight data between July 2023 and June 2023, emphasizing a decrease in both the number of daily flights and daily flight hours. However, the total number of flights observed an increment due to July having one more day than June. The alterations in the quantity of flights categorized by aircraft type present a diverse scenario. Ultra Long Range Jet witnessed a rise in numbers, while the remaining categories, kept the same or registered a decrease.
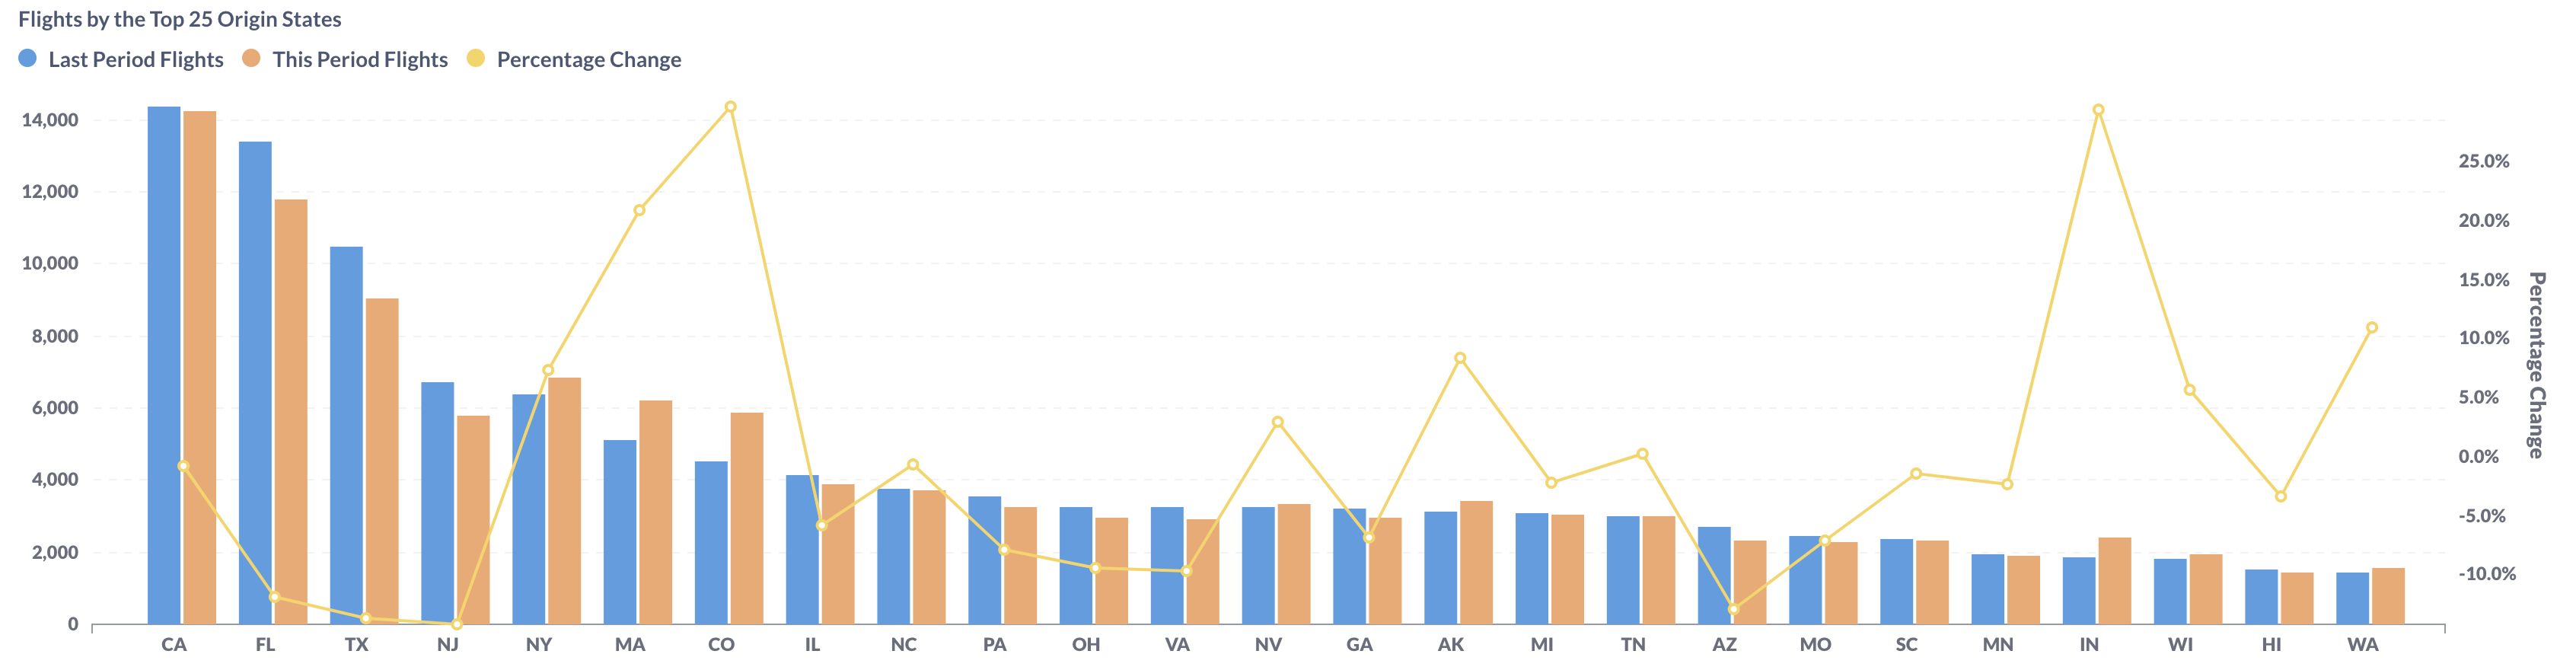
Figure 3: Comparison of the U.S. BizAv Flights by the Top 25 Origin States (This Month vs. Last Month)
Between July and June 2023, flight patterns varied across different U.S. states, with some states experiencing a rise in flight numbers, while others saw a decrease. The most substantial reductions were noted in large states including Florida (FL), Texas (TX) and New Jersey (NJ). California (CA) retained its title as the state with the highest number of originating flights. Meanwhile, New York (NY), Massachusetts (MA), and Colorado (CO) observed some significant growth in their flight numbers.
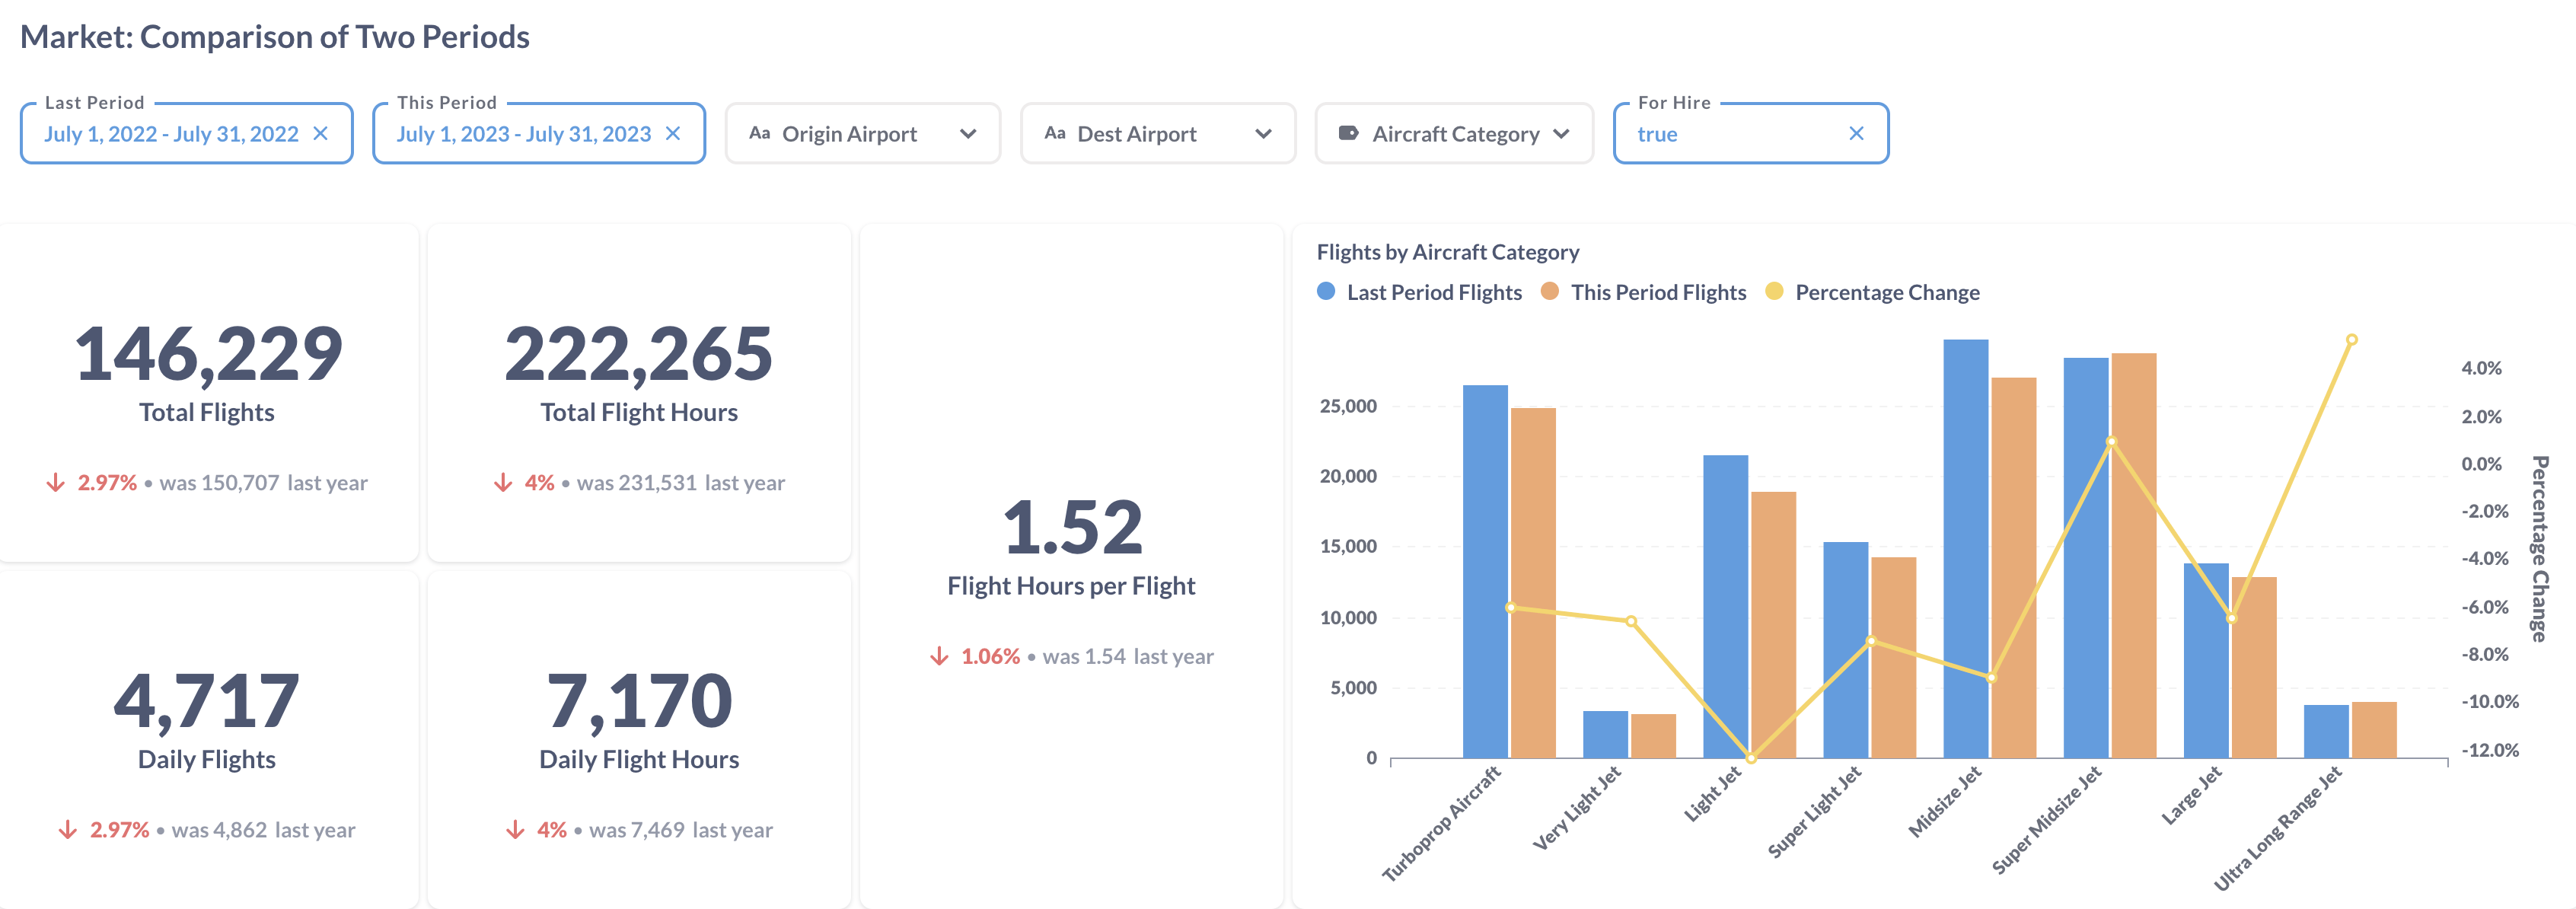
Figure 4: Comparison of the U.S. BizAv Flights This Year vs. Last Year
Compared to July 2022, the total number of business flights in July 2023 experienced a decrease of 2.97%. There was also a 4% reduction in total flight hours, a trend that can be attributed to a 1.06% contraction in the average flight hours per flight. All aircraft categories except Ultra Long Range Jet and Super Midsize Jet registered a decline in the number of flights. The most significant reduction was witnessed within the Light Jet category.

Figure 5: Comparison of the U.S. BizAv Flights by the Top 25 Origin States (This Year vs. Last Year)
Upon comparing flight data from July 2022 to July 2023, a downward trend in the number of flights is discernible across most U.S. states. Despite experiencing an 7.5% year-over-year decrease, California (CA) led in July 2023 as the state with the highest number of originating flights. This was followed by Florida (FL) and Texas (TX), establishing them as the states with the second and third highest number of departures, respectively.