Daily and hourly airport traffic is crucial for businesses related to airports, including airport authorities, airlines, retailers, ground handlers, rental car companies, and hotels. If you belong to any of these industries, utilizing daily airport traffic data can help you plan your operations, schedule your resources, forecast revenue, and plan budgets more accurately. Additionally, this data can help you target your marketing and promotional efforts more specifically, leading to more effective business strategies.
FlightBI collects and normalizes the airport passenger throughput data from US Transportation Security Administration (TSA). In addition, it has developed a product called Fligence TSA, which features a wide variety of data visualizations. FlightBI is currently offering a two-week, no-obligation trial of Fligence TSA for you to explore valuable insights from the airport traffic data.
This article summarizes US air traffic using the aforementioned tool, utilizing actual airport-level data as of Jul 31, 2023. Our analysis will examine trends in different segments of air travel, such as domestic versus international flights and leisure versus business travel. To learn more about the specific airports chosen to represent these markets, please refer to this article.
US Overall Airport Traffic Status
As depicted in Figure 1, US air traffic has successfully recovered to pre-pandemic levels. The current total volume aligns with 2019 levels, which serves as the most recent benchmark of normalcy before the COVID-19 pandemic. Given these trends, we project that total air traffic for the upcoming three months will maintain consistency with the levels experienced in 2019.
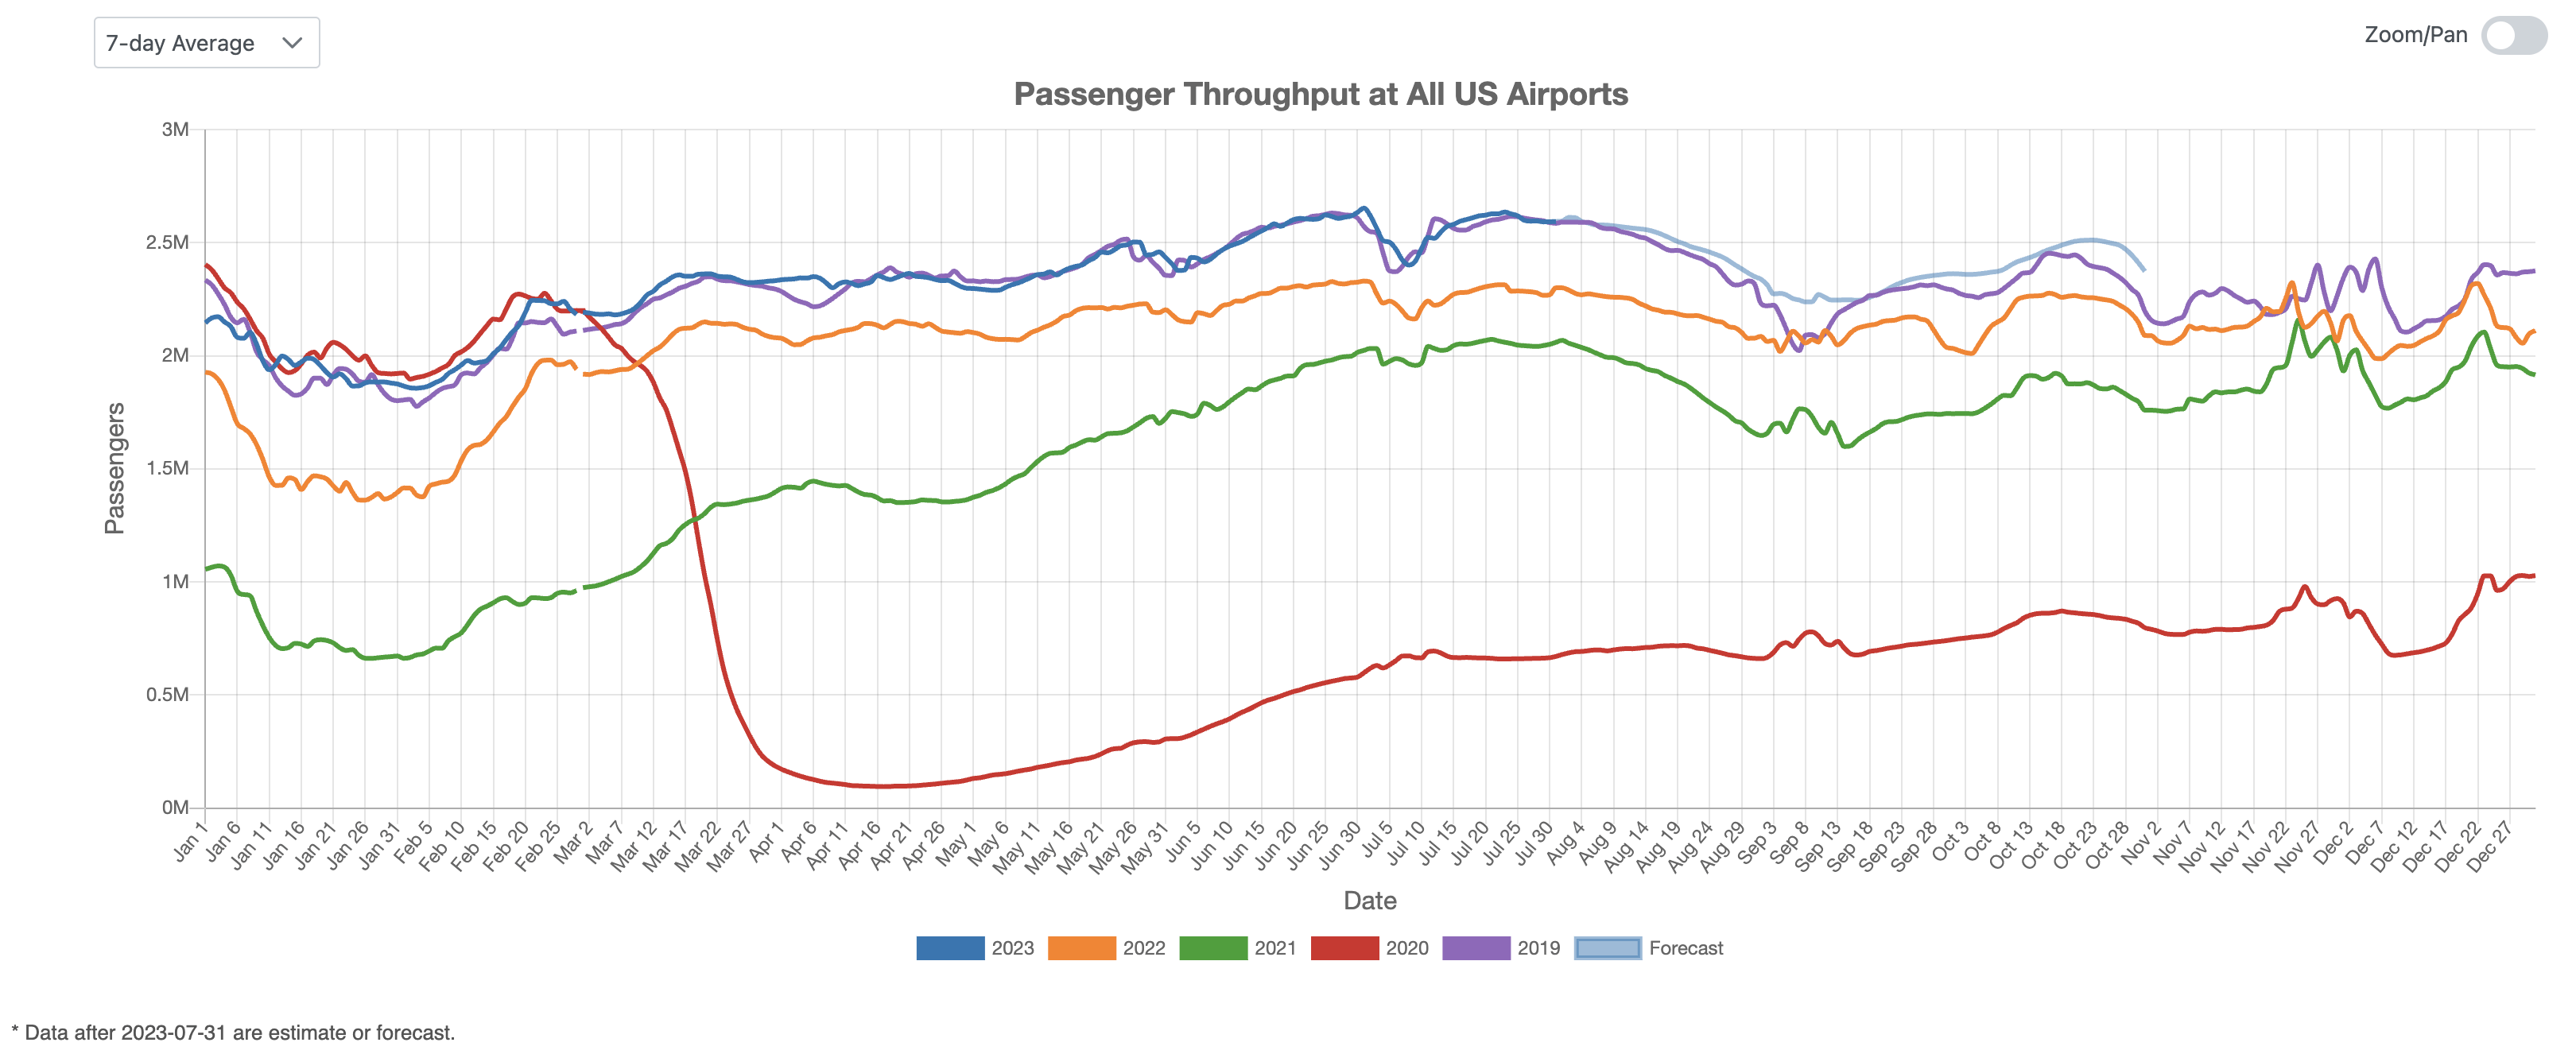
Figure 1: US Overall Air Traffic Trend
Domestic Airport Traffic Indicator
Figure 2 displays the index of domestic air traffic in the United States, indicating a notable rise above pre-pandemic levels. This graph suggests a pronounced surge in air travel after the Fourth of July holiday, likely attributable to increased travel plans during this summer.
In terms of future trends, it is projected that the volume of domestic flights will experience a decline until September, which aligns with trends observed in previous years. But the demand after September will likely be strong.
Overall, the forecast for the coming period anticipates a potential escalation in air travel, with an increase ranging between 5% and 10% above the highest historical levels. This projection suggests a continuation of the recovery trend seen in domestic air traffic, signaling a return of passenger confidence in air travel amid the ongoing post-pandemic phase.
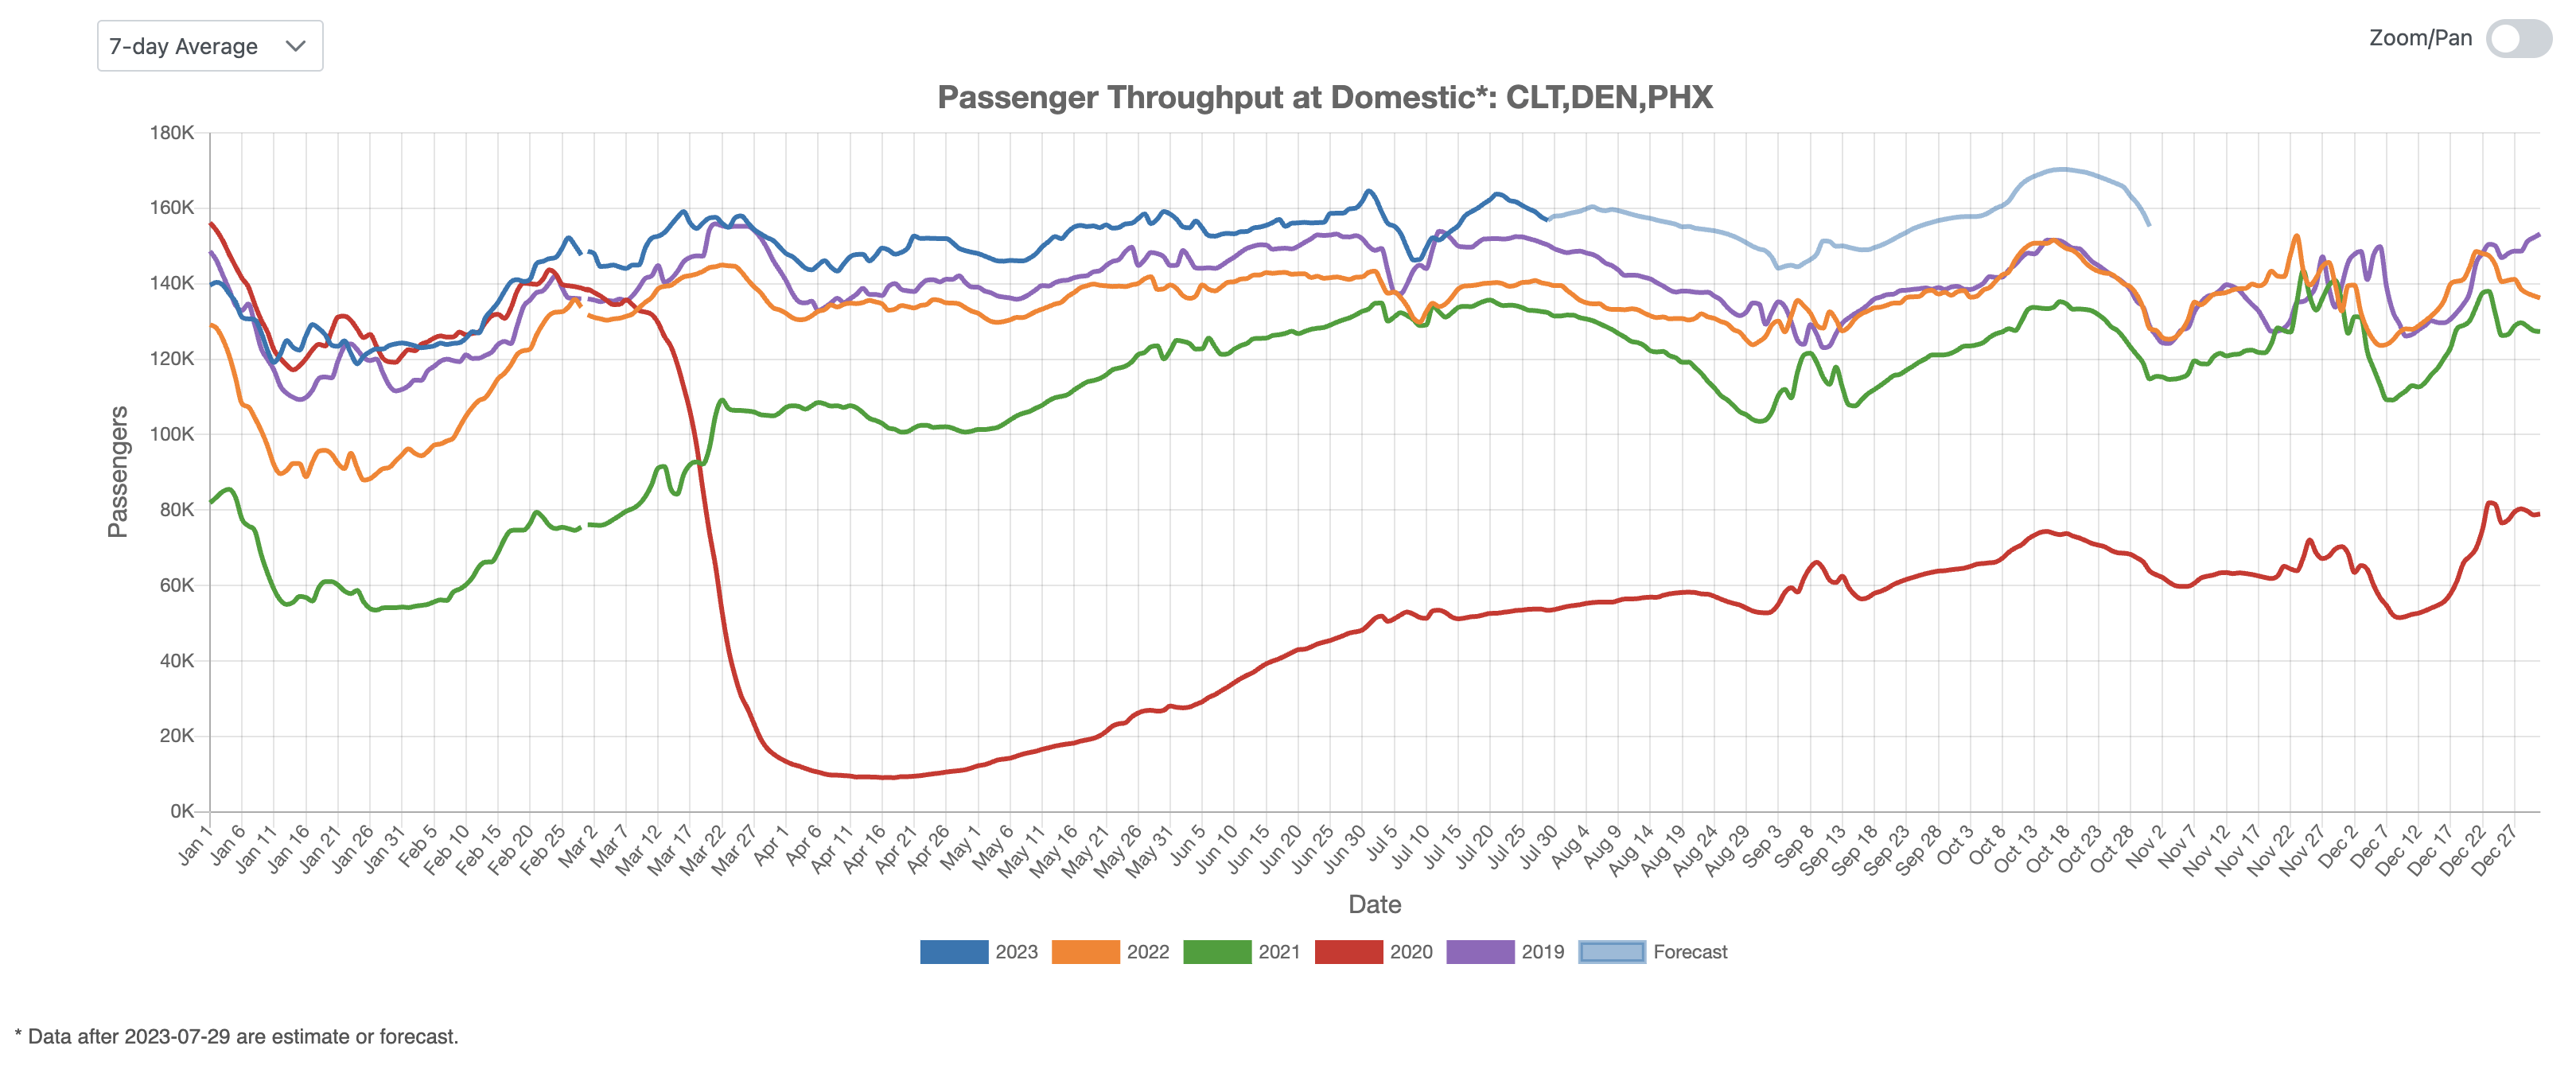
Figure 2: US Domestic Air Traffic Indicator
International Airport Traffic Indicator
Figure 3 illustrates the index for international air traffic in the United States, showcasing a stable air traffic in July except a drop at the end of July. Over the subsequent three months, projections suggest that international traffic levels will remain below those recorded in 2019. However, the disparity between the 2023 and 2019 data points is anticipated to diminish in September. This implies a gradual recovery in international air travel, despite it lagging behind the 2019 benchmark, signifying promising prospects for the industry’s future resilience.

Figure 3: US International Air Traffic Indicator
Leisure Air Traffic Indicator
In July, the leisure air travel sector continued its robust performance. As Figure 4 demonstrates, the volume of leisure air traffic in 2023 has surpassed the levels seen in both 2019 and 2022 by a margin exceeding 10%. Looking forward, we predict this trend of strong year-over-year growth, with rates exceeding 10%, to sustain until September. This ongoing uptick reflects the resilience of the leisure air travel market, with growth expected to remain steady in the coming months.
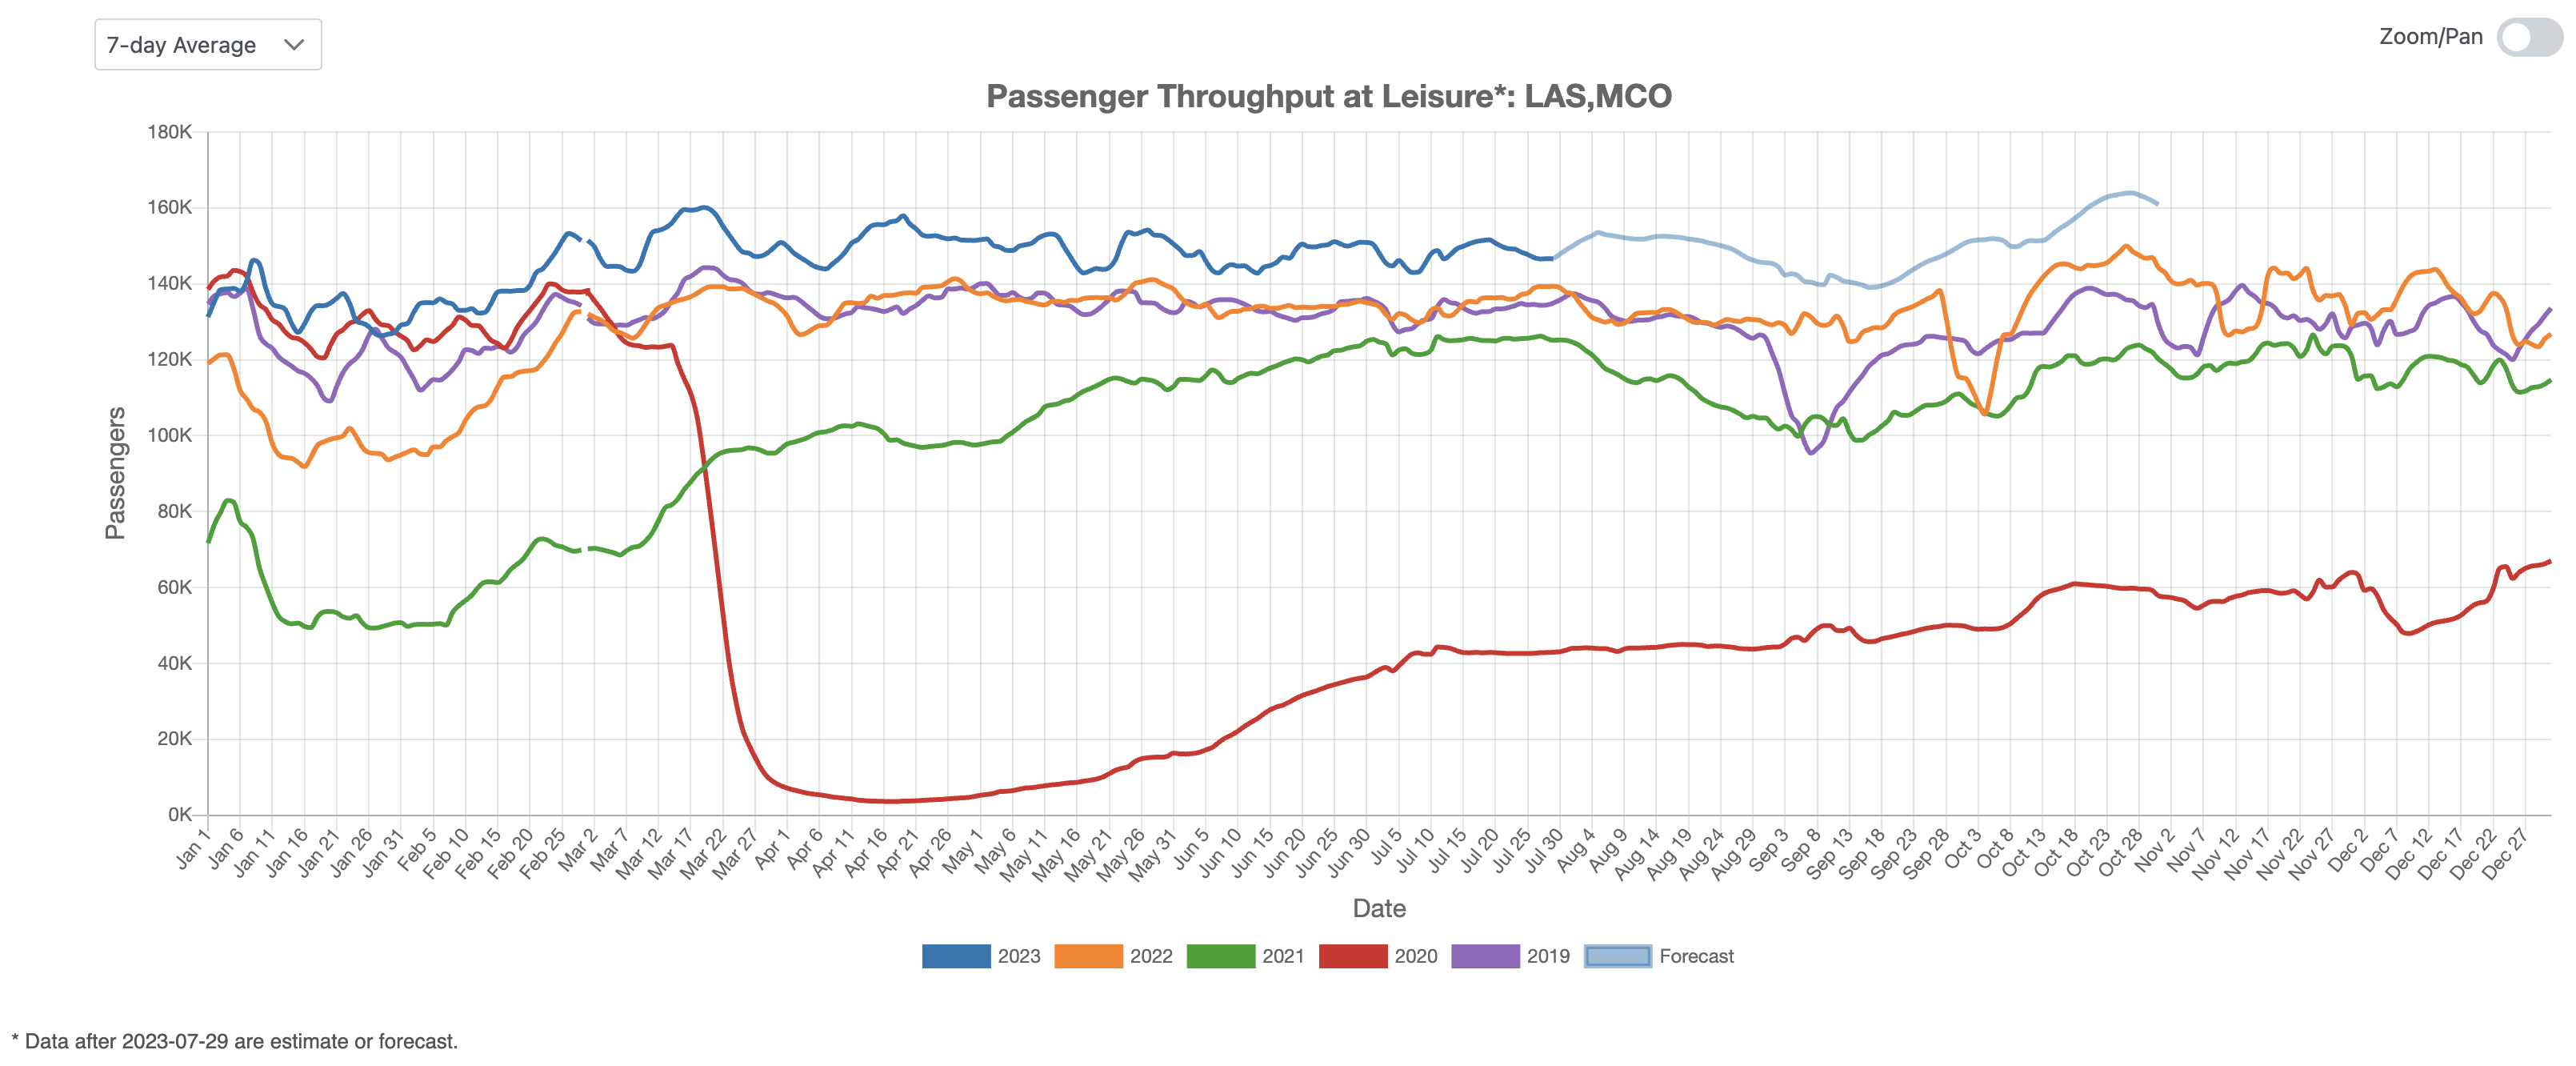
Figure 4: US Leisure Air Traffic Indicator
Business Air Traffic Indicator
Turning our attention to business-related air travel, Figure 5 depicts a notable development in June, where the 2023 trend line converged with the levels recorded in 2019. Projections indicate that business air traffic is poised to following the historic trend and potentially exceeding prior historical highs. This trend underscores a positive outlook for the recovery of the business travel sector, pointing towards a potential exceed pre-pandemic levels.
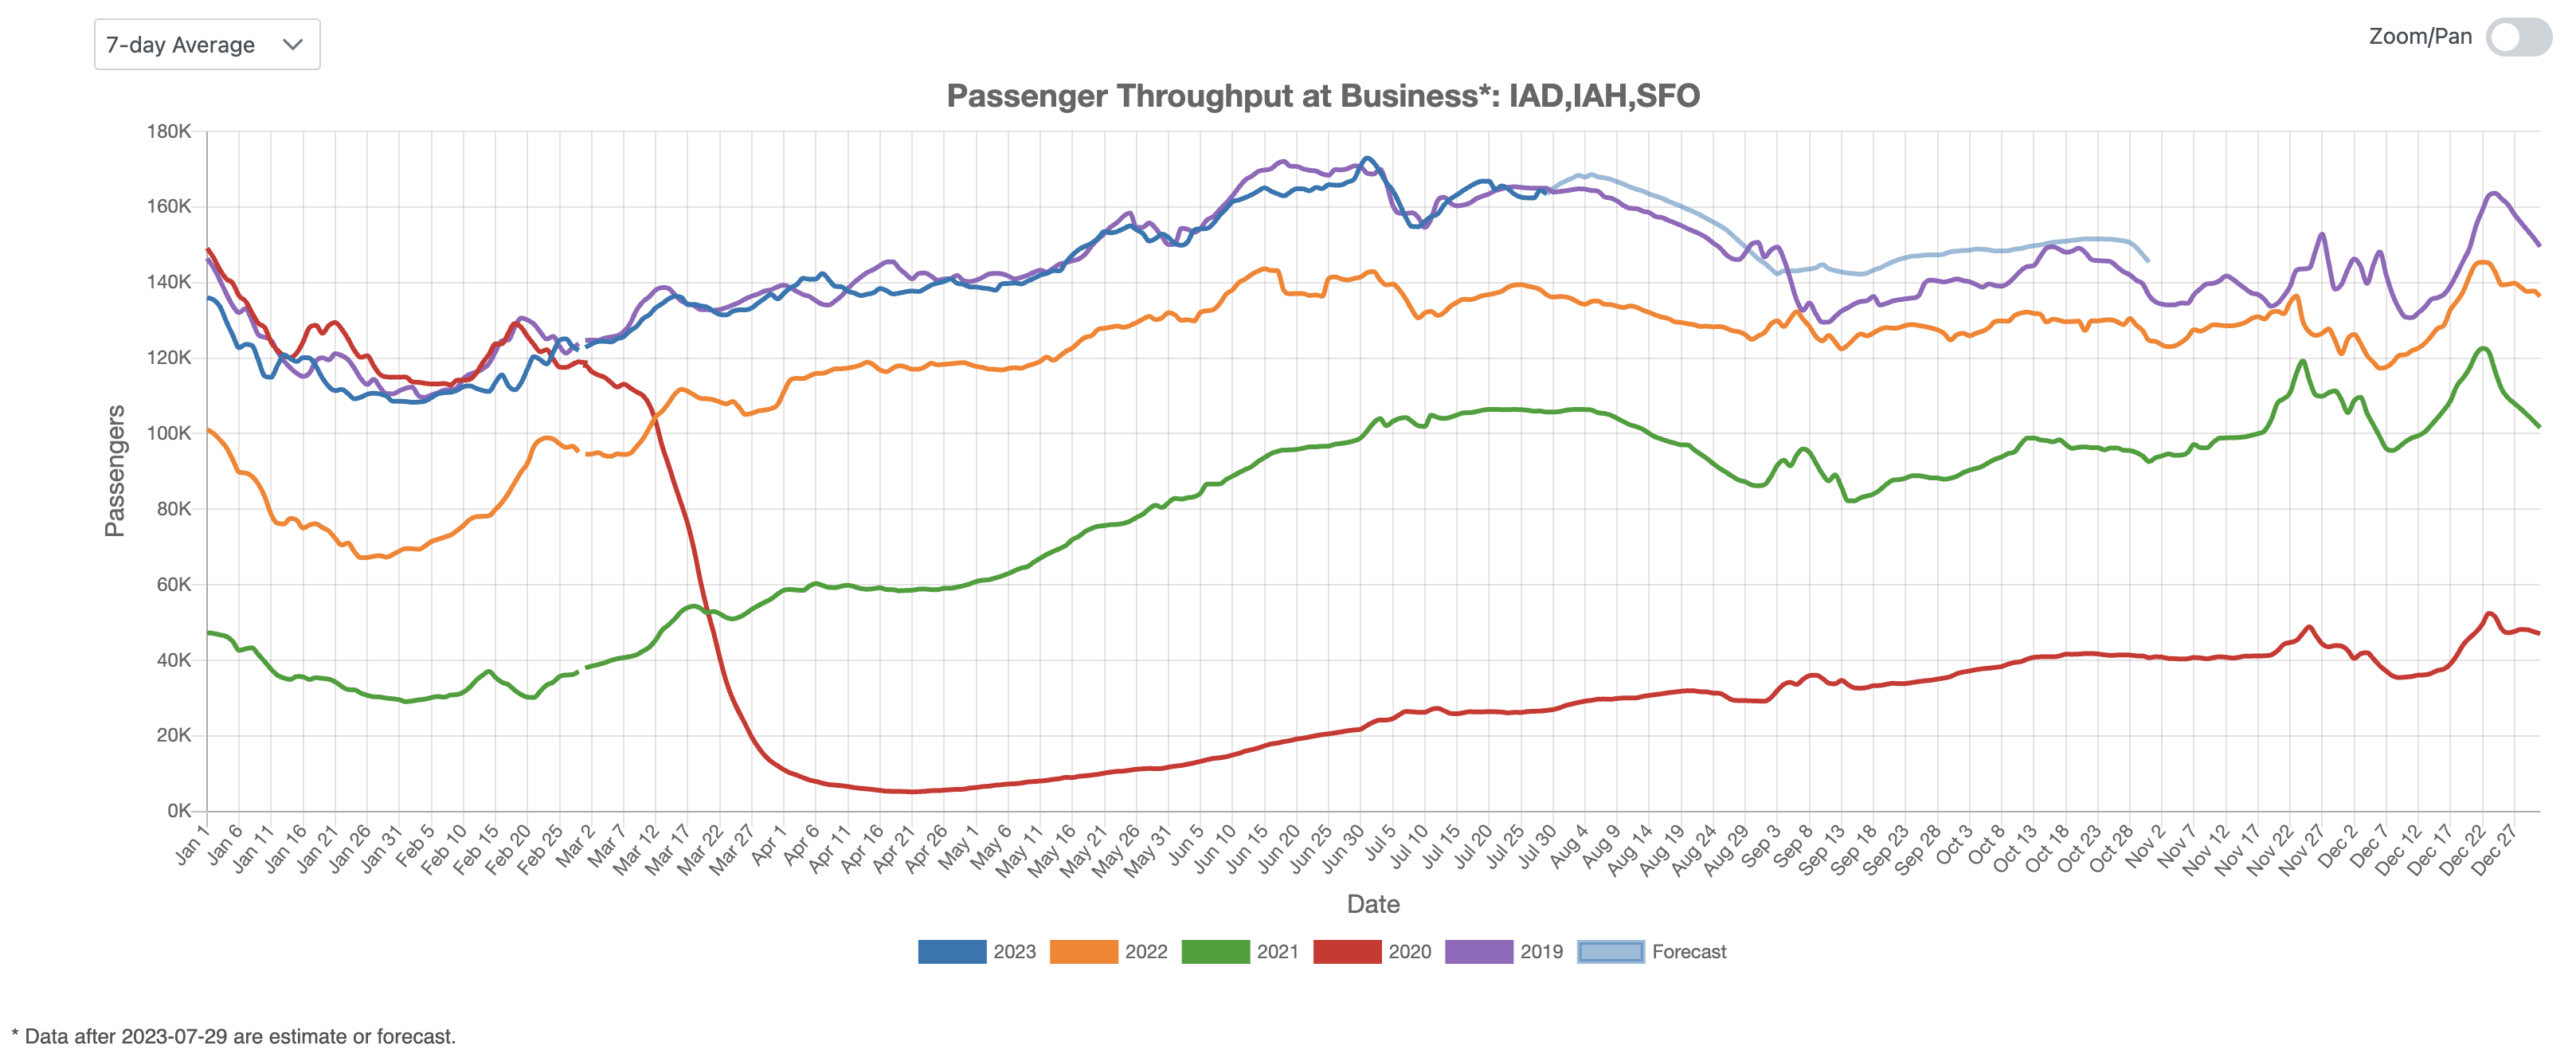
Figure 5: US Business Air Traffic Indicator
U.S. air traffic data reveals a strong recovery trajectory across domestic, international, leisure, and business sectors in 2023. Domestic and leisure traffic have notably surpassed pre-pandemic levels, with leisure travel showing over 10% growth. While international traffic still trails 2019 levels, it’s closing the gap. Business travel, mirroring 2019 levels, is expected to reach new highs.