The US BizAv (Business Aviation) market has been booming since March 2021. This series of articles track the traffic trend of this market. We define the BizAv market as part-135 on-demand for-hire private flying by business jets or certain turboprop planes. The numbers in the following charts exclude part-91 private flights. If you are interested in all flights by business jets, or detailed flights by route and operator, please get in touch with us.
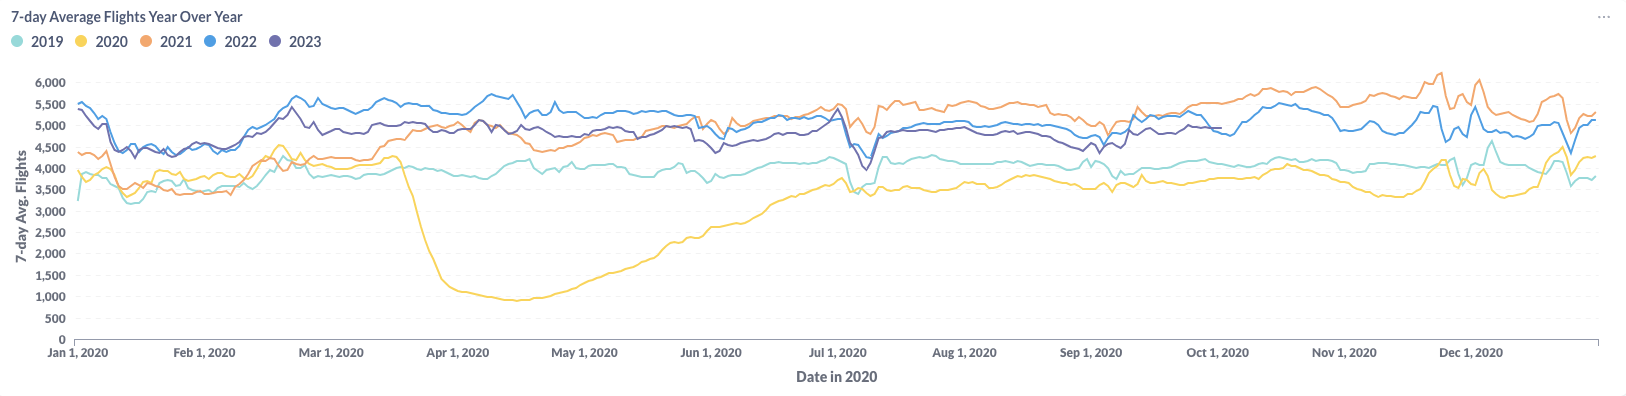
Figure 1: Year over Year Trend of the U.S. BizAv Market
Figure 1 visually represents U.S. BizAv traffic from January 2020 to September 2023. After a dip in traffic during the end of August, the overall U.S. BizAv market is now showing signs of stabilization. As of the end of September 2023, the number of 7-day average flights has surpassed the 2022 levels, although the current volume remains 10% below the record-high observed in 2021.
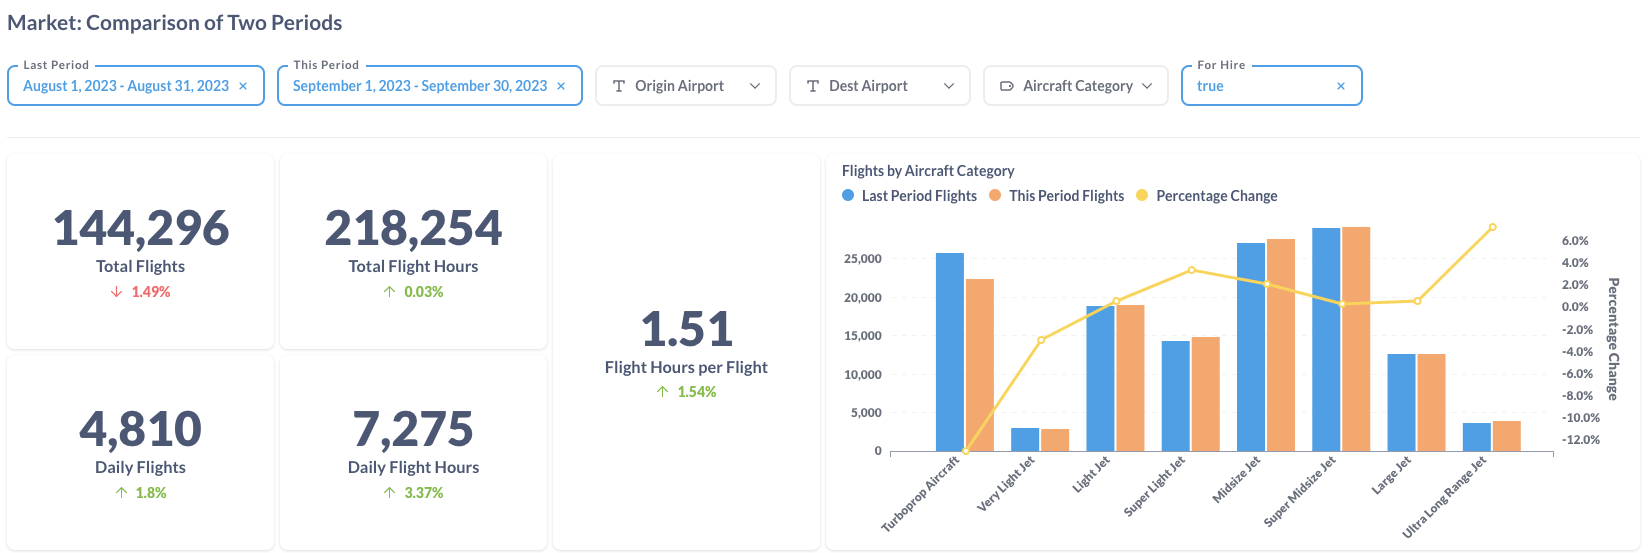
Figure 2: Comparison of the U.S. BizAv Flights This Month vs. Last Month
Figure 2 offers a side-by-side comparative of flight data between August 2023 and September 2023. During this period, while the total number of flights decreased by 1.5%, the total flight hours remained consistent. This is an encouraging sign, considering that September has one fewer day than August. There was a notable surge of flights by Ultra Long Range Jet, contributing to the 1.5% rise in hours per flight. Conversely, the number of flights by Turboprop saw a substantial decrease of 13% compared to the previous month.
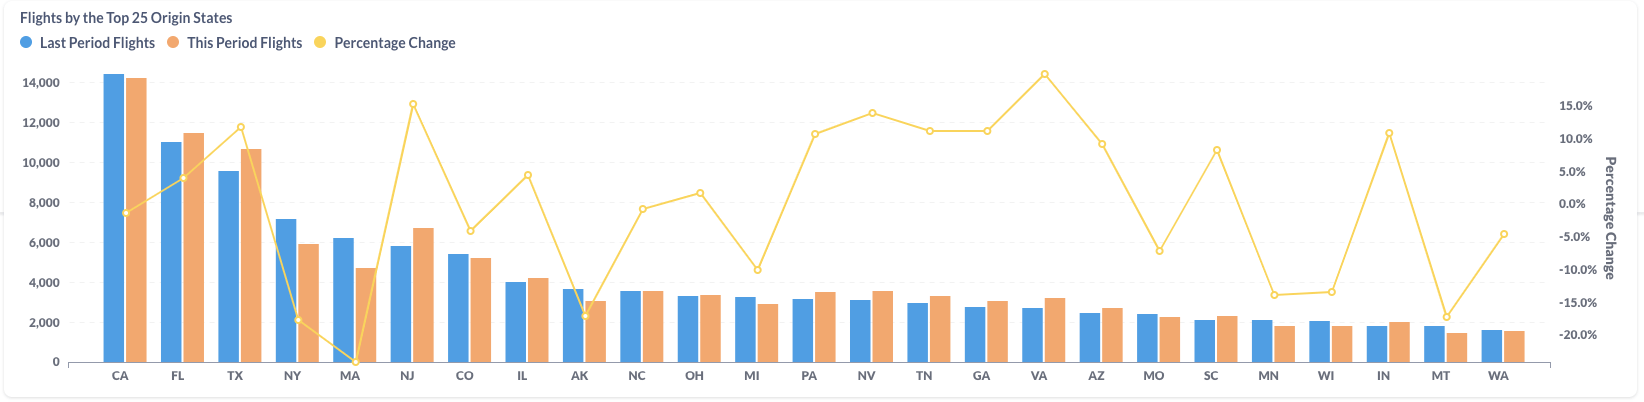
Figure 3: Comparison of the U.S. BizAv Flights by the Top 25 Origin States (This Month vs. Last Month)
From August to September 2023, flight trends diverged across U.S. states. Some states witnessed an increase in flight numbers, while others experienced a decline. Among the top origin states, California (CA), Now York (NY) and Massachusetts (MA) reported a decrease in flight activity while Florida (FL), Texas (TX) and New Jersey (NJ) registered growth.
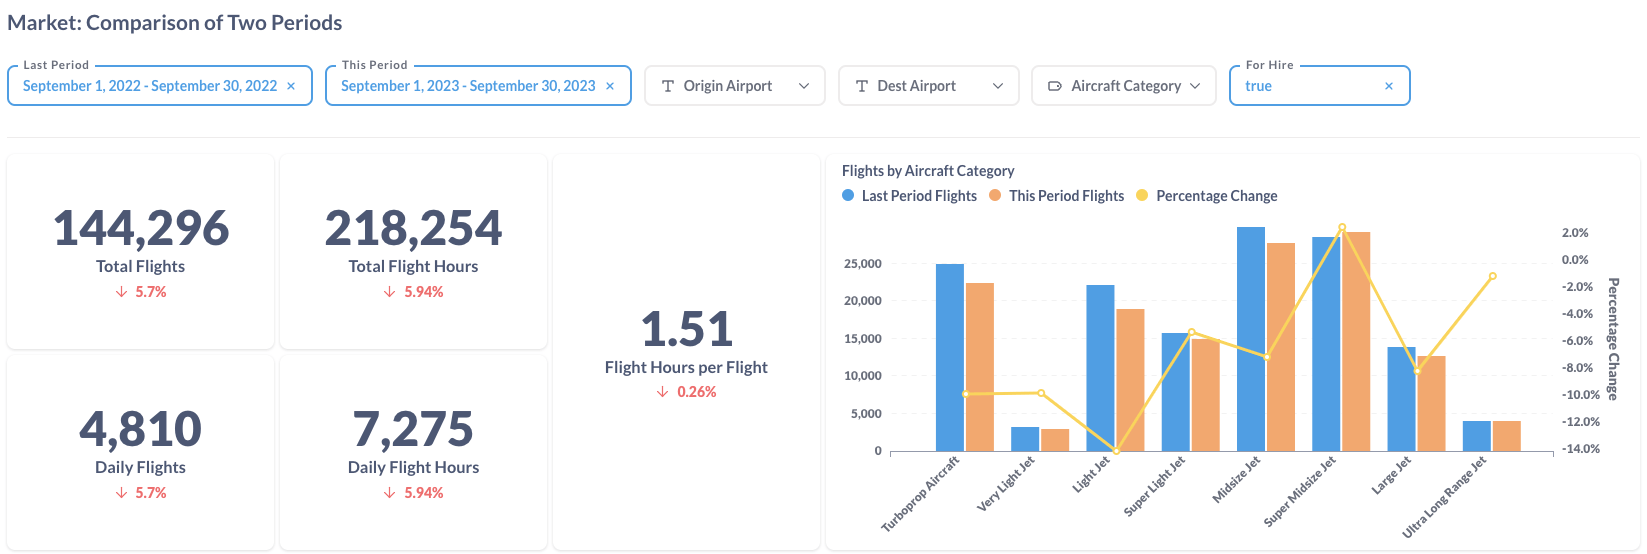
Figure 4: Comparison of the U.S. BizAv Flights This Year vs. Last Year
Compared to September 2022, the total number of business flights in September 2023 decreased by 5.7%. The reduction in total flight hours was even more pronounced at 5.9%, attributed to a contraction in the average hours per flight. While the majority of aircraft categories saw a decline, with the most notable decrease seen in Light Jets at 14.2%. However, Super Midsize Jet gained 2.4% as an exception.
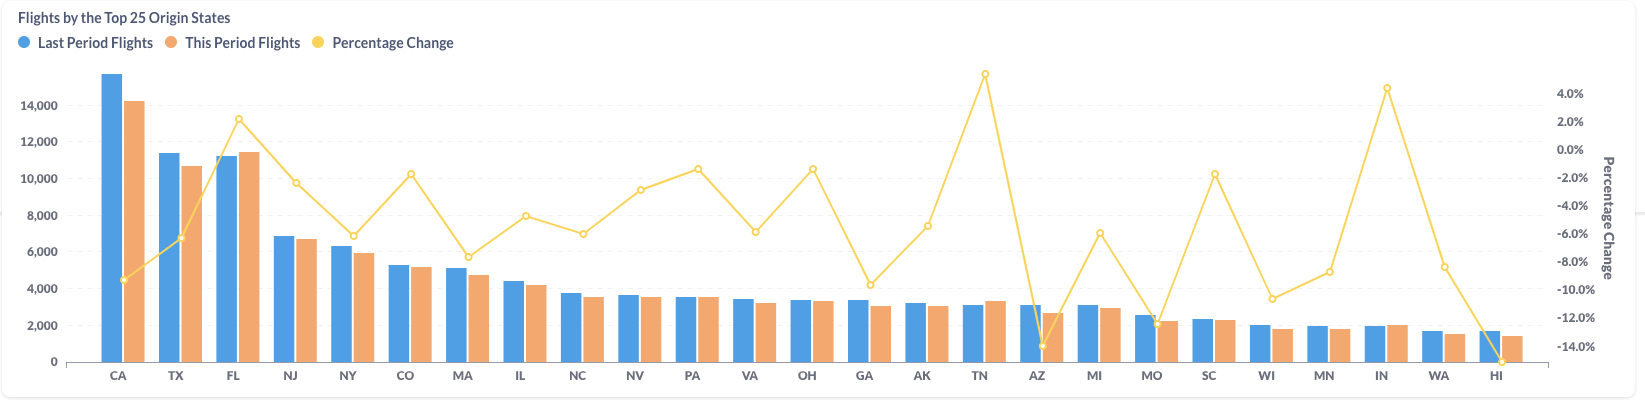
Figure 5: Comparison of the U.S. BizAv Flights by the Top 25 Origin States (This Year vs. Last Year)
When comparing flight data between September 2022 and September 2023, more states experienced a decline in flight numbers than those seeing an uptick. Despite a 9.2% year-over-year dip, California (CA) maintained its lead in September 2023 with the highest number of originating flights. Florida (FL) became the second place, achieving a 2.2% year-over-year growth, while Texas (TX) , which had a decline of 6.2%, placed the third in the ranking.