Daily and hourly airport traffic is crucial for businesses related to airports, including airport authorities, airlines, retailers, ground handlers, rental car companies, and hotels. If you belong to any of these industries, utilizing daily airport traffic data can help you plan your operations, schedule your resources, forecast revenue, and plan budgets more accurately. Additionally, this data can help you target your marketing and promotional efforts more specifically, leading to more effective business strategies.
FlightBI collects and normalizes the airport passenger throughput data from US Transportation Security Administration (TSA). In addition, it has developed a product called Fligence TSA, which features a wide variety of data visualizations. FlightBI is currently offering a two-week, no-obligation trial of Fligence TSA for you to explore valuable insights from the airport traffic data.
This article summarizes US air traffic using the aforementioned tool, utilizing actual airport-level data as of April 8, 2023. Our analysis will examine trends in different segments of air travel, such as domestic versus international flights and leisure versus business travel. To learn more about the specific airports chosen to represent these markets, please refer to this article.
US Overall Airport Traffic Status
As illustrated in Figure 1, US air traffic has rebounded to pre-COVID levels. In line with previous years, air traffic grew moderately from February to March. Total volume is currently slightly higher than the 2019 level. Based on these trends, we anticipate that total traffic over the next three months will remain consistent with the levels seen in 2019, which was the last full year of normal traffic prior to the COVID-19 pandemic.
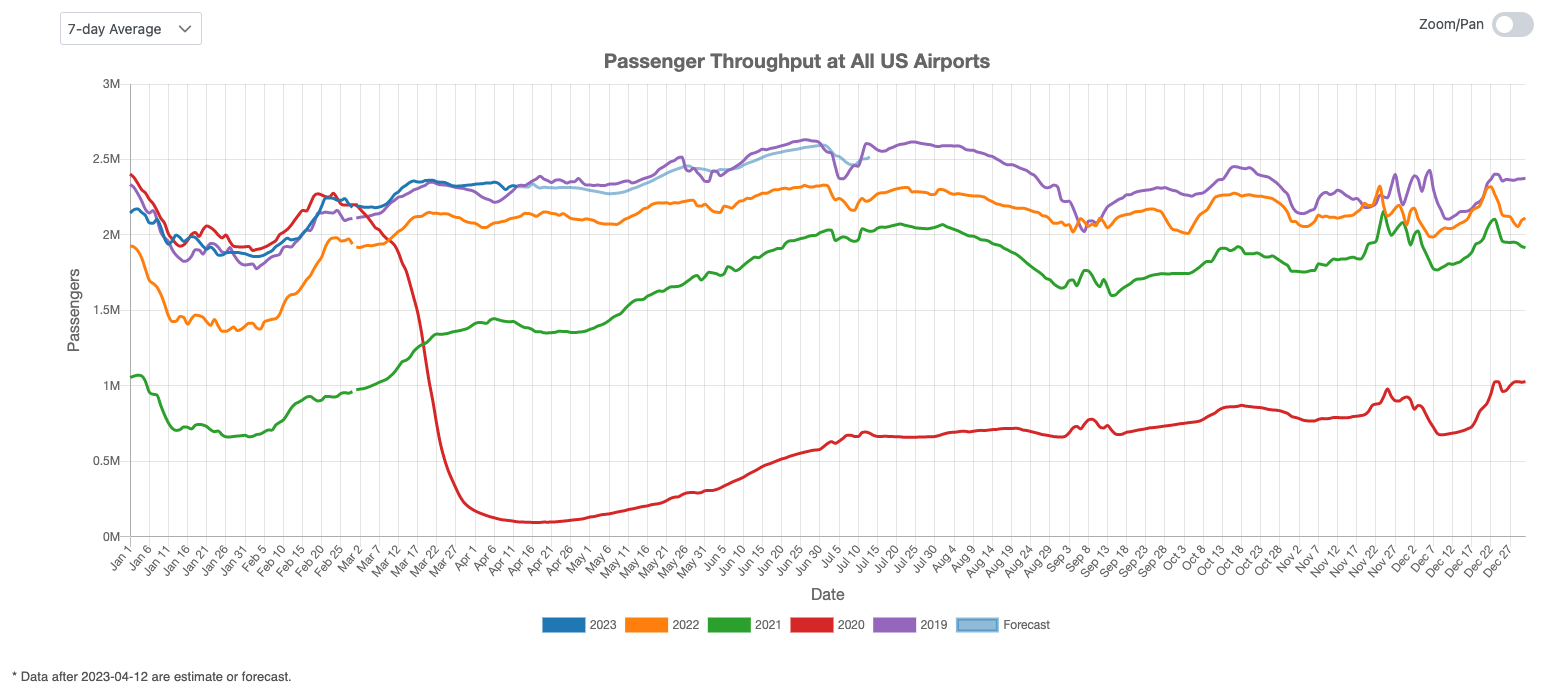
Figure 1: US Overall Air Traffic Trend
Domestic Airport Traffic Indicator
Figure 2 displays the US domestic air traffic indicator. As we all know, the COVID19 pandemic hit the US in March 2020. After three years, US domestic air traffic has fully recovered from the pandemic. Looking ahead, there is reason for optimism that domestic volume in the next three months exceeds the highest level in history.
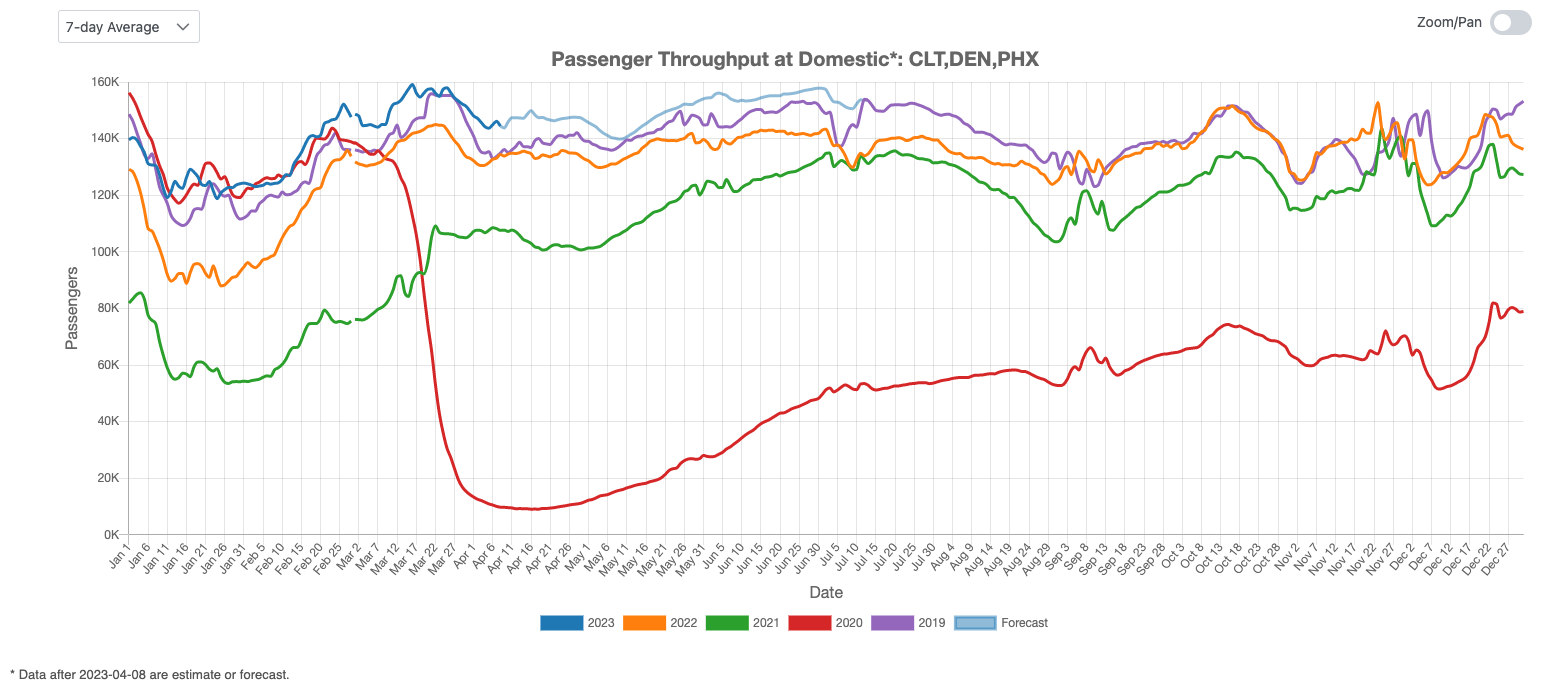
Figure 2: US Domestic Air Traffic Indicator
International Airport Traffic Indicator
Figure 3 depicts the US international traffic indicator. The 2023 curve for international traffic is catching up. Although the outbound traffic from the representative airport JFK is still below the 2019 level in most days of March, the 2023 curve and the 2019 curve have crossed at the end of March 2023. We expect to see multiple intersections of those two curves in the next several month, but the international traffic will exceed the historical high within this year.
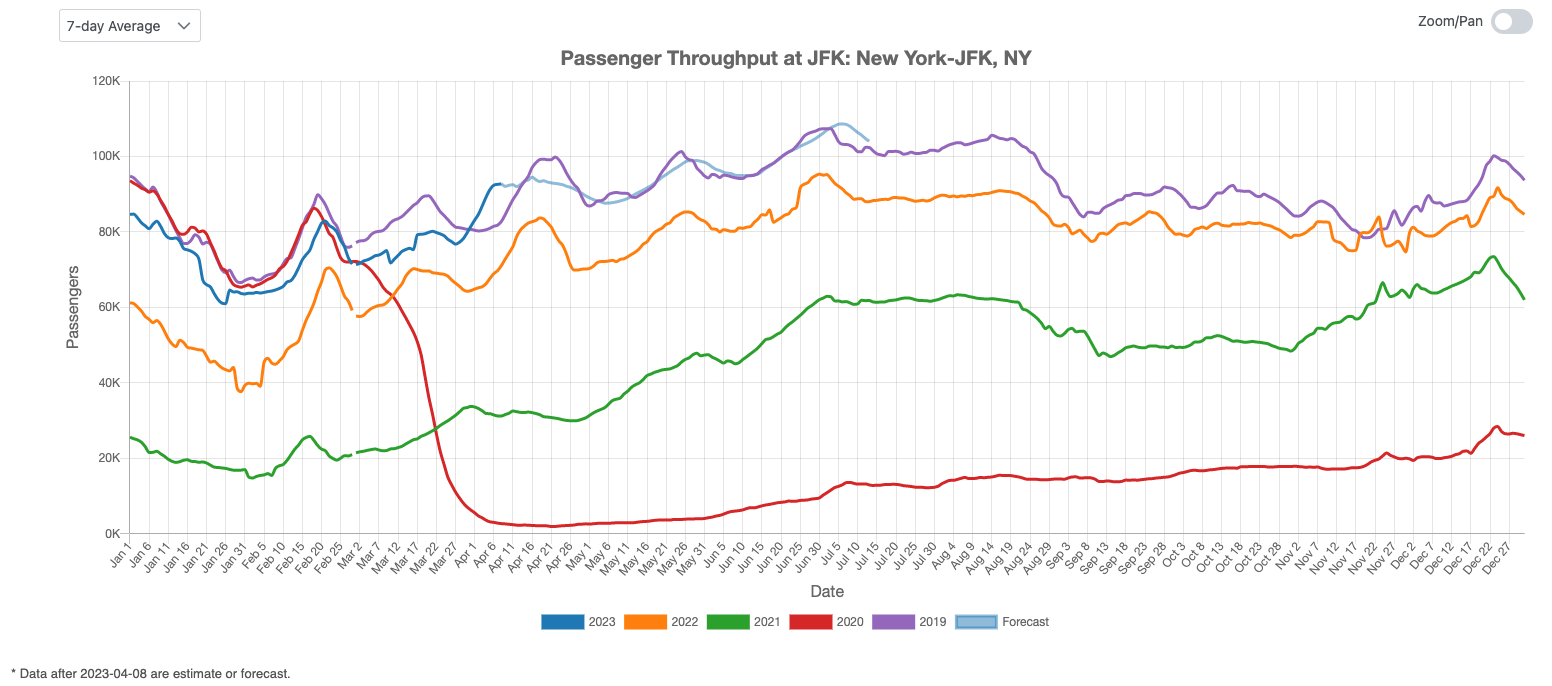
Figure 3: US International Air Traffic Indicator
Leisure Air Traffic Indicator
Leisure air traffic has been a driving force behind the recovery of US air traffic following the COVID-19 outbreak. Although leisure traffic has been relatively stable in 2022, it gained momentum once again in February and March this year. As illustrated in Figure 4, the 2023 leisure traffic retrieved a little bit at the end of March, but we expect it to continue soaring in the coming months.
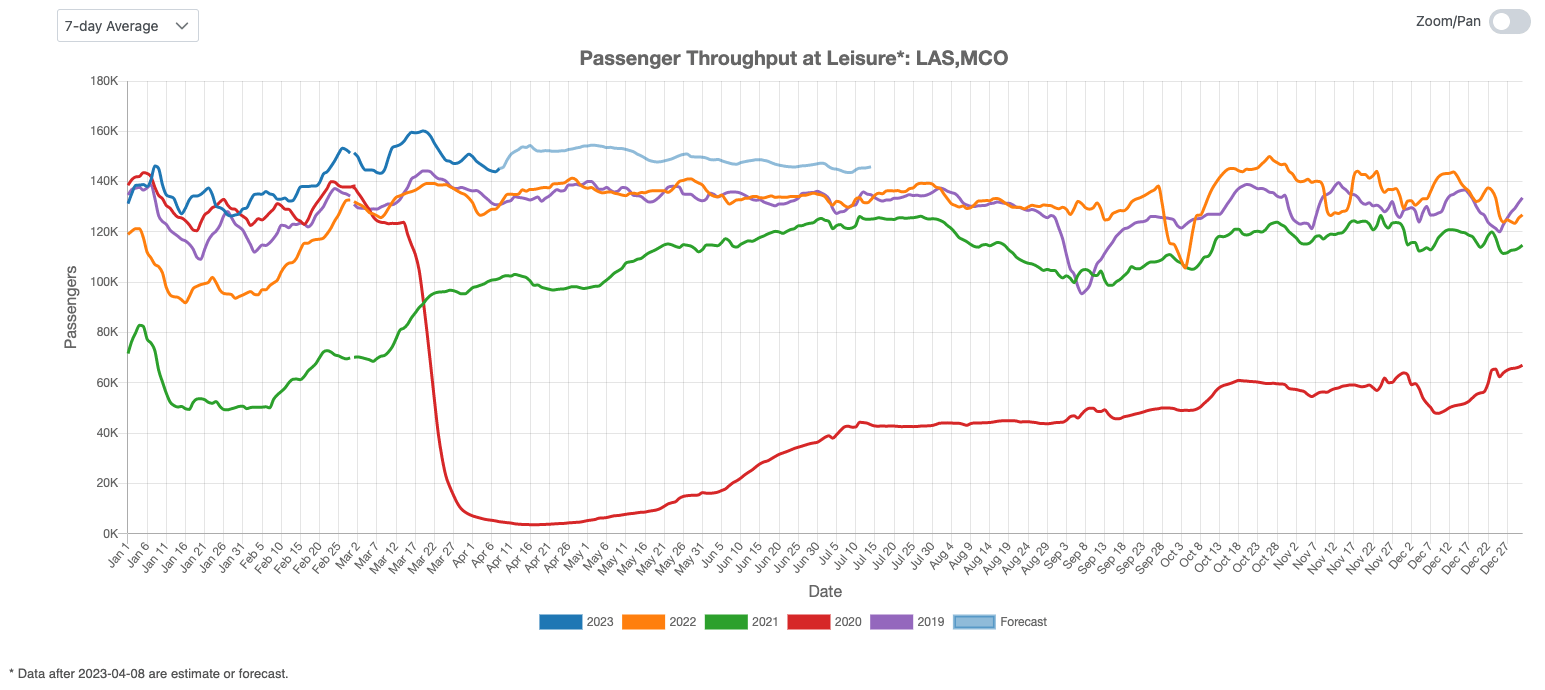
Figure 4: US Leisure Air Traffic Indicator
Business Air Traffic Indicator
Turning to business traffic, Figure 5 indicates that the 2023 curve has caught up to the 2019 level in March. We anticipate that it will continue to climb towards a summer peak, in a manner consistent with a typical historical year.
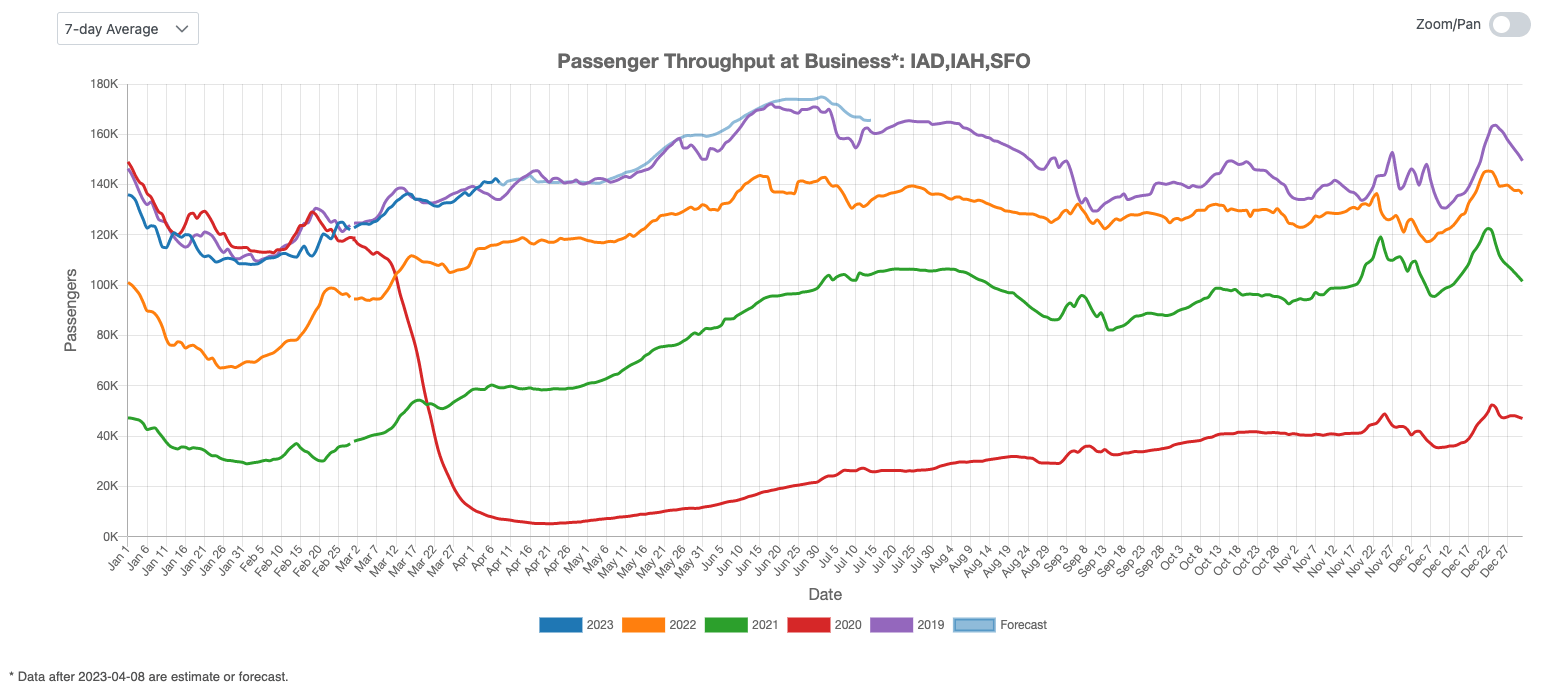
Figure 5: US Business Air Traffic Indicator
In summary, March 2023 saw a healthy growth in US air traffic from last year. And the total airport traffic remained relatively stable. The domestic and leisure markets continue to outperform the international and business markets, but the latter are also showing signs of growth.