Traffic and fare data by airline and route can provide valuable insights into market trends, demand, and competition. By analyzing this data, airlines can optimize their pricing strategies, plan their capacity, and make informed decisions about their route network. The data can also be used for market and competitive analysis, helping airlines identify profitable routes and gain a competitive advantage.
According to preliminary true O&D level data released by FlightBI this week, the air traffic was almost unchanged from March 2023 to April 2023 and there is a healthy growth year over year. Specifically, US domestic passenger volume decreased by 0.8%, and the average domestic airfare decreased by 1.8%.
Volume Trend
The US air market displayed an upward trend in passenger volume according to the latest Origin and Destination (O&D) data. In April 2023, US domestic air travel registered 50.9 million passengers, a slight decrease from 51.3 million in March. The small month-on-month decrease this year makes April 2023 traffic above the pre-pandemic passenger count of 48.7 million recorded in Apr 2019. Concurrently, the international sector of the US air market was almost flat, with passenger volume staying at 18.6 million.
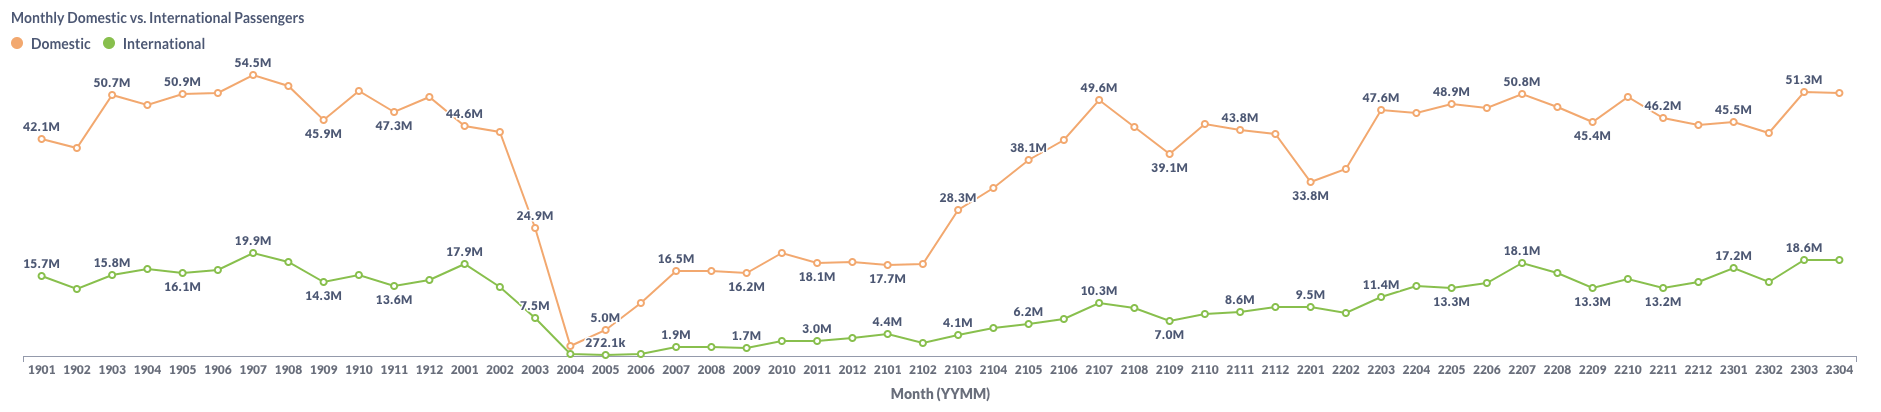
Figure 1: US Domestic and International Air Traffic by Month
Airfare Trend
Airfare trends in the domestic market have shown an decrease, as evidenced by the average gross fare for air travel from $223 in March to $219 in April. Simultaneously, the average net fare demonstrated a similar downward trend, de-escalating from $192 to $188 during the same time frame.
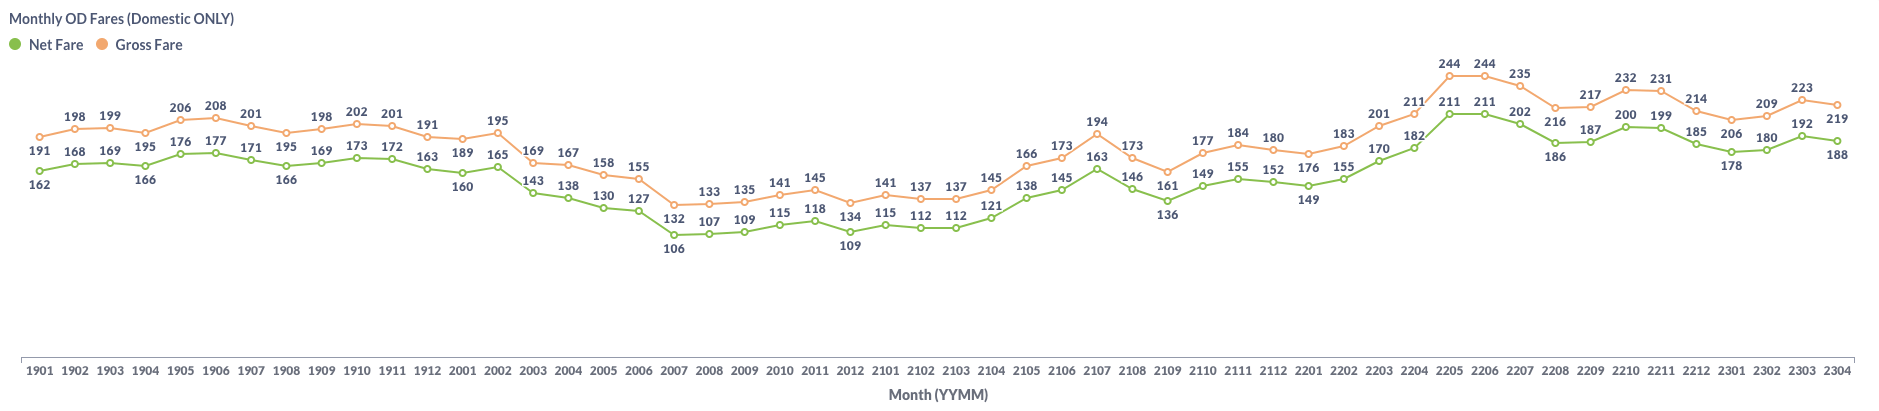
Figure 2: US Domestic Average Airfare by Month
The declining jet fuel price in recent months helped on the decrease of average airfare. Data from the Energy Information Administration (EIA) indicates a decrease in jet fuel prices from March to April 2023, as shown in the chart below.
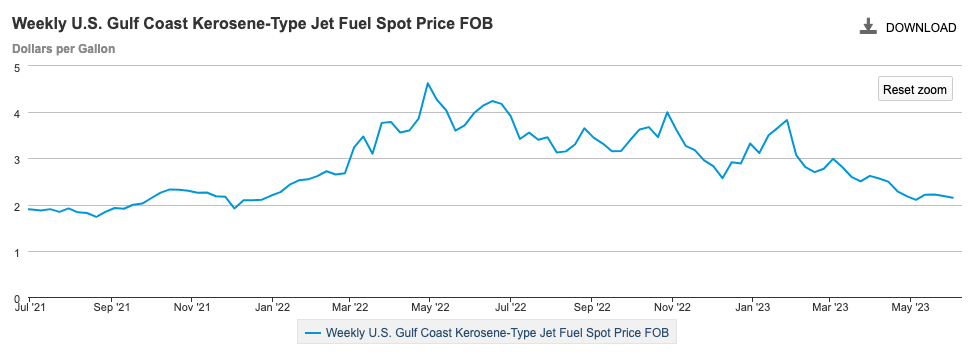
Figure 3: US Jet Fuel Price
Load Factor Trend
The average load factor in April decreased to 79.8% from 81.6% recorded in March. As illustrated in Figure 4 below, this retrieval can be attributed to a faster decrease in demand than supply within the period. Southwest Airlines continued to record the lowest load factor among major US airlines, but it has almost recovered from the impact of the mass meltdown in the last holiday season.
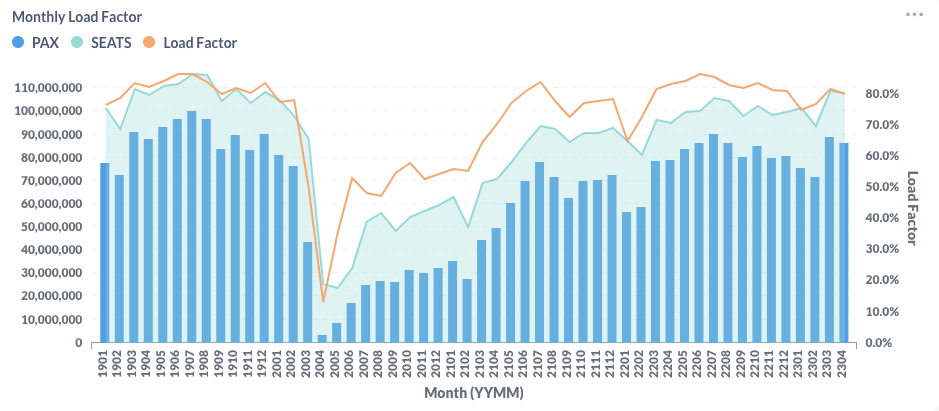
Figure 4: US Airlines’ Average Load Factor by Month
Month Over Month Comparison
Between March and April 2023, most airlines recorded an uptick in daily passenger traffic, with the exception of Allegiant Air (G4), JetBlue (B6) and American Airlines (AA). Hawaiian Airlines (HA) was at the forefront of this growth, registering a substantial 15.3% increase in daily traffic. Both Southwest Airlines (WN) and Frontier Airlines (F9) also saw significant growth, posting expansion rates around 9%. Contrarily, Allegiant Air (G4) observed a dip in daily traffic, experiencing a 3.3% decrease during this period.
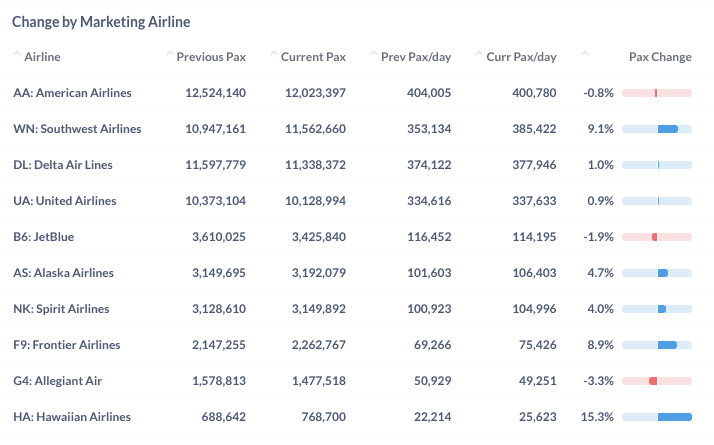
Figure 5: Air Traffic by Dominant Marketing Airlines in March 2023 (Previous) vs. April 2023 (Current)
In April 2023, most leading airports also registered an increase in daily passenger traffic compared to the previous month. Notably, Boston (BOS) led the month-to-month growth with a 9.7% surge in daily traffic, followed by Seattle (SEA) and New York (JFK), which reported increases of 6.6% and 6.4% respectively. Chicago (ORD), Ft Lauderdale (FLL), and Miami (MIA) experienced some decrease from the previous month.
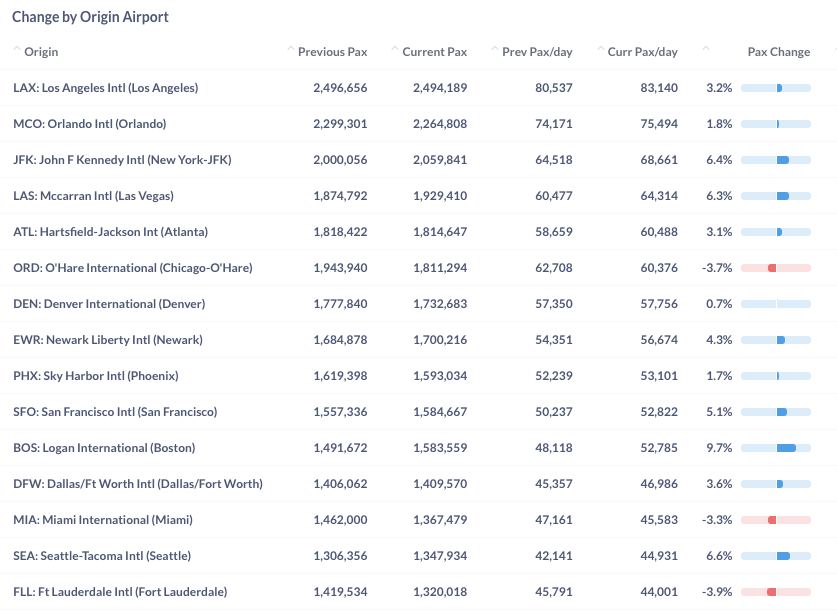
Figure 6: Air Traffic by Top Origin Airports in March 2023 (Previous) vs. April 2023 (Current)
Year Over Year Comparison
In a year-over-year comparison with April 2022, all prominent US airlines except Allegiant (G4) recorded positive growth. Notably, Frontier (F9), Hawaiian (HA) and Spirit (NK) led year-over-year growth with 18.3%, 16.3% and 15.6%, respectively, thereby leading the growth trajectory among the major US airlines.
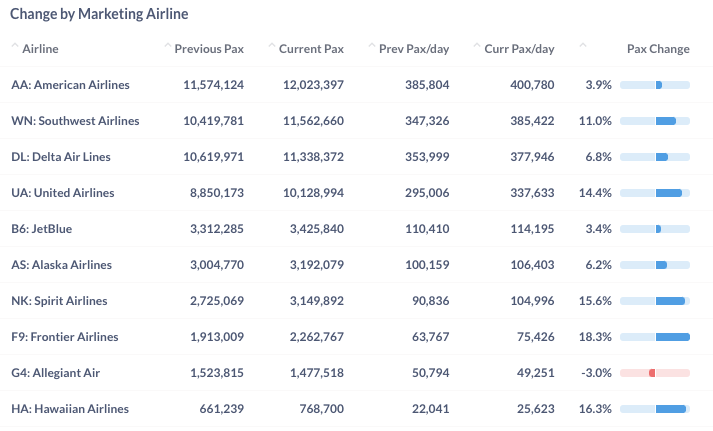
Figure 7: Air Traffic by Dominant Marketing Airlines in April 2023 (Current) vs. April 2022 (Previous)
Between April 2022 and April 2023, the top airports exhibited impressive growth, recording an increase above 10%, except Miami (MIA). Particularly, San Francisco International Airport (SFO) and John F. Kennedy International Airport in New York (JFK) spearheaded the year-over-year growth, boasting substantial increases of 22.7.
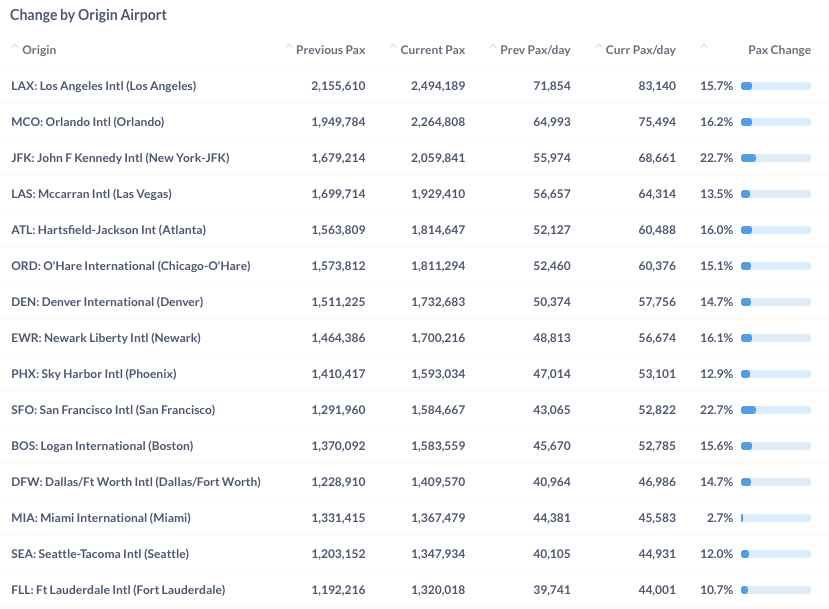
Figure 8: Air Traffic by Top Origin Airport in April 2023 (Current) vs. April 2022 (Previous)
For more detailed information on traffic and fares by route and airline, please contact service@flightbi.com or request a demo of Fligence USOD. They will be able to provide you with customized information to meet your specific needs and requirements.