The US BizAv (Business Aviation) market has been booming since March 2021. This series of articles track the traffic trend of this market. We define the BizAv market as part-135 on-demand for-hire private flying by business jets or certain turboprop planes. The numbers in the following charts exclude part-91 private flights. If you are interested in all flights by business jets, or detailed flights by route and operator, please get in touch with us.
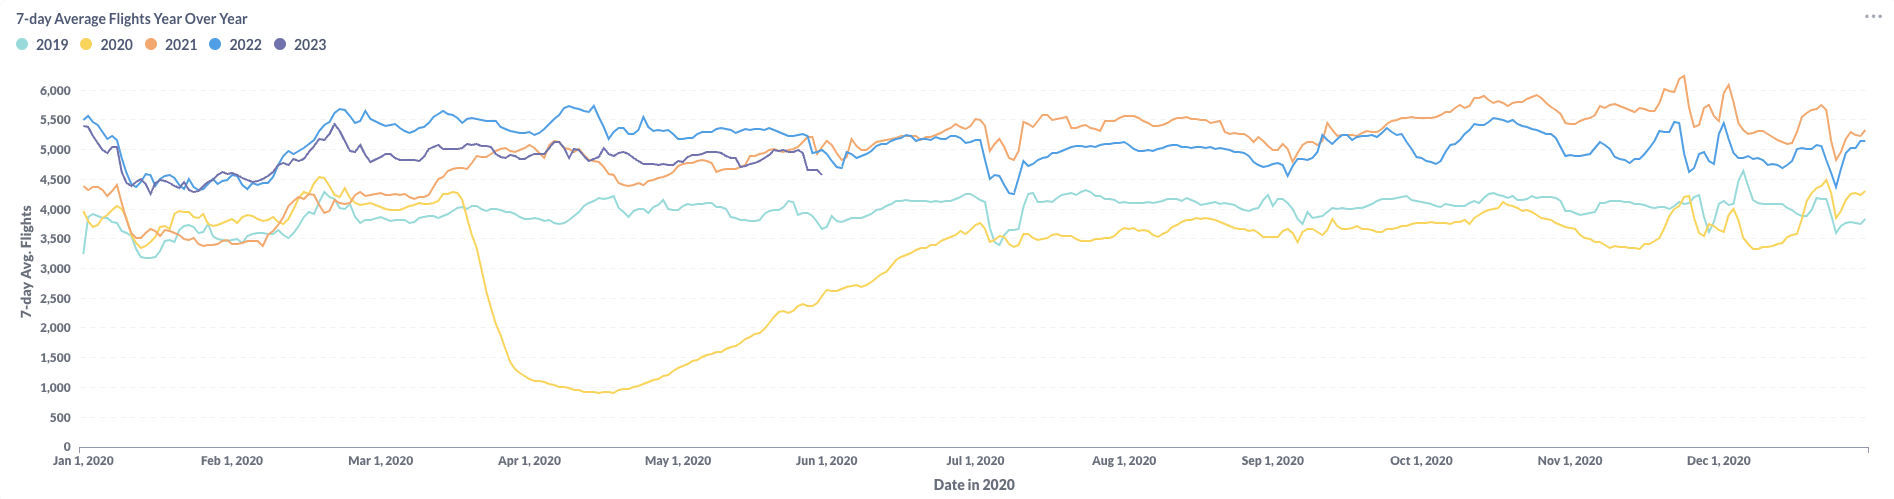
Figure 1: Year over Year Trend of the U.S. BizAv Market
Figure 1 illustrates that U.S. BizAv traffic in May 2023 fell short of the previous year’s level. The gap between 2023 and 2022 was increased in the mid of May and shank toward the end of the month. Overall, the average daily flights have decreased 1.2% from the last month.
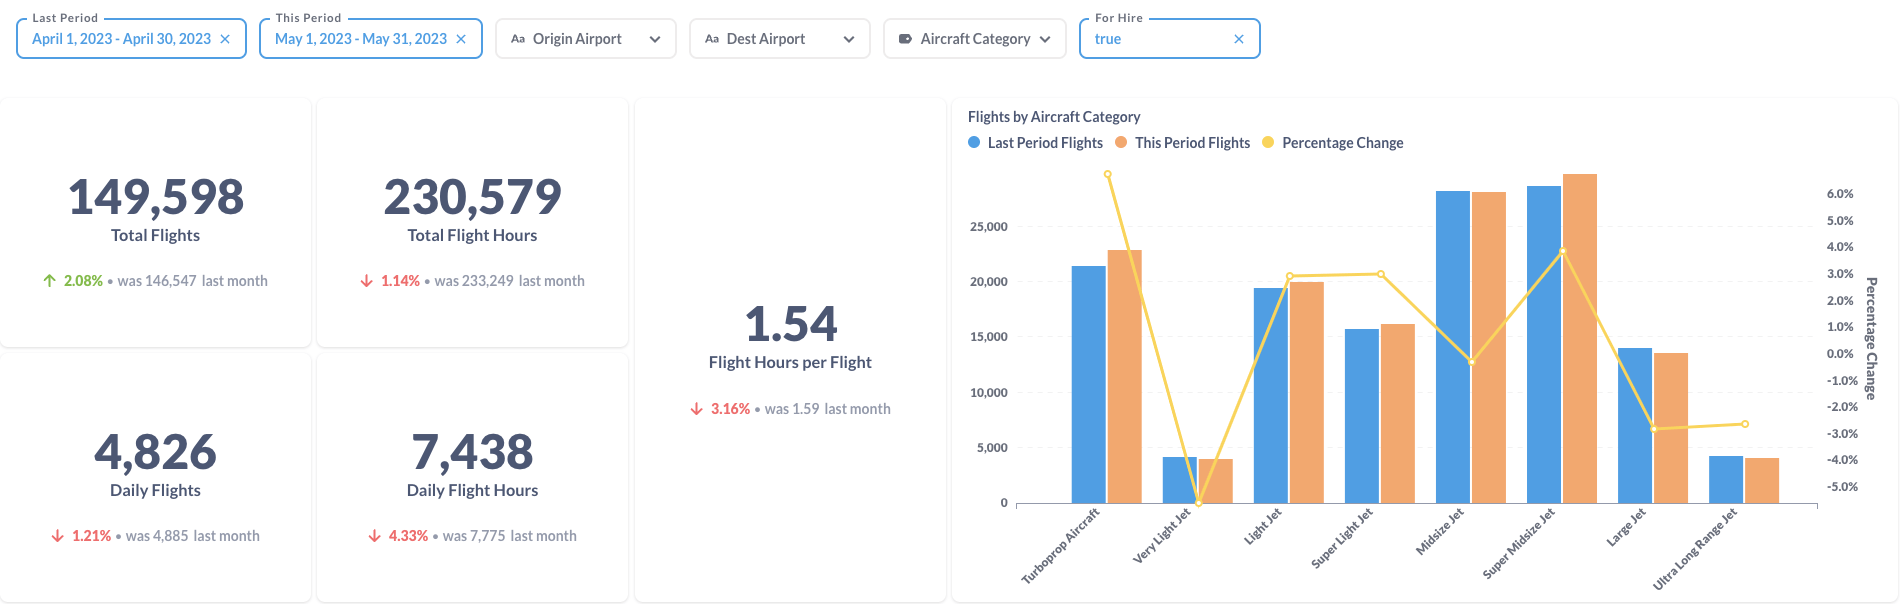
Figure 2: Comparison of the U.S. BizAv Flights This Month vs. Last Month
Figure 2 compares flight data between May 2023 and April 2023, highlighting an increase in total flights but a decrease in total flight hours. Total flights increased because there is one more day in May than in April. However, both average flight length and daily flights declined. Change in number of flights by aircraft category has a mixed picture. Turboprop, Light Jet, Super Light Jet and Super Midsize Jet saw an increase, while other categories experienced a decrease.

Figure 3: Comparison of the U.S. BizAv Flights by the Top 25 Origin States (This Month vs. Last Month)
Between May and April 2023, some states in the US experienced an increase in the number of flights while others had an decrease. The largest decreases were observed in Florida, although it still had the highest number of flights in both periods. Texas, New Jersey and New York welcomed some growth in number of flights.
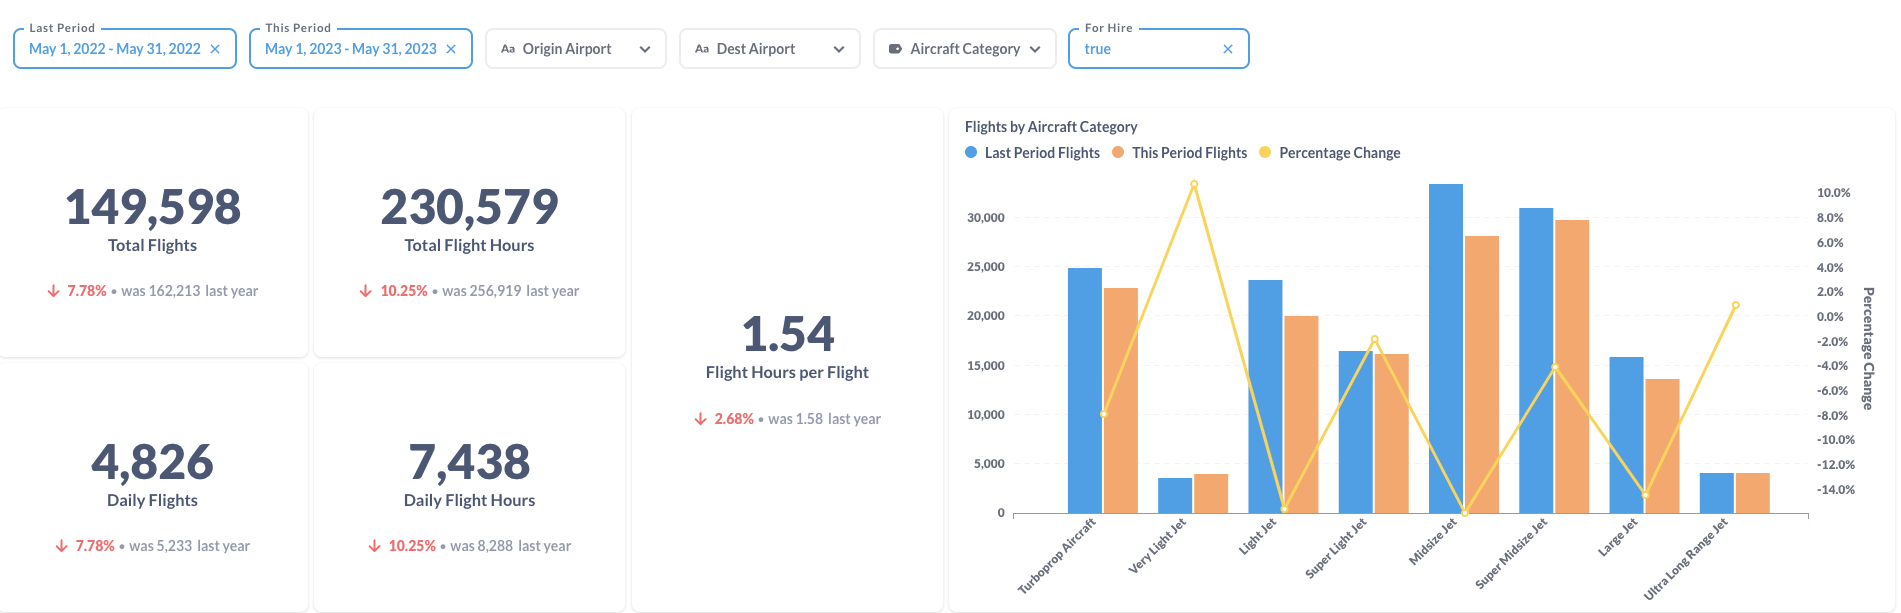
Figure 4: Comparison of the U.S. BizAv Flights This Year vs. Last Year
Compared to the same month last year, total business flights in May 2023 decreased by 7.78%. Total flight hours dropped by 10.25% because the average flight hours per flight also shrank by 2.68%. Most aircraft categories experienced a decrease in the number of flights, with the exception of Very Light Jets, which saw a significant increase. Turboprop Aircraft, Light Jets, Super Light Jets, Midsize Jets, Super Midsize Jets, and Large Jets all experienced declines in varying degrees. The most notable decrease was observed in the Light Jet and Midsize jet categories, while the Ultra Long Range Jet category saw a slight increase.
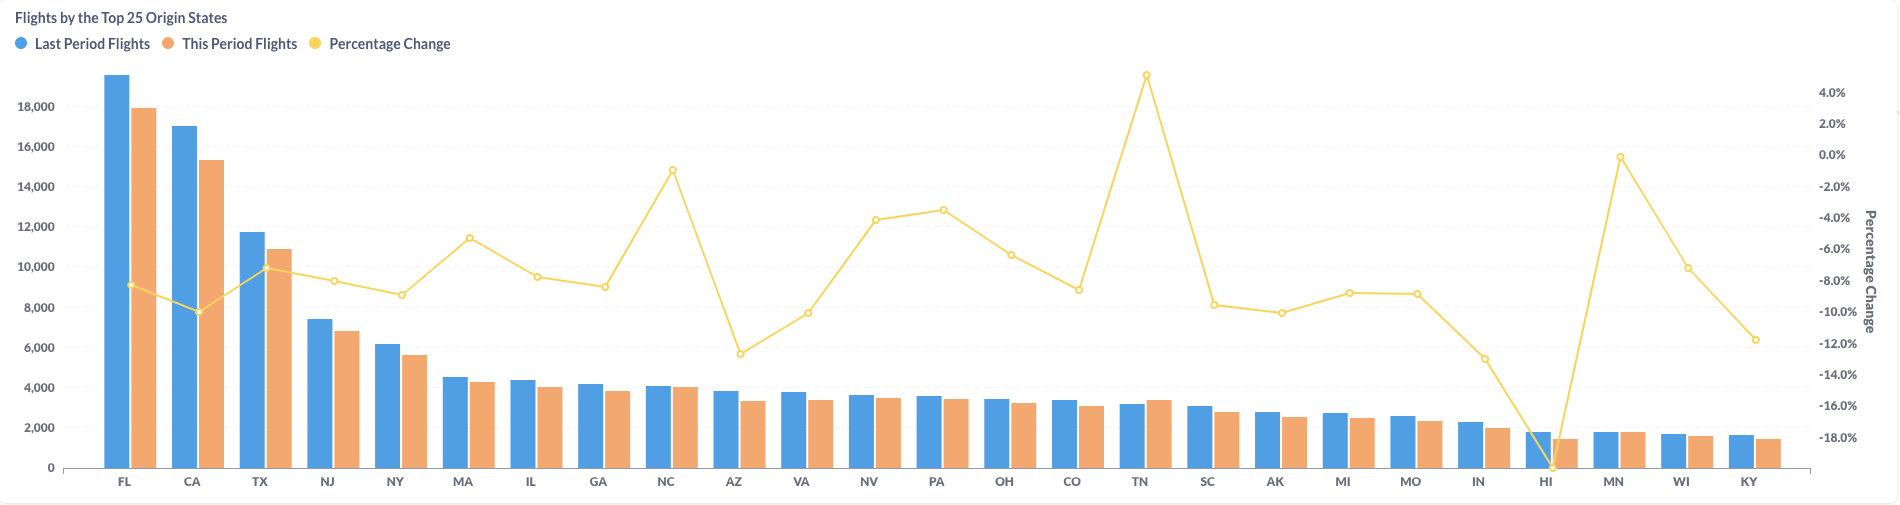
Figure 5: Comparison of the U.S. BizAv Flights by the Top 25 Origin States (This Year vs. Last Year)
Comparing flight data from May 2022 to May 2023, most states in the US experienced a decrease in the number of flights. Florida maintained the highest number of flights in both periods, with 19,573 flights in May 2022 and 17,956 flights in May 2023, representing a 8.3% year-over-year decrease.