The US BizAv (Business Aviation) market has been booming since March 2021. This series of articles track the traffic trend of this market. We define the BizAv market as part-135 on-demand for-hire private flying by business jets or certain turboprop planes. The numbers in the following charts exclude part-91 private flights. If you are interested in all flights by business jets, or detailed flights by route and operator, please get in touch with us.

Figure 1: Year over Year Trend of the U.S. BizAv Market
Figure 1 graphically portrays U.S. BizAv traffic for June 2023, indicating that, on many days throughout the month, it did not meet the levels observed in the previous year. However, this disparity had effectively vanished by the month’s end, equalizing the 2023 and 2022 traffic volumes. Notably, there was a modest overall increase in average daily flights by approximately 1% from the previous month. The late-month surge is likely attributable to extensive delays and cancellations of commercial flights, predominantly spearheaded by United Airlines, which likely drove more travelers to opt for BizAv services.
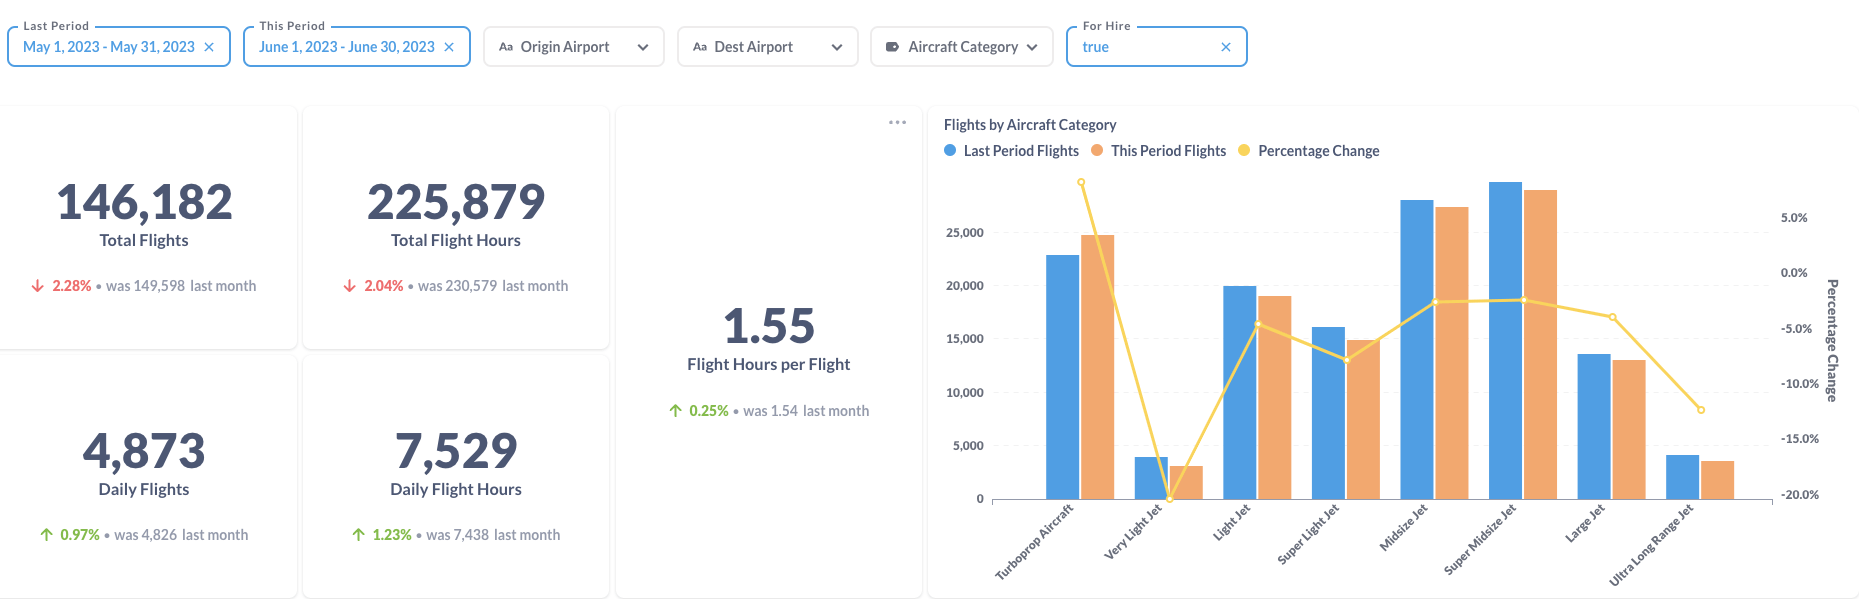
Figure 2: Comparison of the U.S. BizAv Flights This Month vs. Last Month
Figure 2 presents a comparative analysis of flight data between May 2023 and June 2023, emphasizing an uptick in both the number of daily flights and daily flight hours. However, the total number of flights observed a decrement due to June having one fewer day than May. The alterations in the quantity of flights categorized by aircraft type present a diverse scenario. Turboprops witnessed a rise in numbers, while the remaining categories, conversely, registered a decrease.
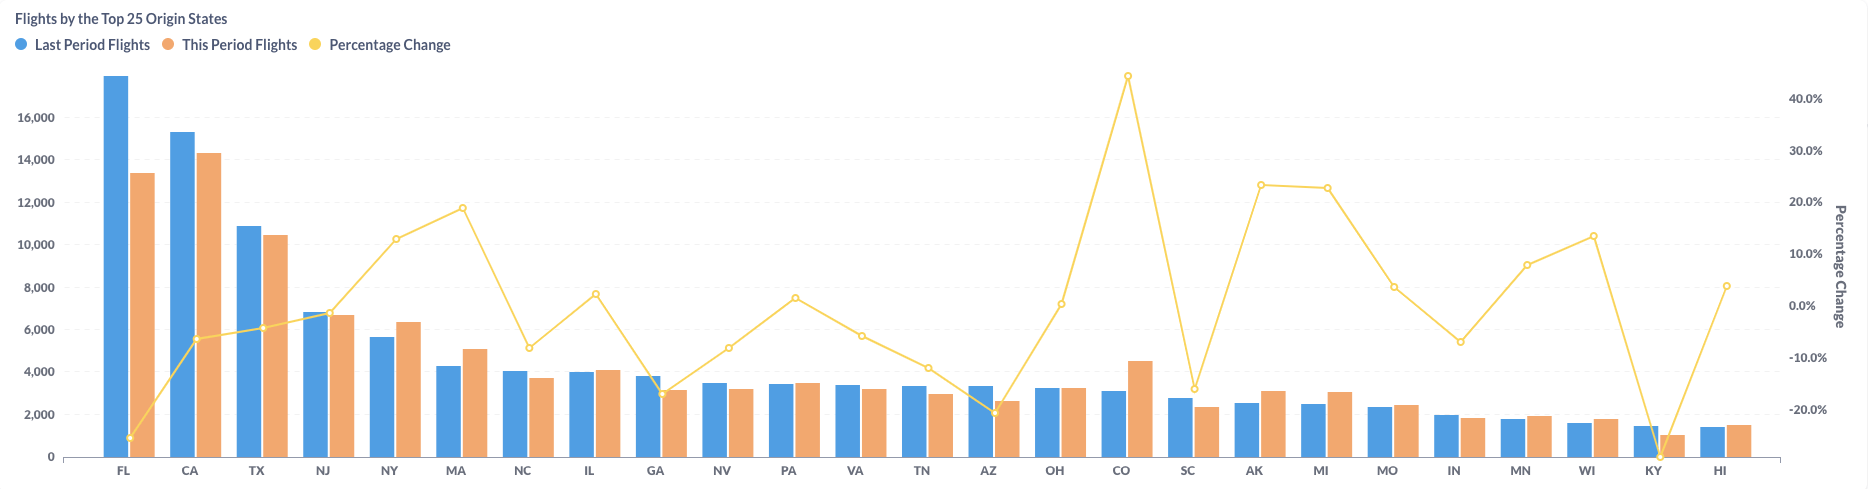
Figure 3: Comparison of the U.S. BizAv Flights by the Top 25 Origin States (This Month vs. Last Month)
Between May and June 2023, flight patterns varied across different U.S. states, with some states experiencing a rise in flight numbers, while others saw a decrease. The most substantial reductions were noted in Kentucky (KY) and Florida (FL), resulting in FL forfeiting its title as the state with the highest number of originating flights to California (CA). Meanwhile, New York (NY), Massachusetts (MA), and Colorado (CO) observed some significant growth in their flight numbers.
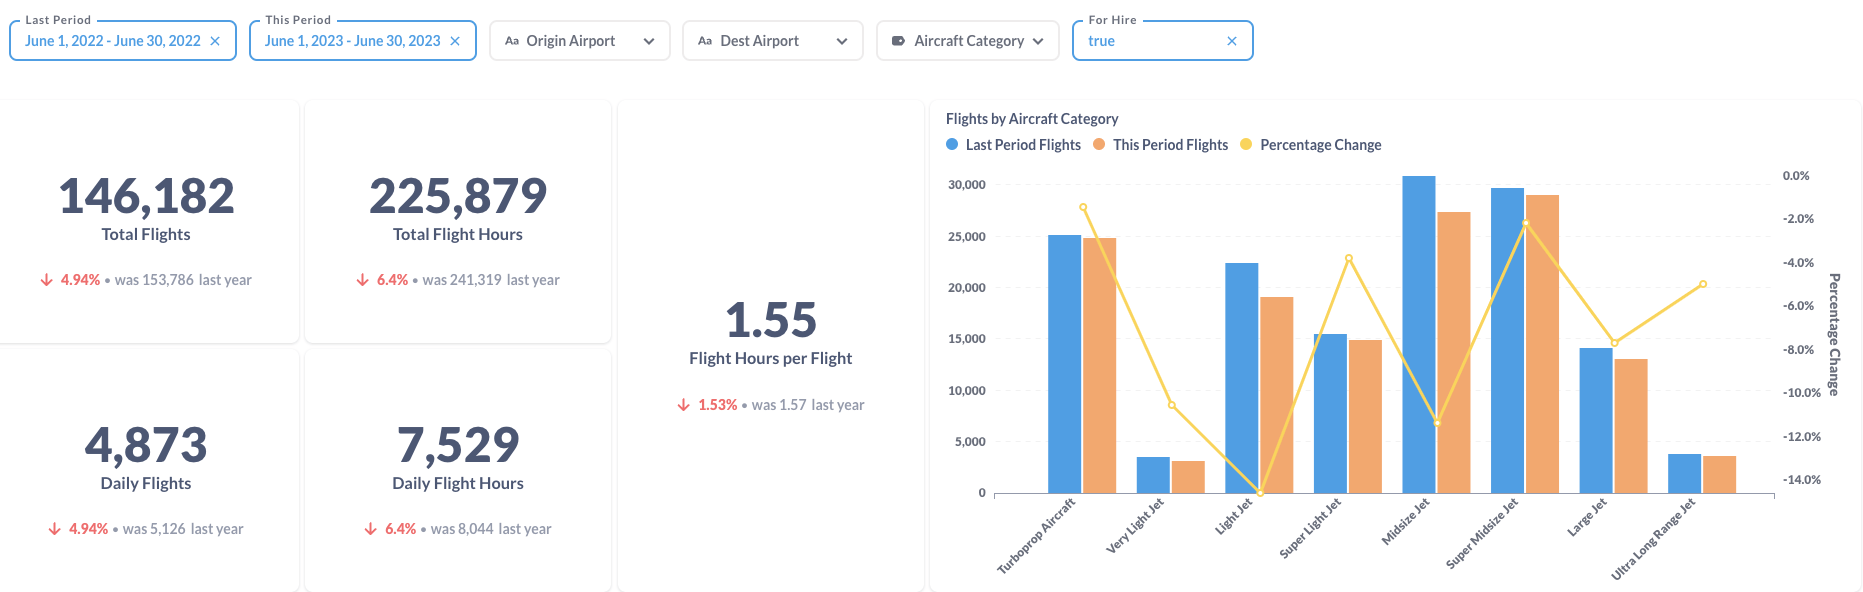
Figure 4: Comparison of the U.S. BizAv Flights This Year vs. Last Year
Compared to June 2022, the total number of business flights in June 2023 experienced a decrease of 4.9%. There was also a 6.4% reduction in total flight hours, a trend that can be attributed to a 1.5% contraction in the average flight hours per flight. All aircraft categories registered a decline in the number of flights. The most significant reduction was witnessed within the Light Jet category. In contrast, the Turboprop and Super Midsize Jet categories saw the least pronounced decreases, indicating more resilience in these segments.
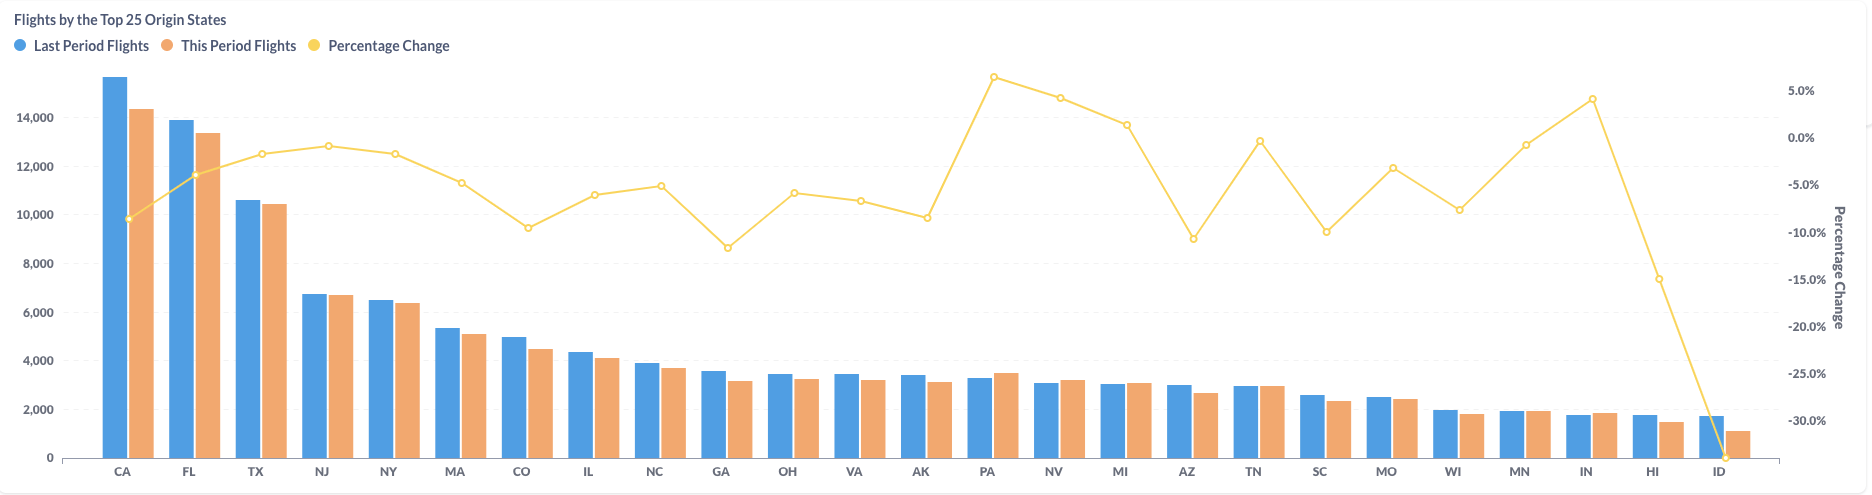
Figure 5: Comparison of the U.S. BizAv Flights by the Top 25 Origin States (This Year vs. Last Year)
Upon comparing flight data from June 2022 to June 2023, a downward trend in the number of flights is discernible across most U.S. states. Despite experiencing an 8.5% year-over-year decrease, California (CA) took the lead in June 2023 as the state with the highest number of originating flights. This was followed by Florida (FL) and Texas (TX), establishing them as the states with the second and third highest number of departures, respectively.