The US Transportation Security Administration (TSA) published airport-level passenger throughput up to Oct. 2029, 2022. Let’s check the US air traffic status in October. Please refer to this article about how we choose specific airports as representatives for US domestic, international, leisure, and business markets.
U.S. Overall Air Traffic Status
As shown in Figure 1, the overall US air traffic declined at the beginning of October, rebounded back in the middle, and then declined again at the end. A decline at the end of October is a normal seasonality. But the decrease at the end of September is not. The culprit is Hurricane Ian, which forced thousands of flight cancelations from and to the Southeast of the US. The gap between the current year and the pre-pandemic level has shrunk, but capacity constraints and a potential pilot strike may slow the overall traffic.
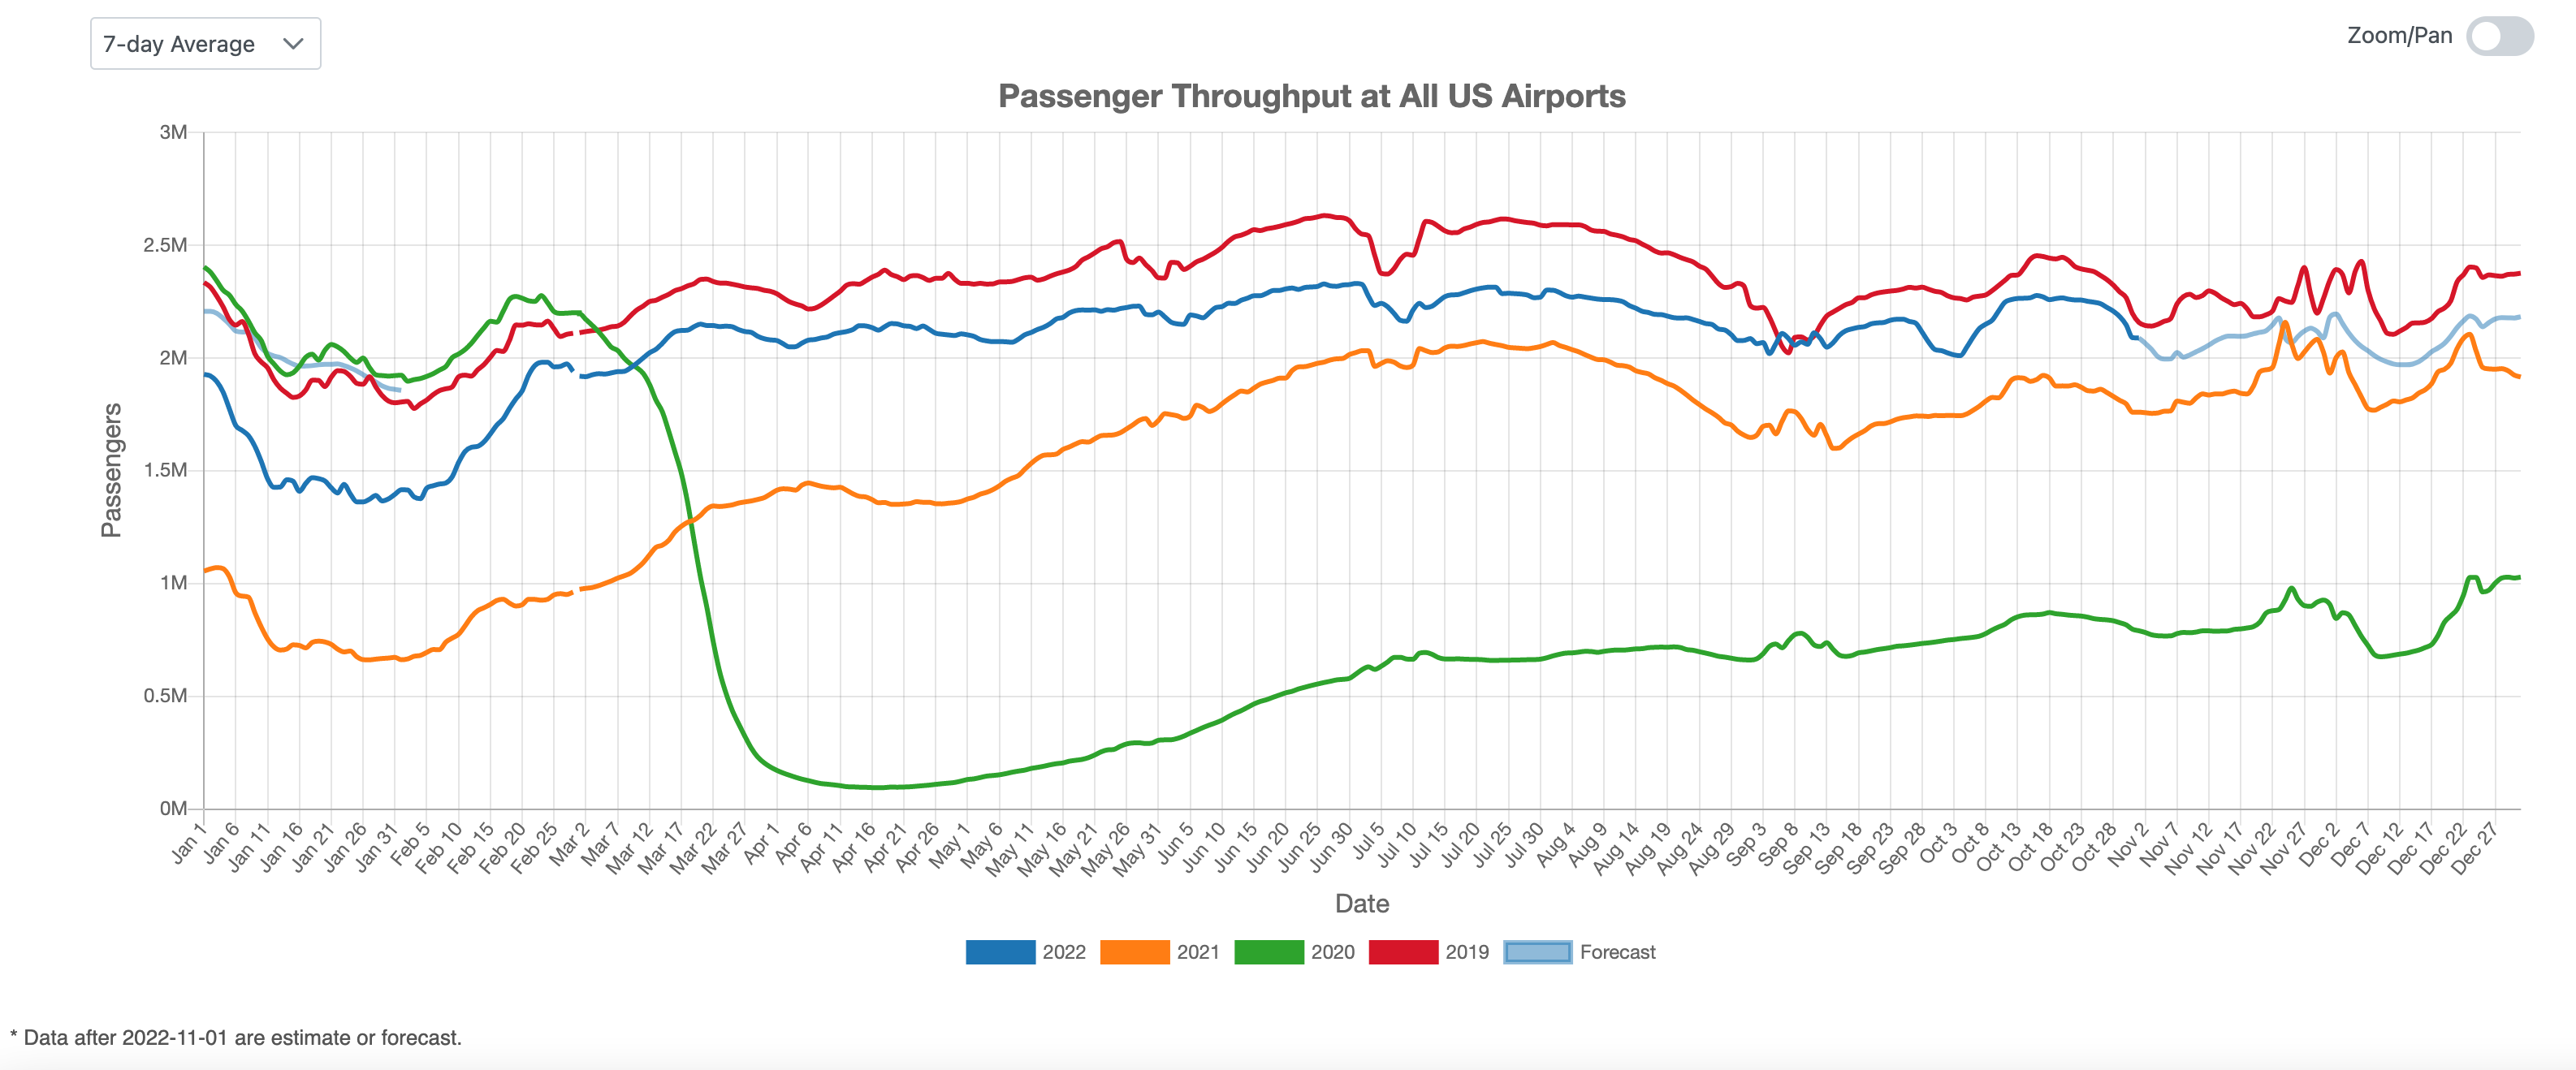
Figure 1: US Overall Air Traffic Trend
Domestic Air Traffic Indicator
Figure 2 is the U.S. domestic air traffic indicator. The domestic air traffic curve in October is almost identical to that in 2019. It will have similar ups and downs during the holiday season. After that, we expect the domestic traffic will be above the pre-pandemic level.
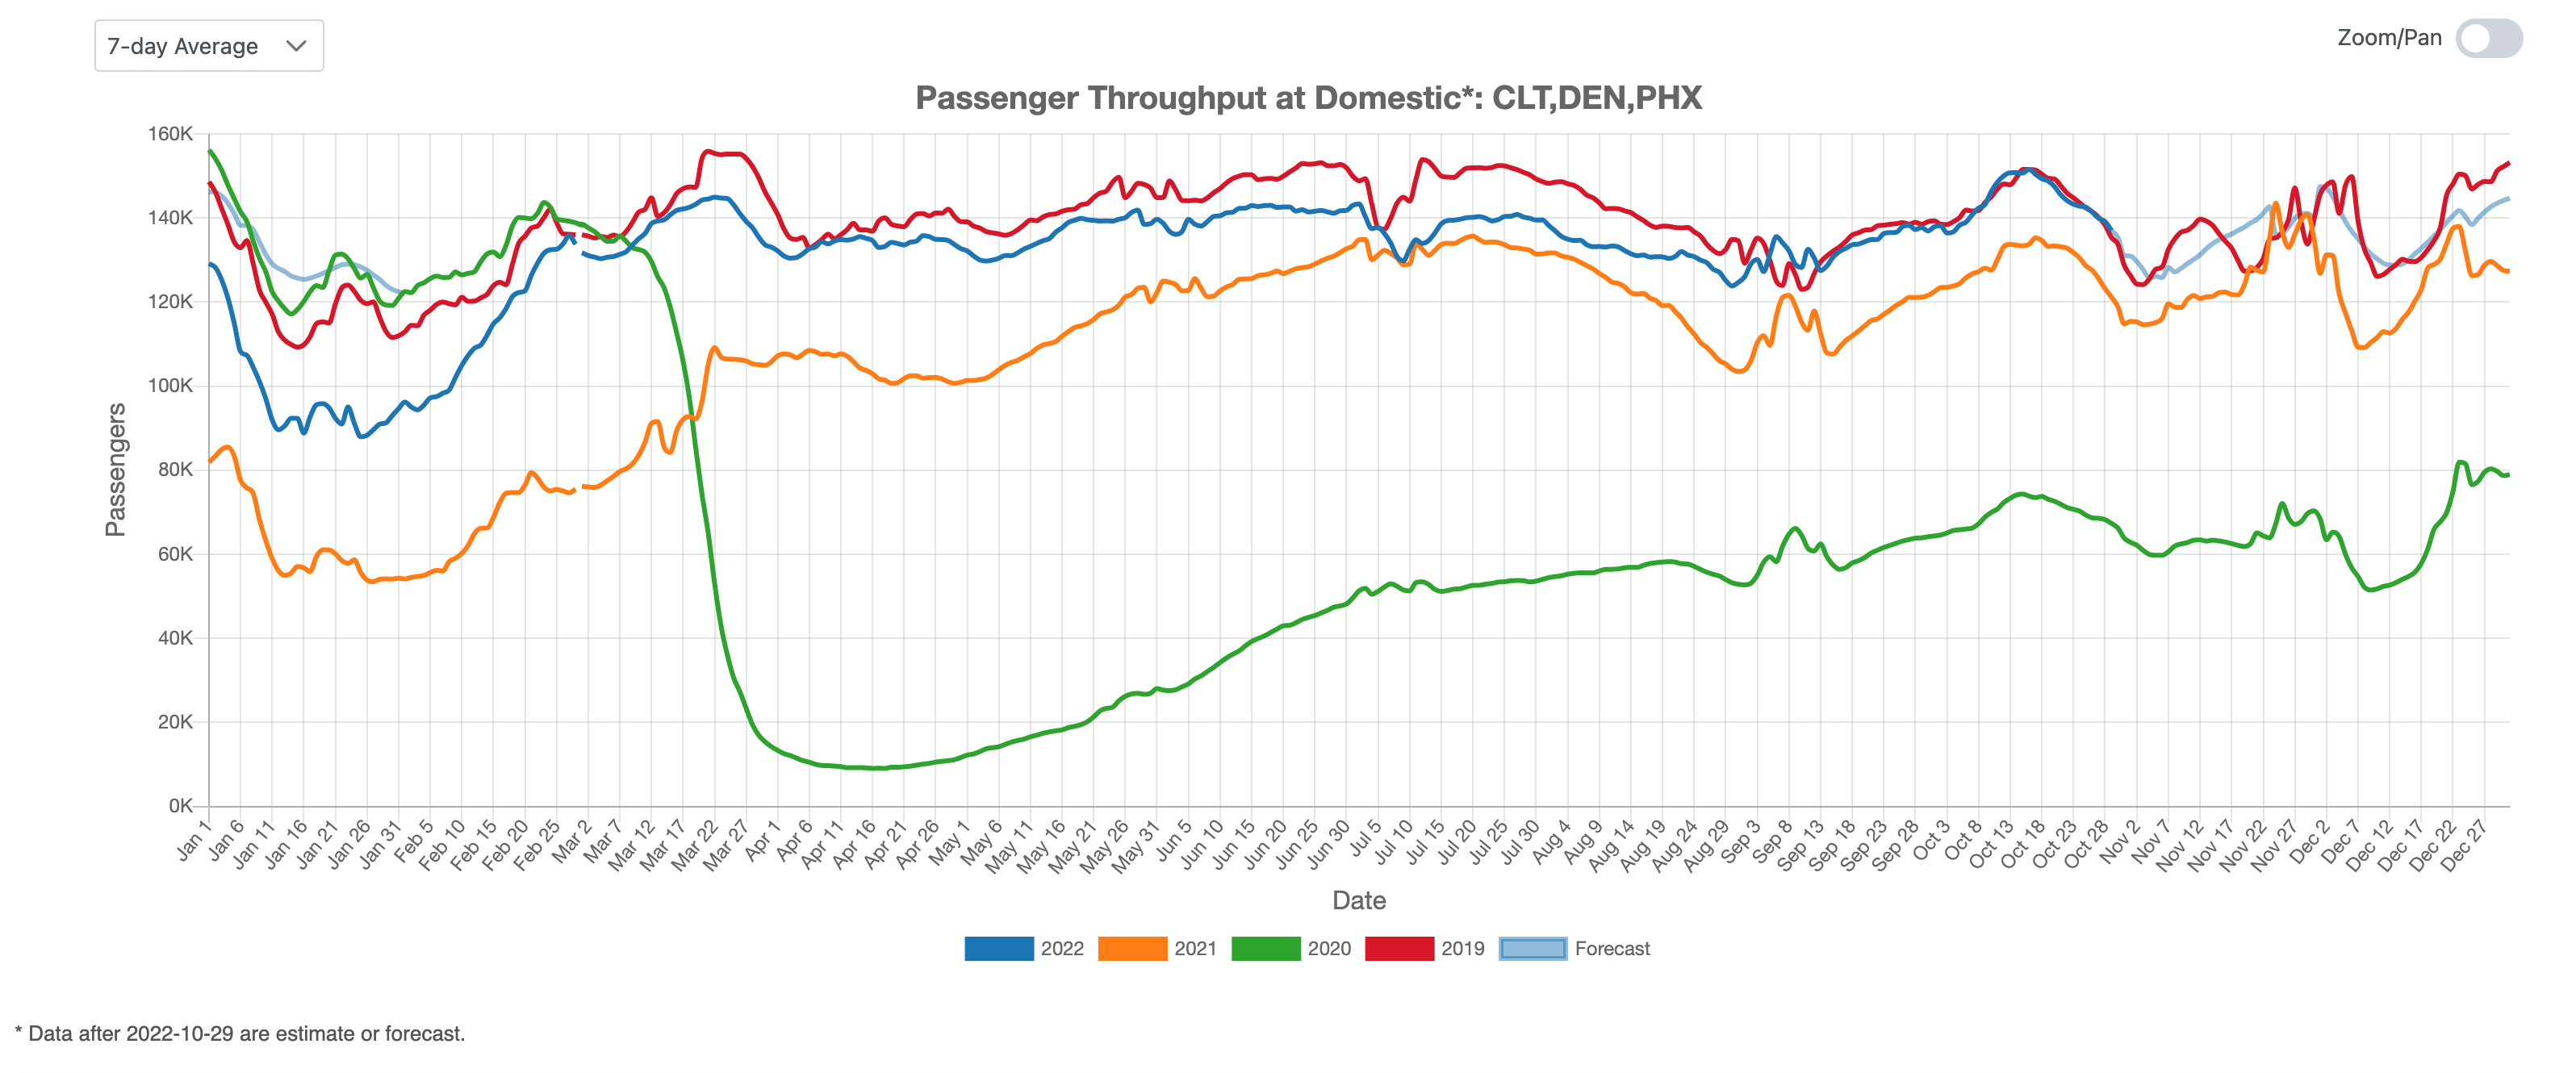
Figure 2: US Domestic Air Traffic Indicator
International Air Traffic Indicator
Figure 3 is an indicator of US international traffic. The 2022 traffic line was flat in October. International traffic may not reach the pre-pandemic level until next spring.
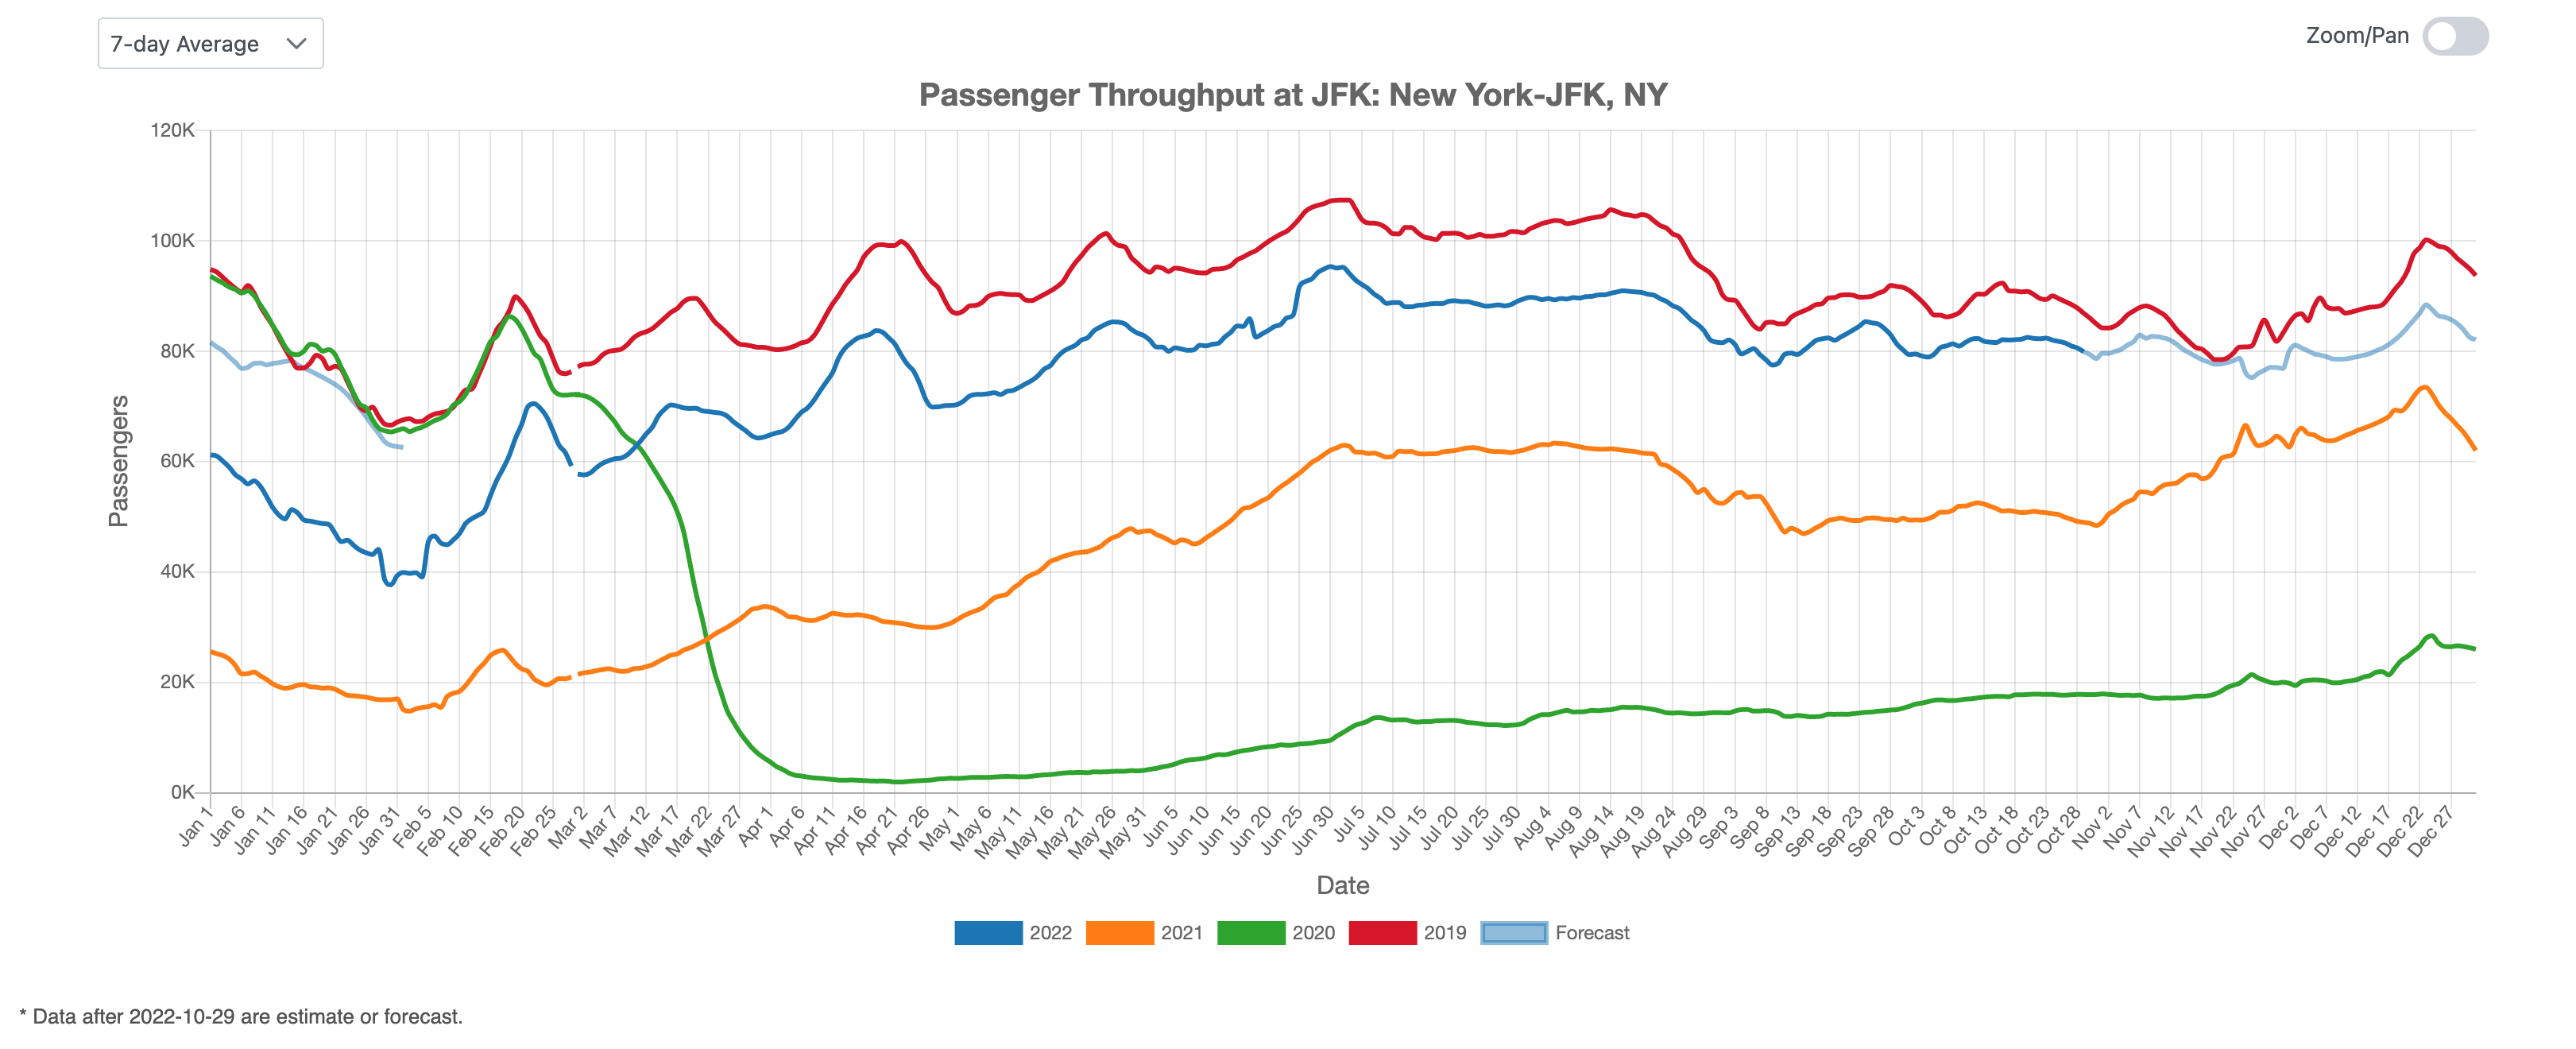
Figure 3: US International Air Traffic Indicator
Leisure Air Traffic Indicator
We picked Las Vegas (LAS) and Orlando (MCO) as the leisure traffic indicator. The traffic curve shown in Figure 4 may not be representative because the Orlando airport was shut down during Hurricane Ian. But extreme weather is a normal factor with a significant impact on air traffic in Orlando. For example, the big dent on the red 2019 curve was caused by Hurricane Dorian. This year the dent just occurred at a different time. Traffic rebounded quickly in October. We think the average leisure traffic may be higher than in 2019 for the rest of the year.
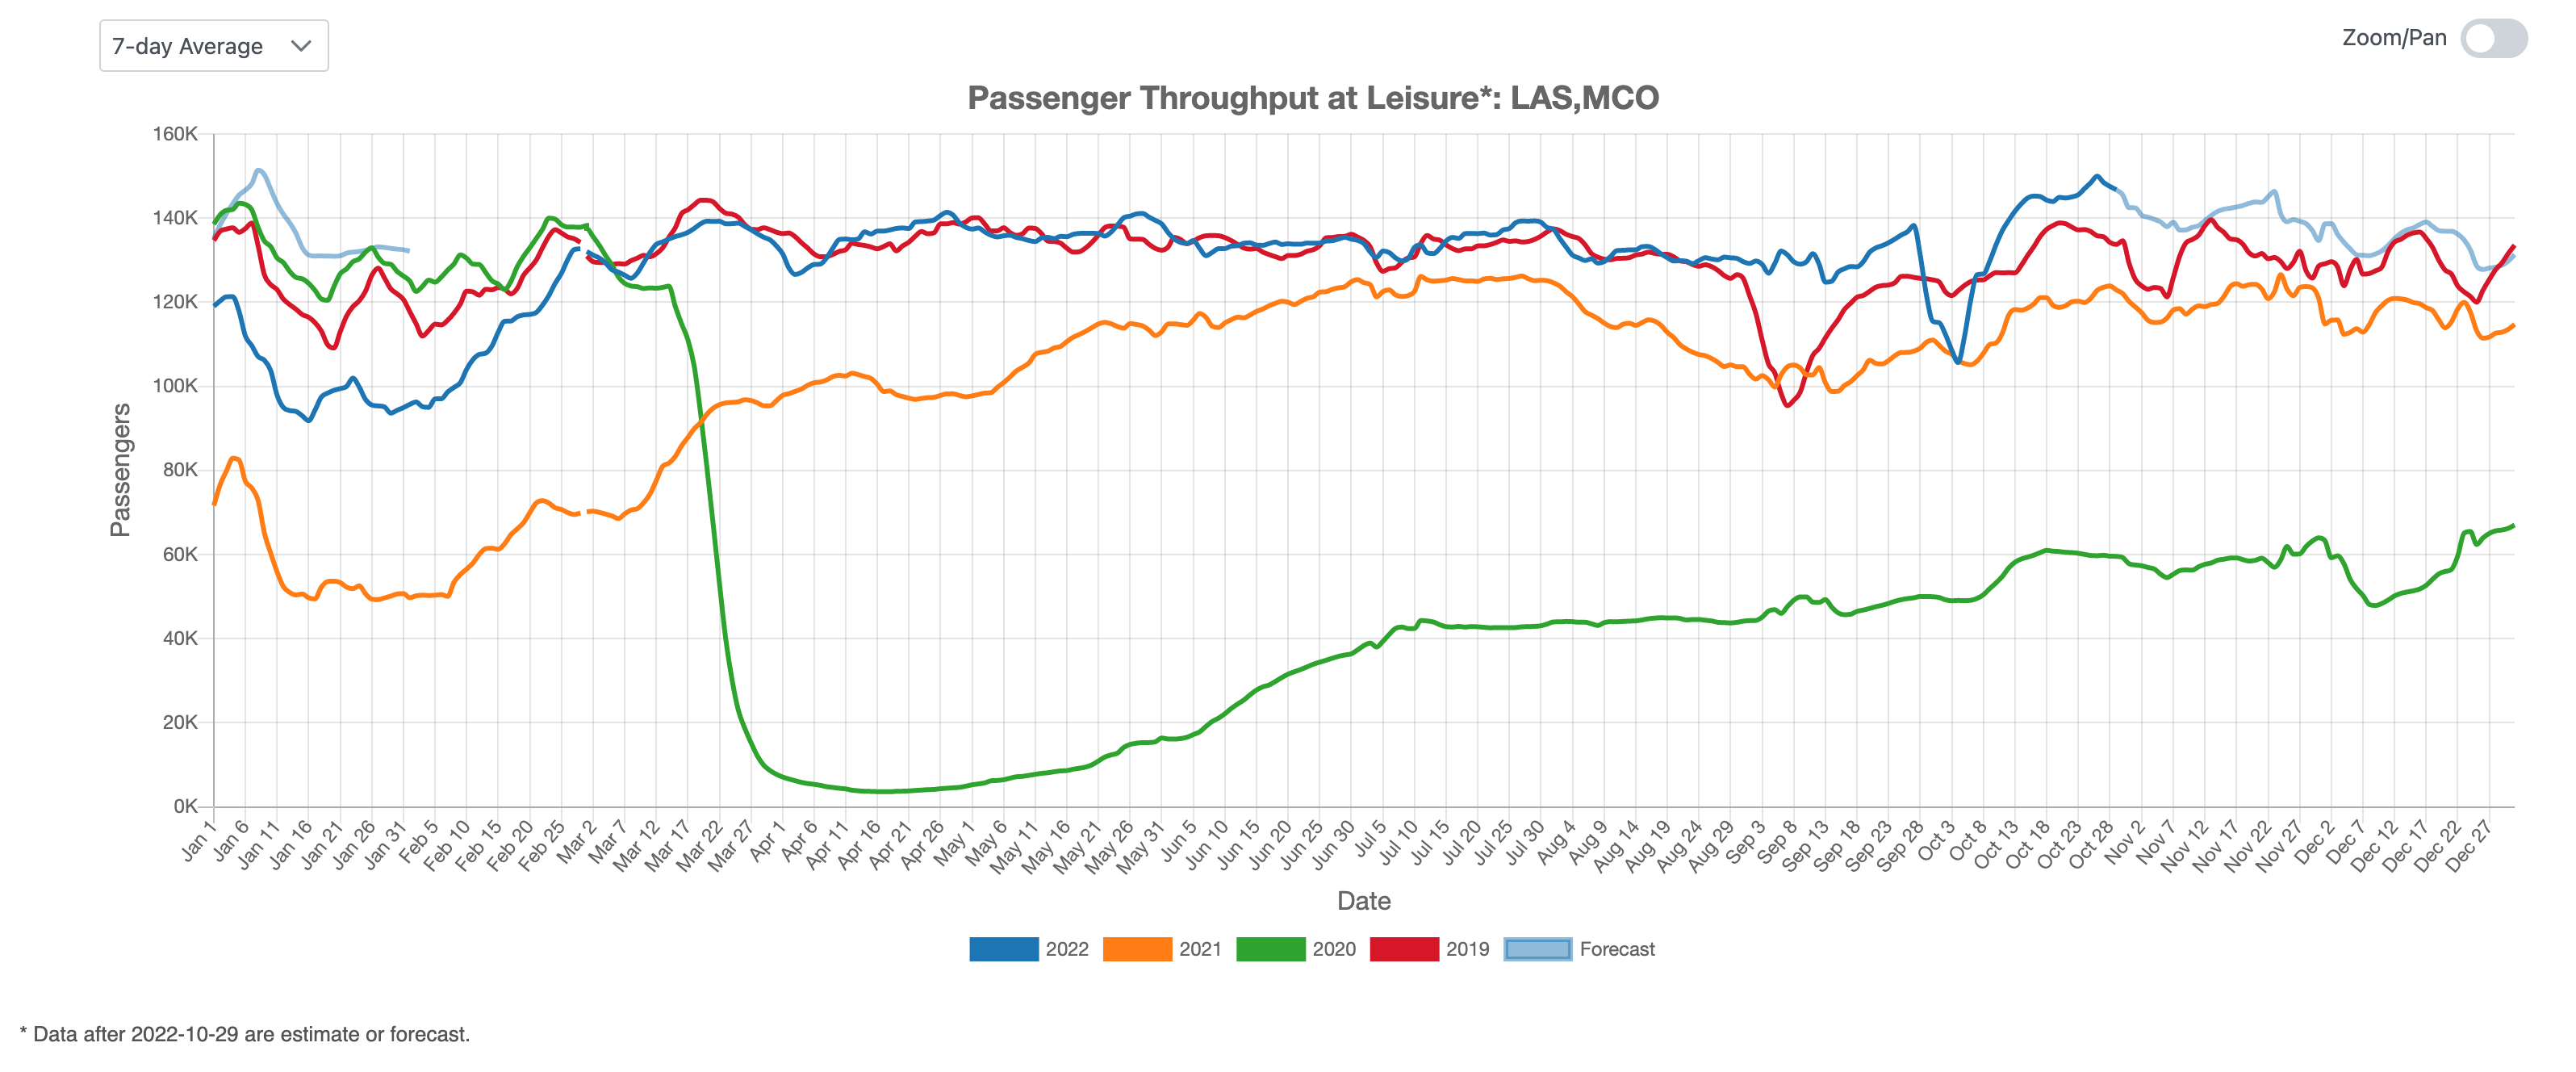
Figure 4: US Leisure Air Traffic Indicator
Business Air Traffic Indicator
As for the business traffic, Figure 5 shows that the 2022 curve was pretty flat in October. We expect the traffic to be between the 2019 and 2021 levels for the rest of 2022.
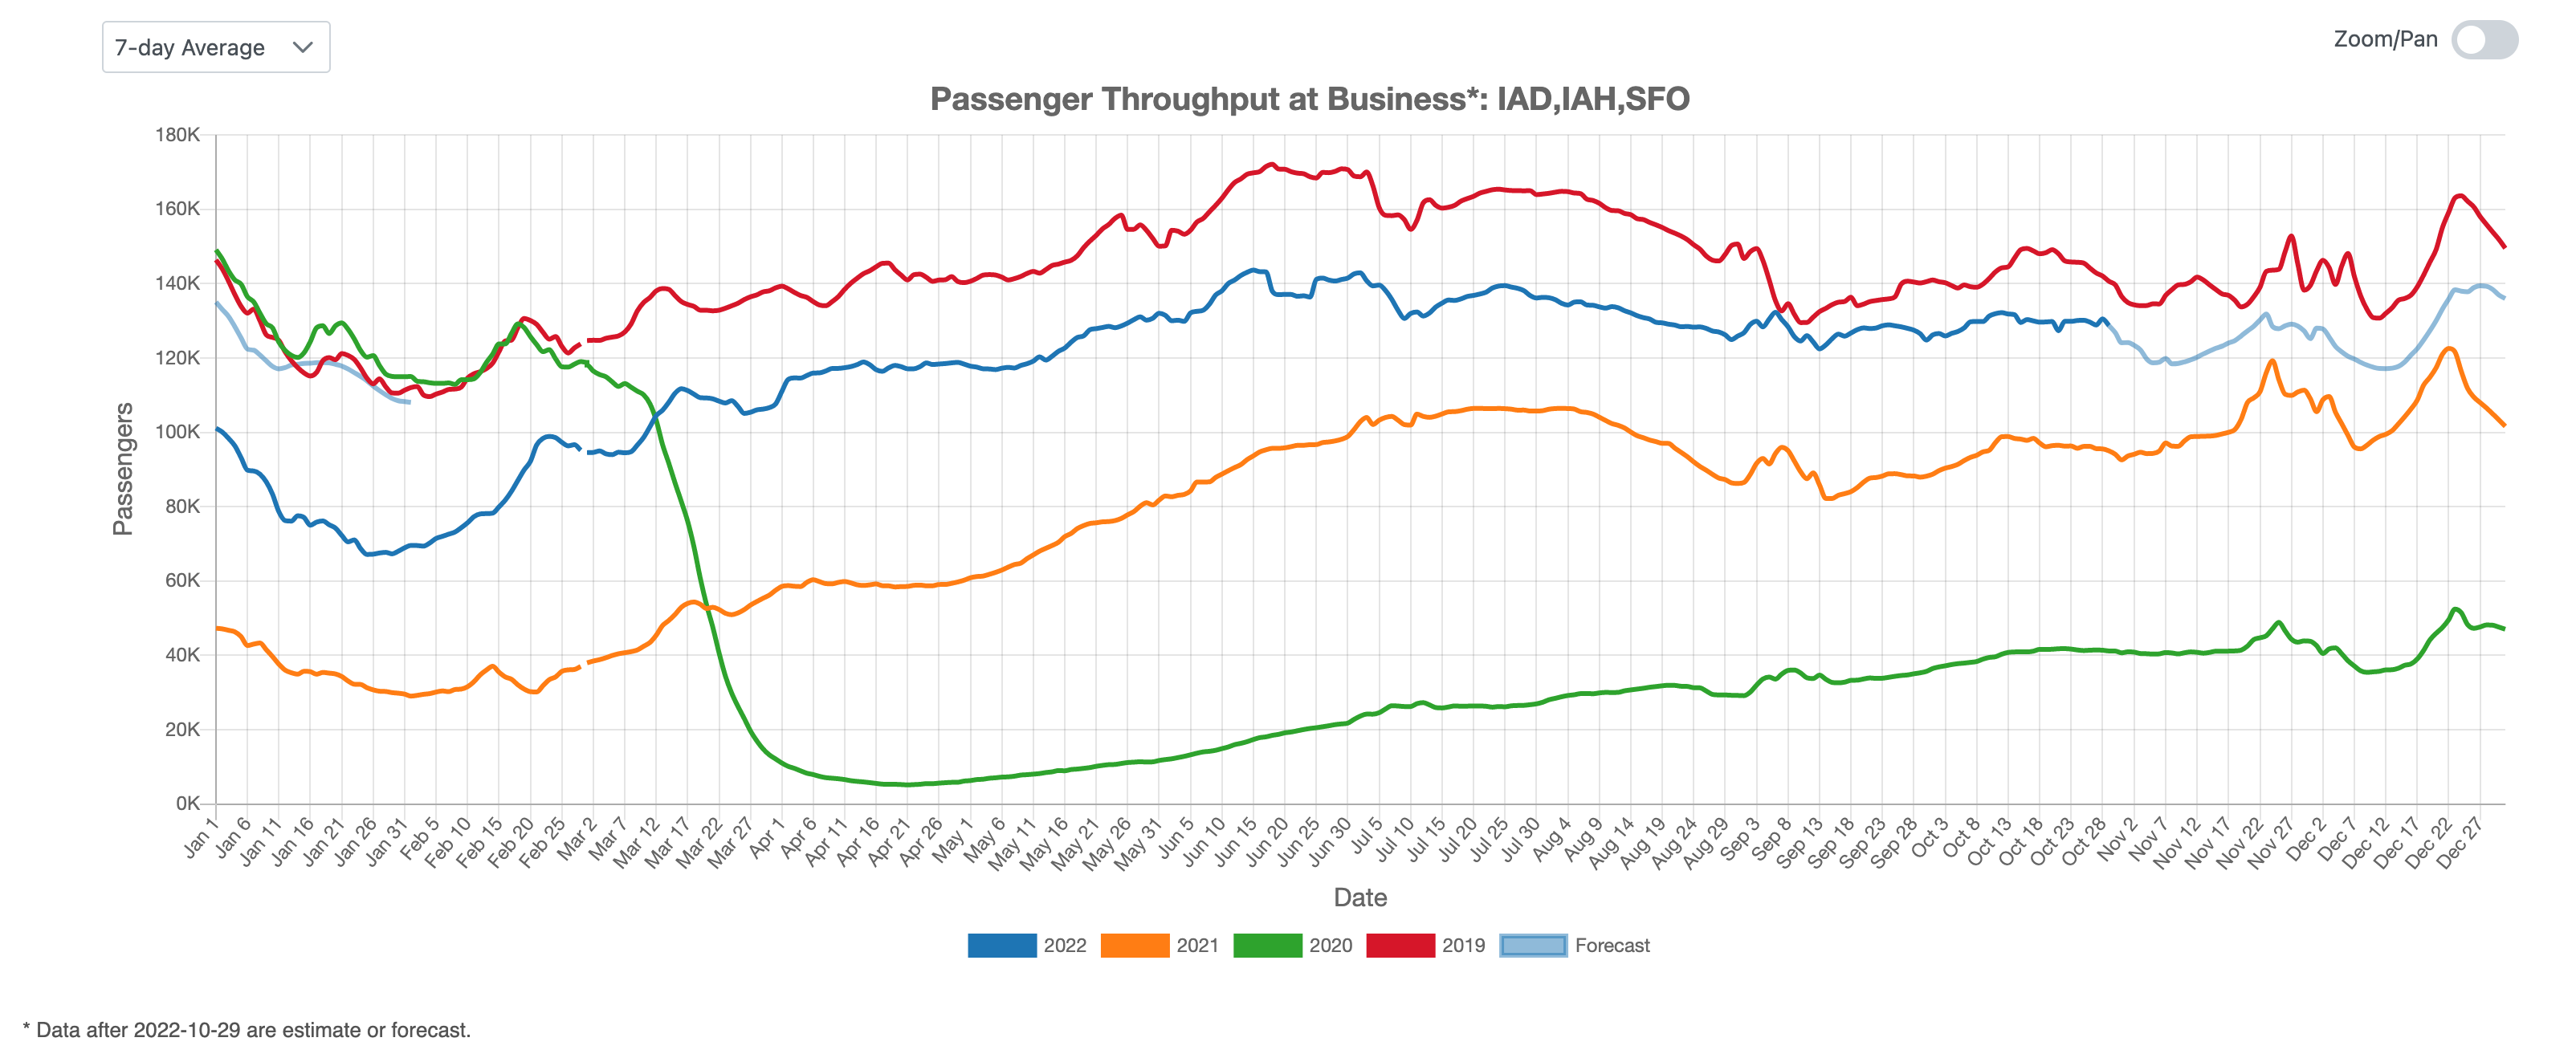
Figure 5: US Business Air Traffic Indicator
To summarize, US air traffic rebounded strongly after Hurricane Ian. In the next two months, total traffic will be higher than last year but lower than the pre-pandemic year.