Overall air traffic was retrieved from the summer peak season, but average airfare stopped the decline! The preliminary true O&D level data released by FlightBI today shows that passenger volume dropped from August 2022 to September 2022 by 4% while the average airfare barely changed.
Volume Trend
US domestic traffic by true O&D decreased from 48.7 million passengers in August to 46.8 million in September, which is higher than the pre-pandemic level of 45.9 million in September 2019! The US international traffic also declined from 18.5 million in August to 15.9 million in September. The decline from August to September is a normal seasonality as families finish their vacation trips before schools start in September.
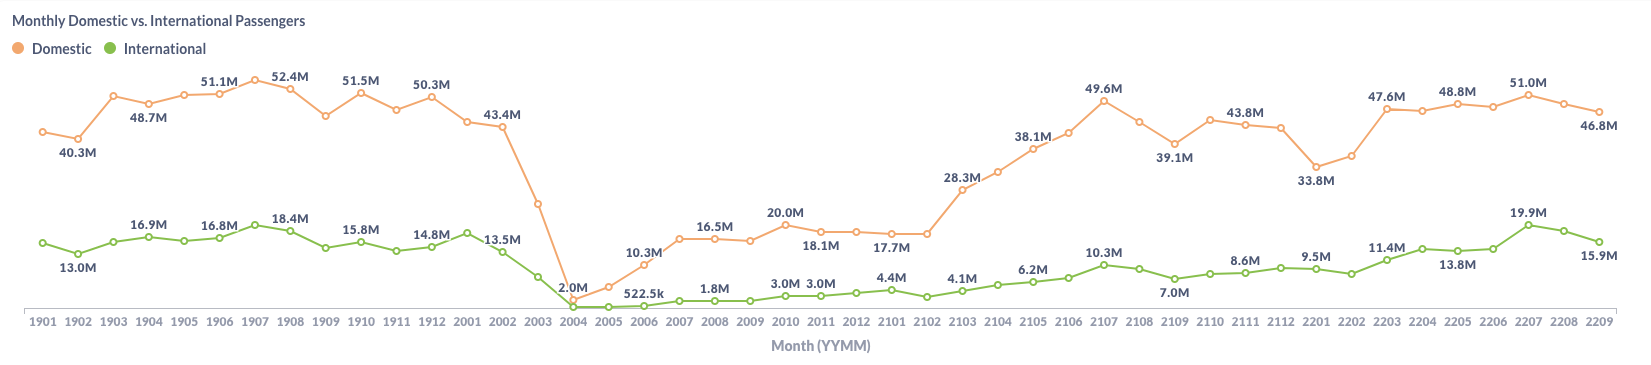
Figure 1: US Domestic and International Air Traffic by Month
Airfare Trend
Average domestic gross fares kept at $203 in September, while average net fares decreased by 0.5% from $176 to $175.
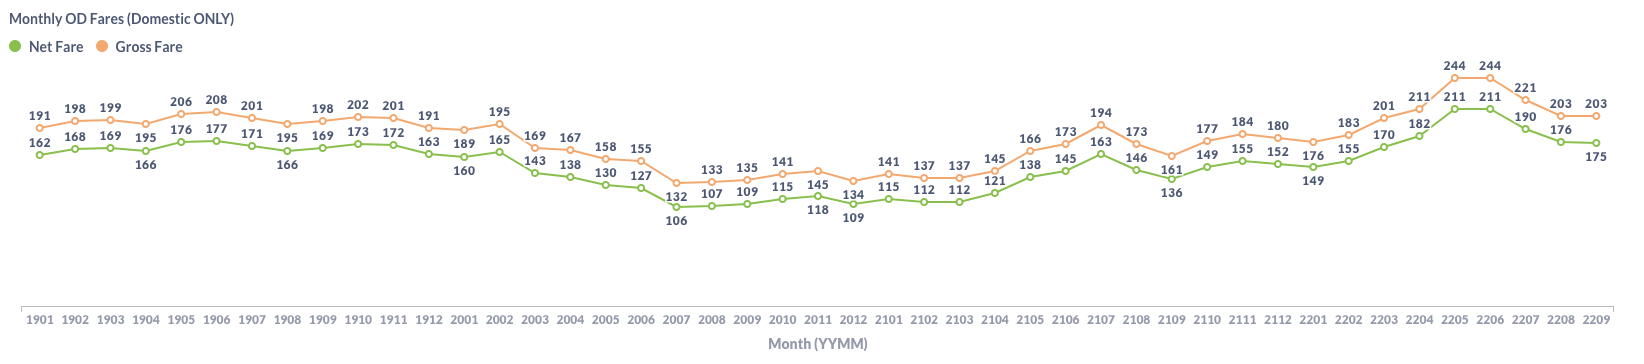
Figure 2: US Domestic Average Airfare by Month
Airfare did not decline because fuel prices increased again. As shown in the chart below provided by EIA, the US jet fuel price rebounded in September and peaked again in October. Given the high fuel cost and increased compensation, it is unlikely that US airlines will lower fares in the near future.
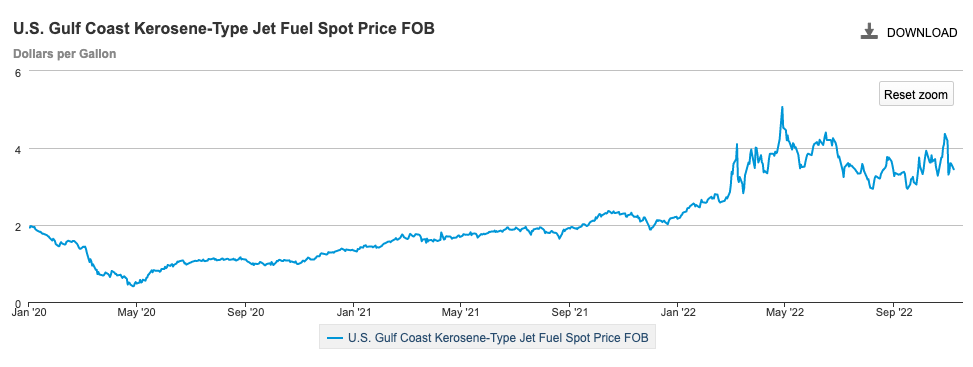
Figure 3: US Jet Fuel Price
Load Factor Trend
The average load factor in September was 79.2%, almost unchanged from August. As shown in Figure 4 below, both traffic and capacity decreased in September.
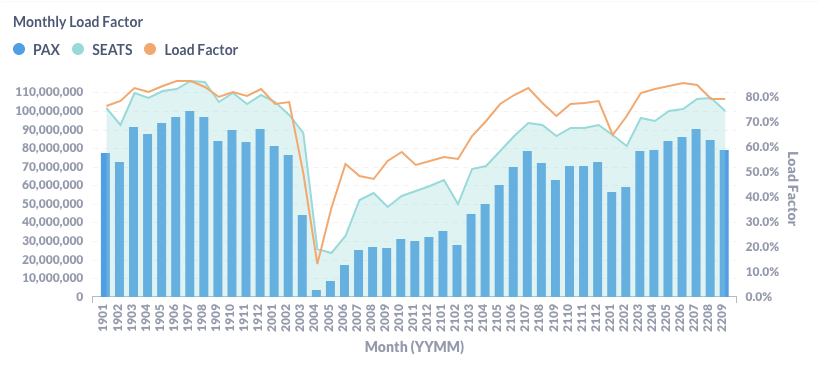
Figure 4: US Airlines’ Average Load Factor by Month
Month Over Month Comparison
From August to September, most major US airlines carried less passenger traffic. But Spirit(NK) had a 21.4% growth, which helped Spirit to carry more passengers than what they did in 2019 in the third quarter. Southwest (WN) also carried more passengers per day in September than in August, but total traffic decreased slightly since September has one day less than August.
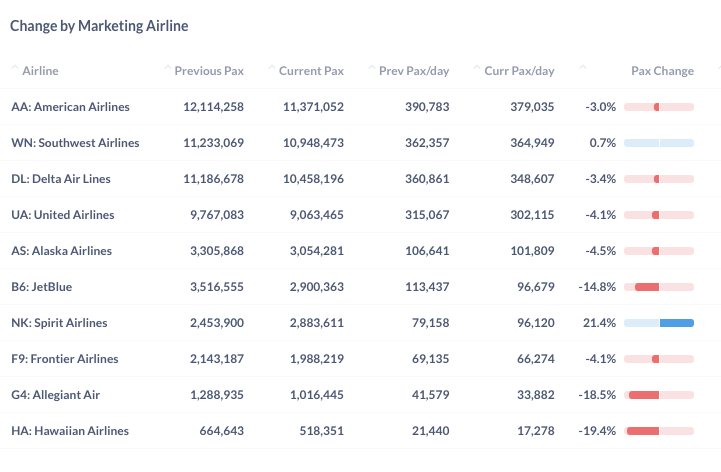
Figure 5: Air Traffic by Dominant Marketing Airlines in September 2022 (Current) vs. August 2022 (Previous)
Traffic change at top airports is mixed. Phoenix(PHX), Las Vegas(LAS), and Atlanta(ATL) gained more traffic, while New York(EWR and JFK) lost the most. Orlando(MCO) and Miami(MIA) also generated less traffic because of Hurricane Ian.
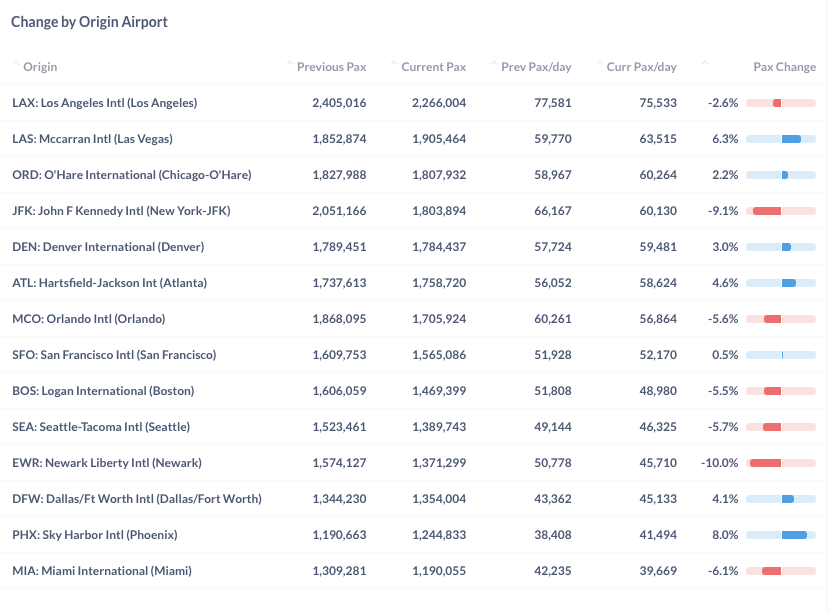
Figure 6: Air Traffic by Top Origin Airports in September 2022 (Current) vs. August 2022 (Previous)
Year Over Year Comparison
Compared to the same month last year, all major US airlines had achieved great growth. Spirit(NK) and United(UA) led with a year-over-year growth rate of 32.3% and 31.4%, respectively.
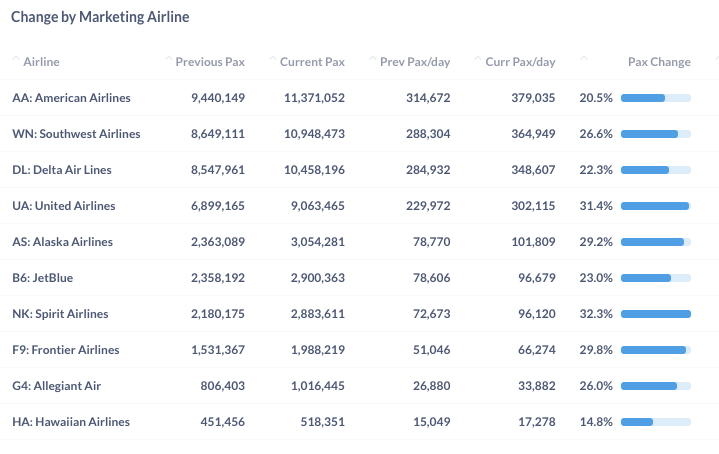
Figure 7: Air Traffic by Dominant Marketing Airlines in September 2022 (Current) vs. September 2021 (Previous)
Growth by airport is also positive, but with higher variance. New York’s two airports increased traffic by 62.4% (JFK) and 34.7% (EWR), due to the rebound in international traffic and business trips. San Francisco (SFO) and Boston (BOS) generated 68.3% and 52.2% more passengers than last year. Among the top airports, Denver (DEN) has the smallest but still impressive growth of 17.0% because it has more domestic traffic portion than other large airports.
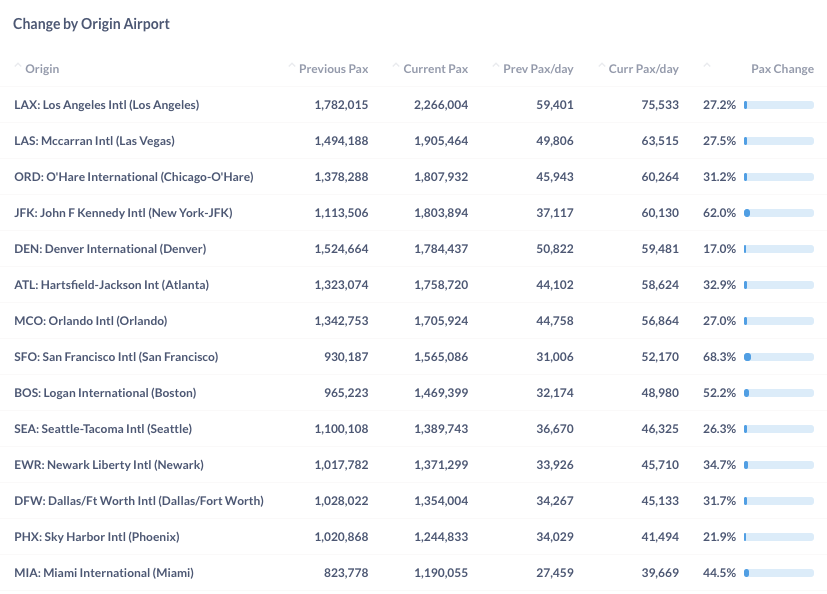
Figure 8: Air Traffic by Top Origin Airport in September 2022 (Current) vs. August September (Previous)
For more granular traffic and fare information by route and airline, please get in touch with service@flightbi.com or request a demo of Fligence USOD.