The US BizAv (Business Aviation) market has been booming since March 2021. This series of articles track the traffic trend of this market.
We define the BizAv market as part-135 on-demand for-hire private flying by business jets or certain turboprop planes. The numbers in the following charts exclude part-91 private flights. If you are interested in all flights by business jets, please get in touch with support@flightbi.com.
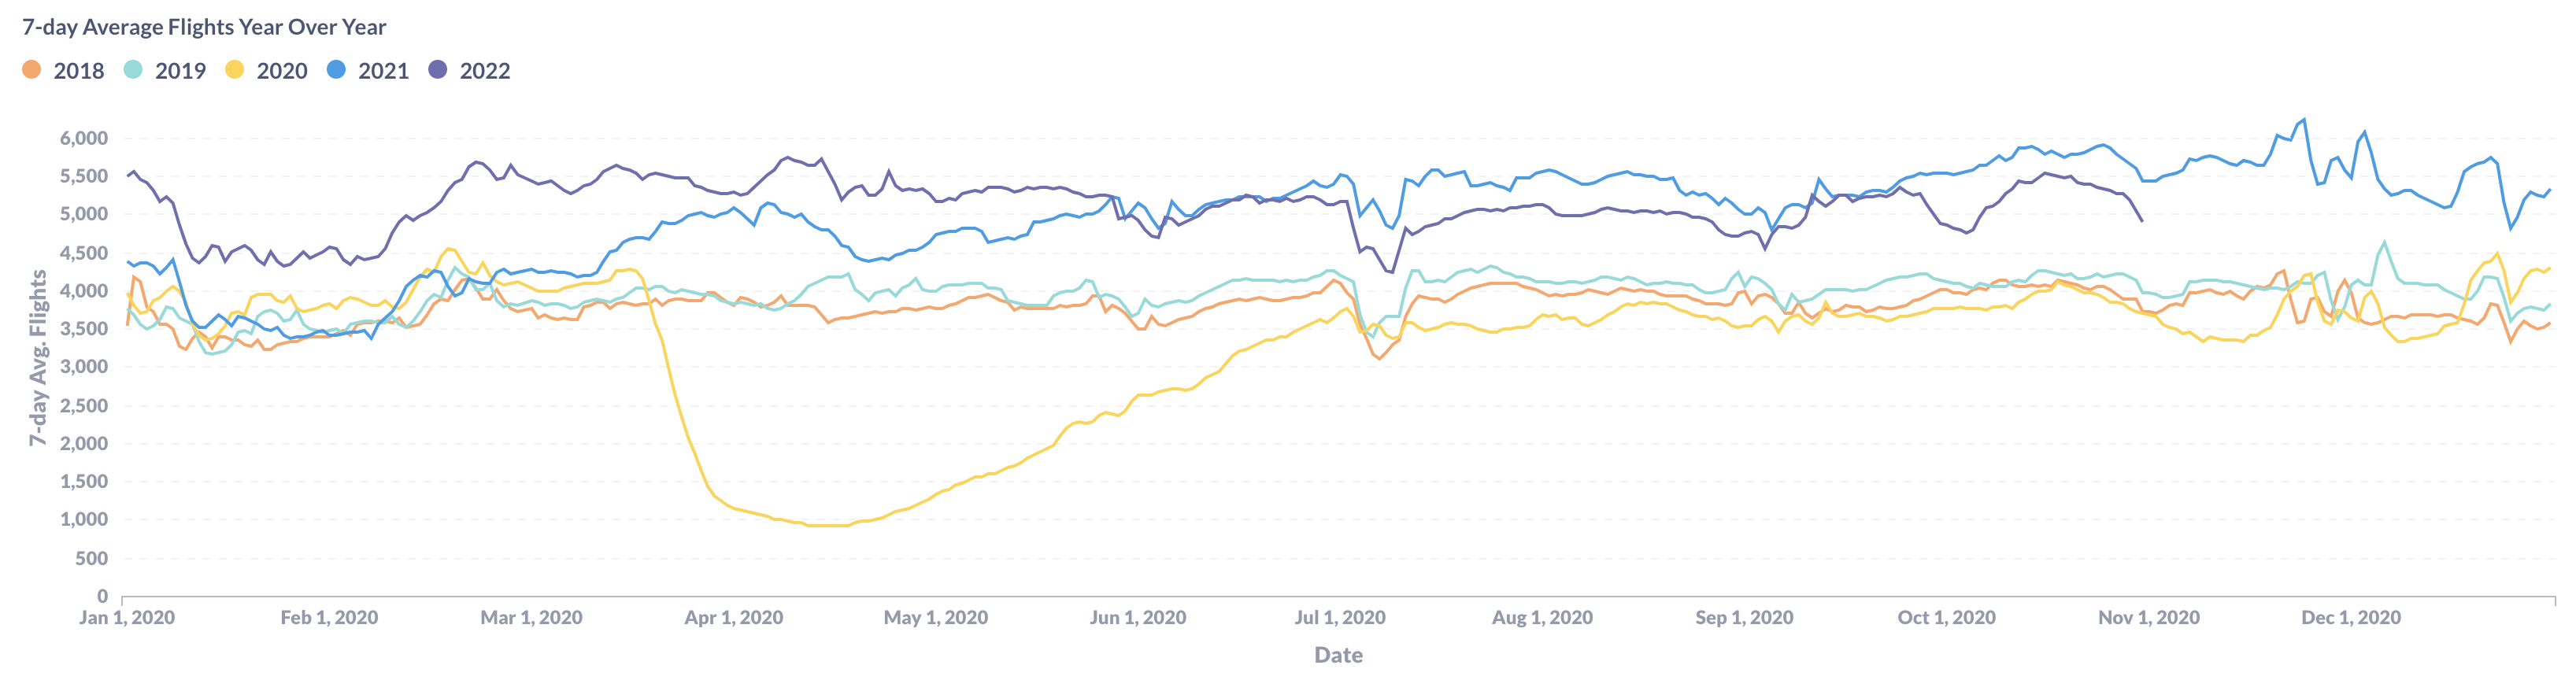
Figure 1: Year over Year Trend of the U.S. BizAv Market
As shown in Figure 1, the U.S. BizAv traffic went down at the beginning of October 2022, rebounded in the middle, and dropped again at the end. The decrease at the end is a normal seasonality, while the culprit of the decrease at the beginning is Hurricane Ian. Hurricane Ian became extratropical after September 30 and dissipated on October 2, 2022. It caused widespread damages across the southeast United States, especially Florida, one of the country’s top 3 business aviation origins. As a result, the 2022 volume could not reach the 2021 level, although it is still well above the pre-pandemic level.
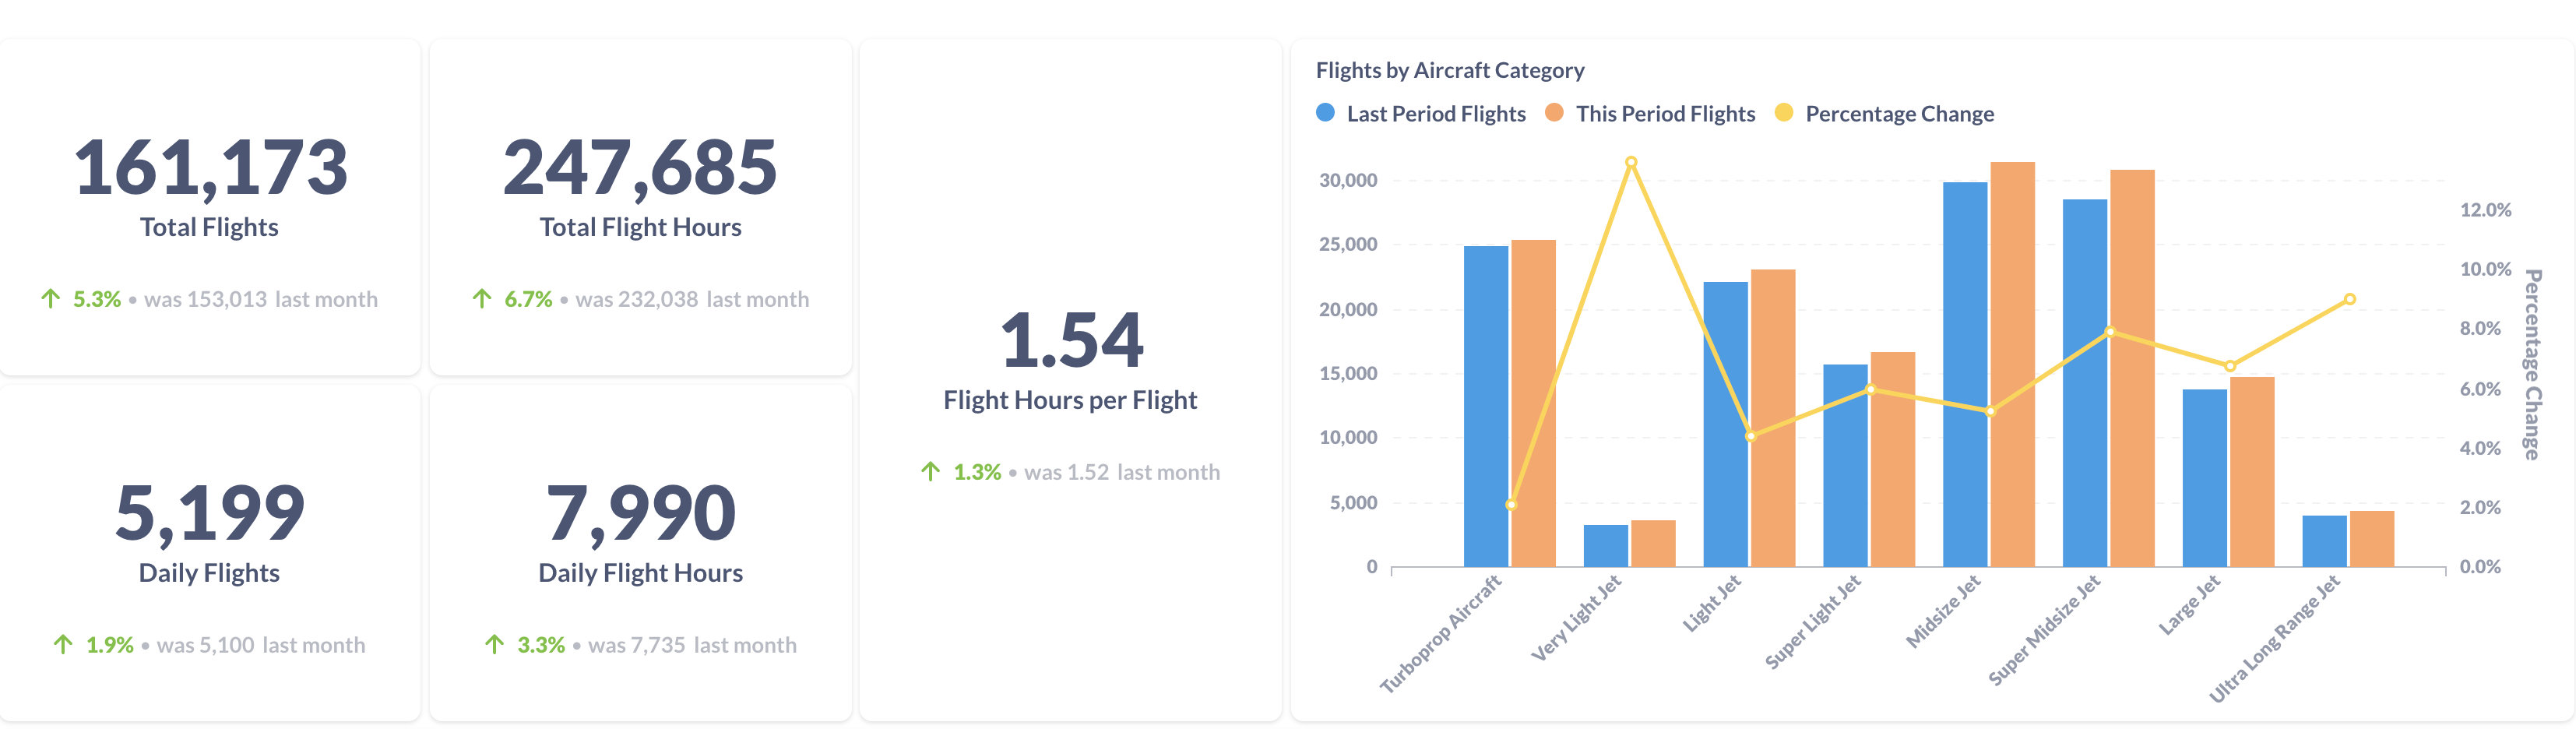
Figure 2: Comparison of the U.S. BizAv Flights This Month vs. Last Month
Figure 2 is a comparison between October 2022 and September 2022. The total traffic increased by 5.3%, partly because October has one day more than September and partly because the average daily traffic increased by 1.9%. Both total flight hours and daily flight hours have increased because long-stage jet flights increased faster than short-stage turboprop flights. The average flight length increased to 1.54 hours per flight in October.
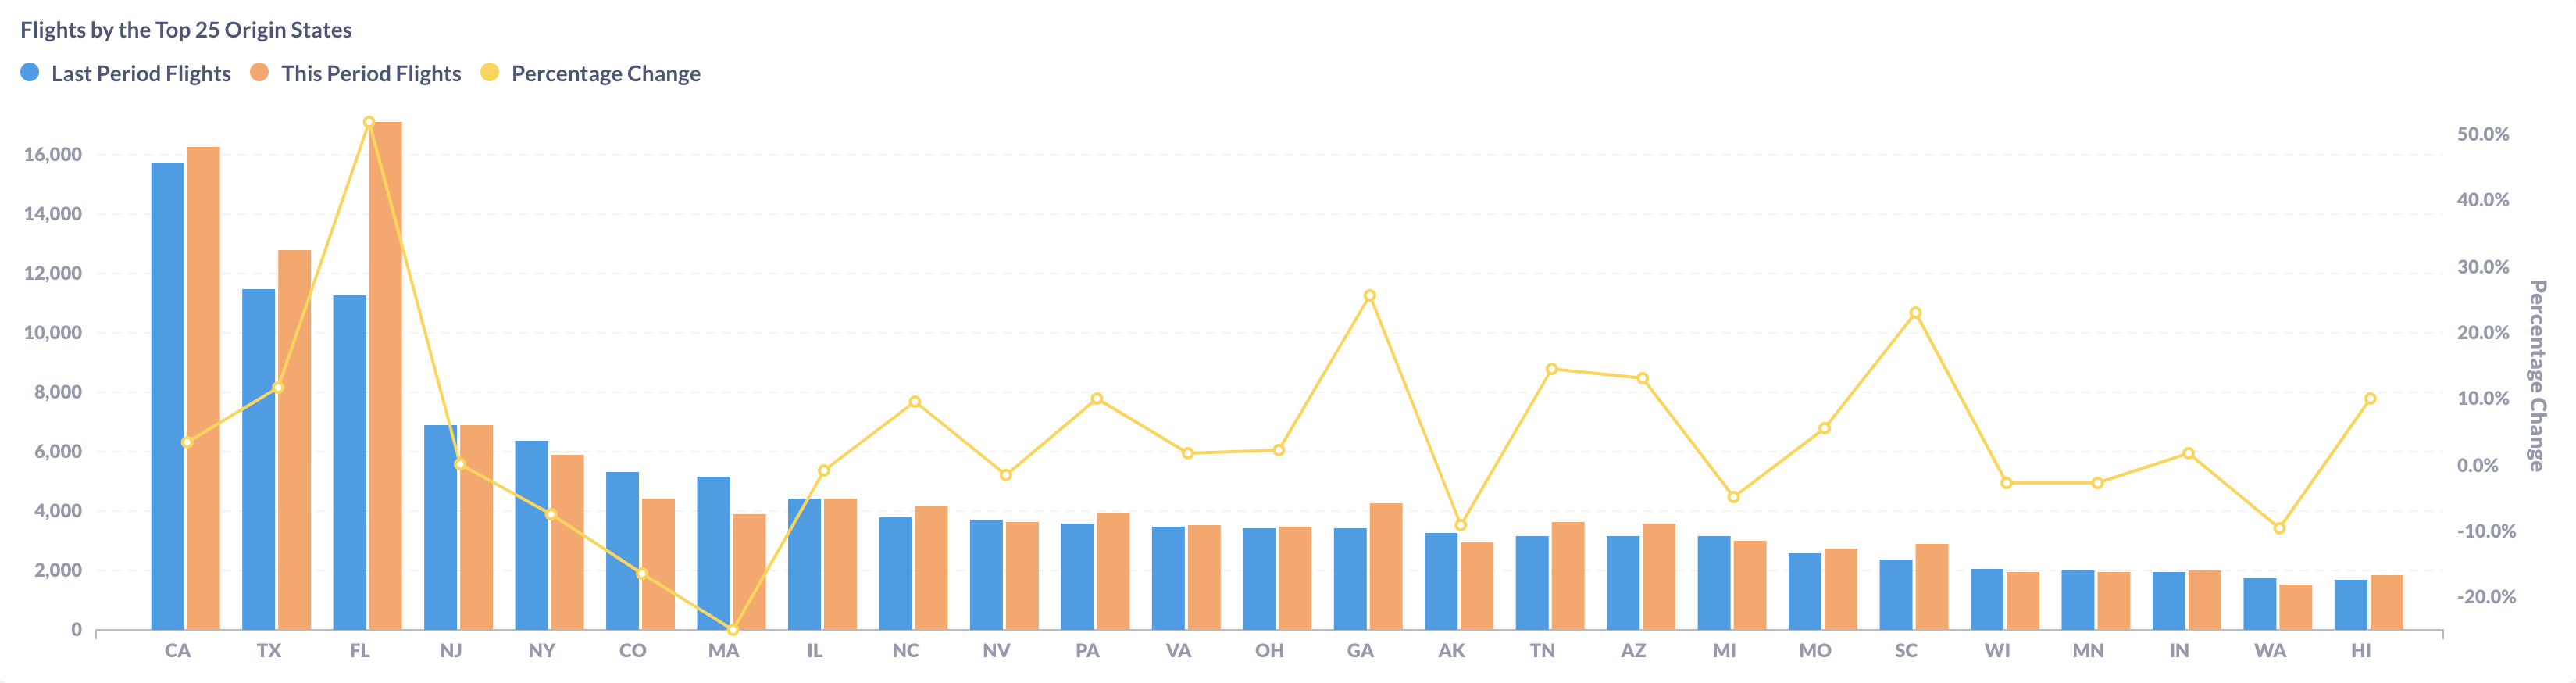
Figure 3: Comparison of the U.S. BizAv Flights by the Top 25 Origin States (This Month vs. Last Month)
Among the top 3 states – California(CA), Florida(FL), and Texas(TX), Florida returned to the No. 1 position. The dramatic 52% increase from FL is primarily because many flights in September were postponed to October, thanks to Hurricane Ian. Several states, including New York(NY), Colorado(CO), and Massachusetts(MA), had fewer flights in October than in September, but most other states had healthy month-to-month growth.
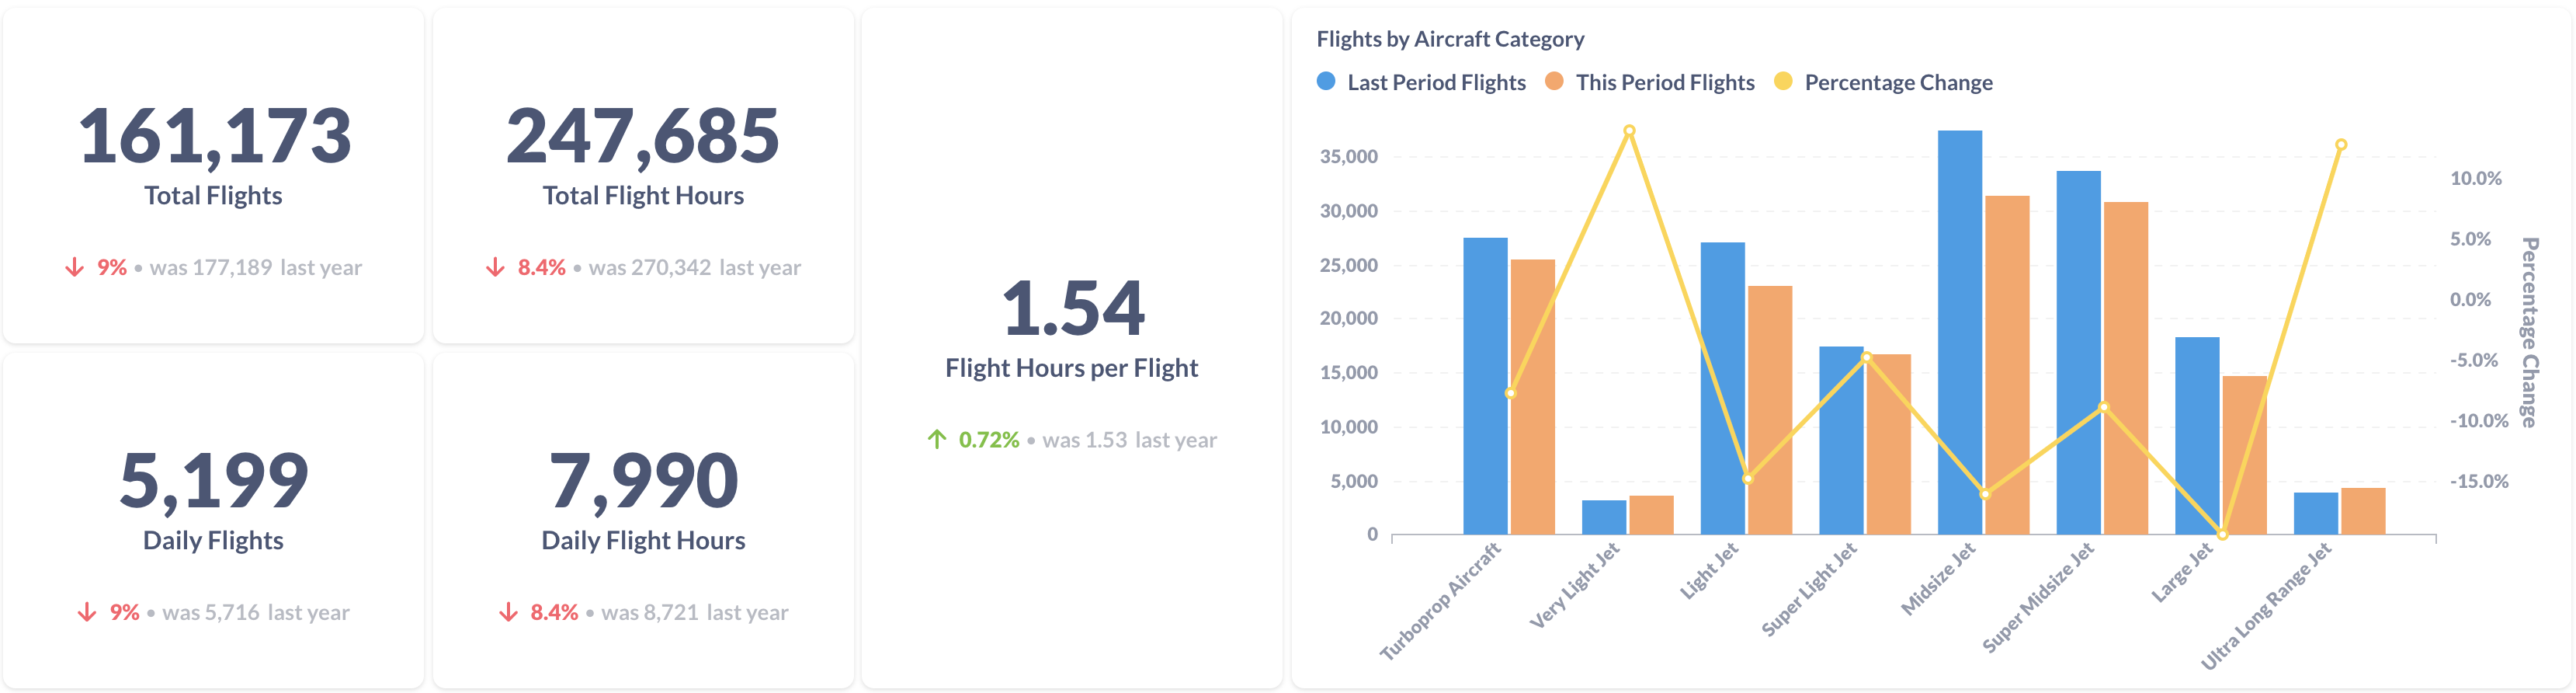
Figure 4: Comparison of the U.S. BizAv Flights This Year vs. Last Year
Compared to October last year, total business flights decreased by 9%. Total flight hours dropped by 8.4% because the average flight hours per flight increased by 0.7%. Only Very Light Jets and Ultra Long Range Jets have more flights than last year, but the total size of those two categories is very small.
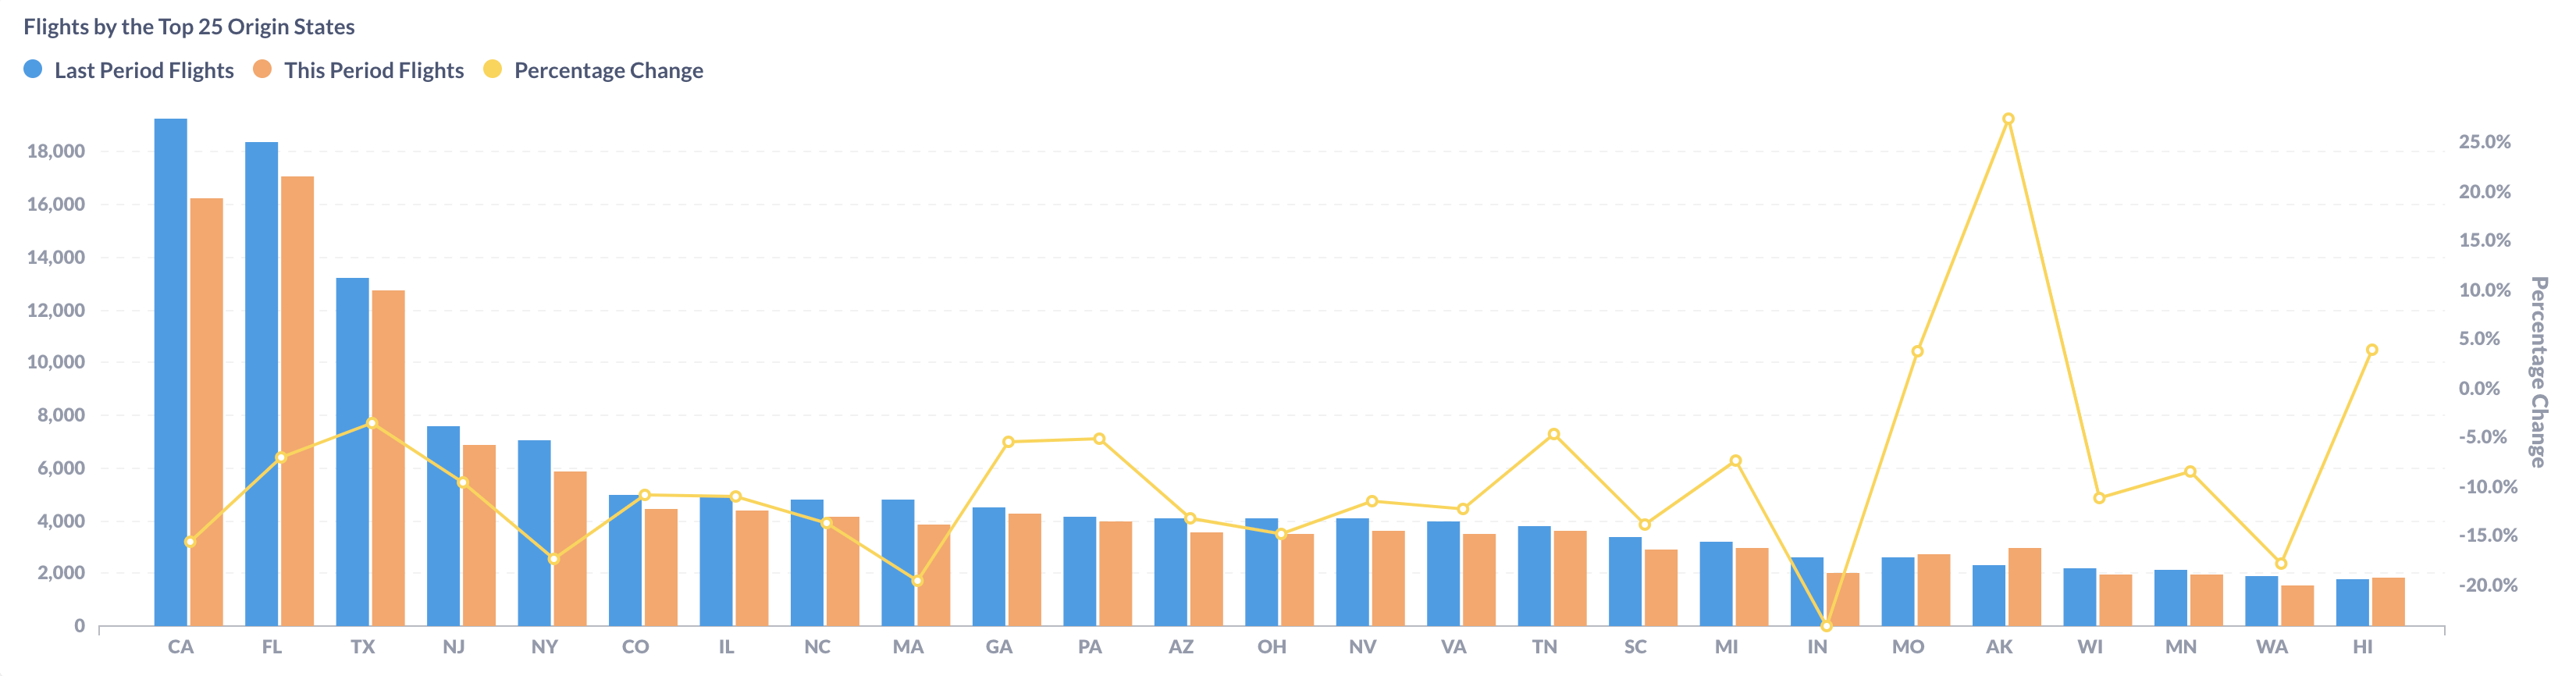
Figure 5: Comparison of the U.S. BizAv Flights by the Top 25 Origin States (This Year vs. Last Year)
Most origin states had a decrease in business flights from last year. California (CA) decreased by 15.6%, led by the Van Nuys Airport (KVN) with a 26% decline. Florida (FL) and Texas(TX) also dropped by 6.9% and 3.5% respectively.