The US BizAv (Business Aviation) market has been booming since March 2021. This series of articles track the traffic trend of this market.
We define the BizAv market as part-135 on-demand for-hire private flying by business jets or certain turboprop planes. The numbers in the following charts exclude part-91 private flights. If you are interested in all flights by business jets, please get in touch with support@flightbi.com.
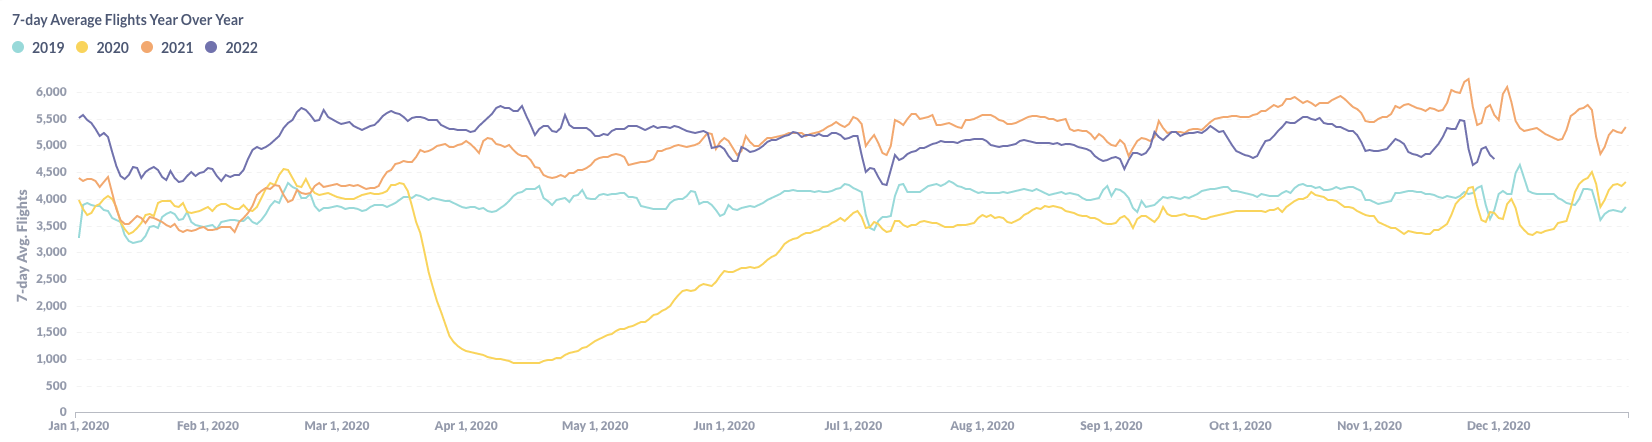
Figure 1: Year over Year Trend of the U.S. BizAv Market
As shown in Figure 1, the U.S. BizAv traffic went up to a peak before Thanksgiving and then dropped during the holiday in November 2022. This is a normal seasonality. Overall, the US BizAv industry is experiencing a slowly declining trend, although the total volume is still above the pre-pandemic level.
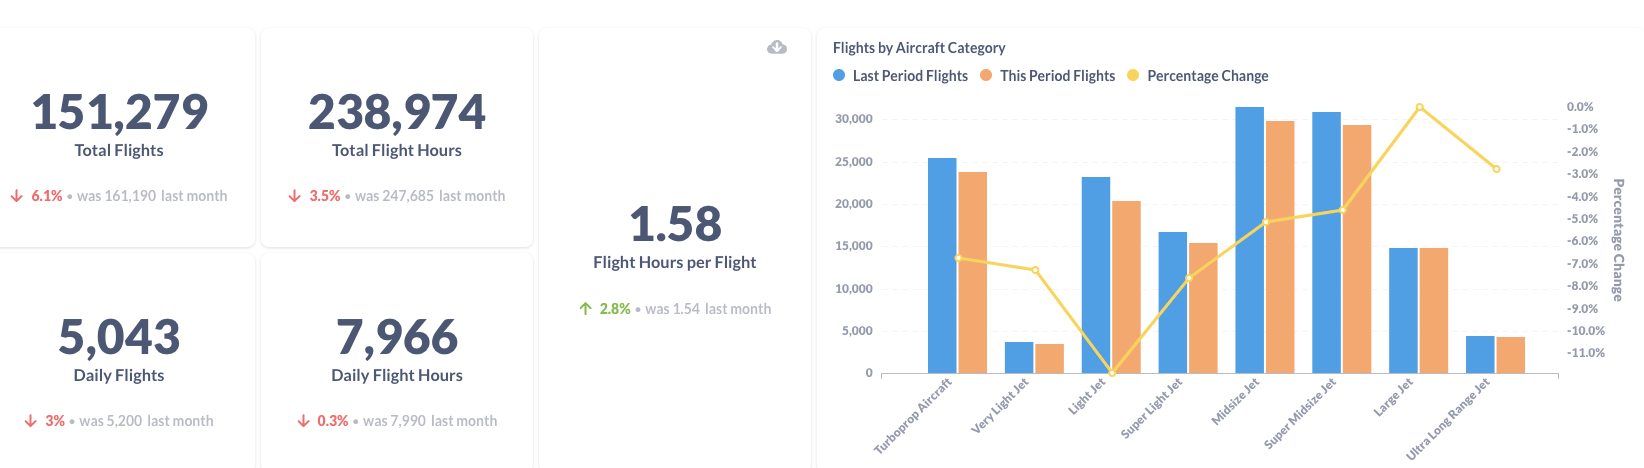
Figure 2: Comparison of the U.S. BizAv Flights This Month vs. Last Month
Figure 2 is a comparison between October 2022 and November 2022. The total traffic decreased by 6.1%, partly because October has one day more than November and partly because the average daily traffic decreased by 3%. The Flight Hours per Fight increased by 2.8%. Even so, total flight hours and daily flight hours have decreased by 3.5% and 0.3%, respectively. Flights by Large Jet barely changed from last month. All other aircraft types had fewer flights in November than in October.
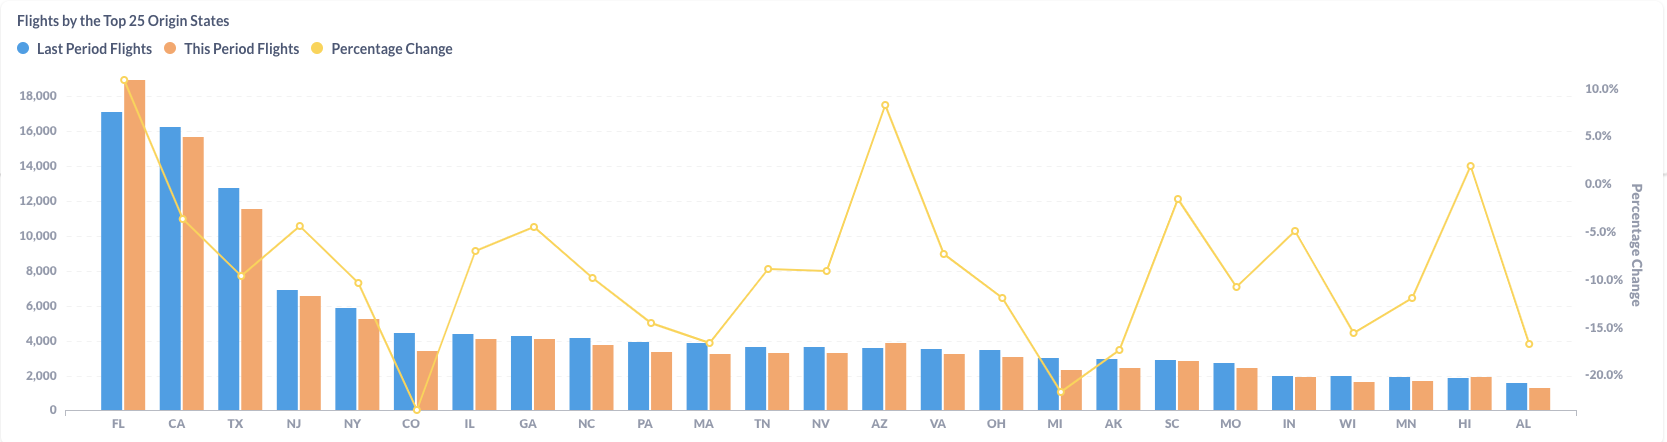
Figure 3: Comparison of the U.S. BizAv Flights by the Top 25 Origin States (This Month vs. Last Month)
Two largest business aviation airports in Florida (FL)) – West Palm Beach (KPBI) and Miami (KMIA) – both achieved more than 27% growth from October, which solidified Florida’s number 1 position in the BizAv industry. The other two large origin states – California(CA) and Texas(TX) – declined by 3.7% and 9.6%. Most other states except Arizona (AZ) and Hawaii (HI) also had fewer flights in November than in October.
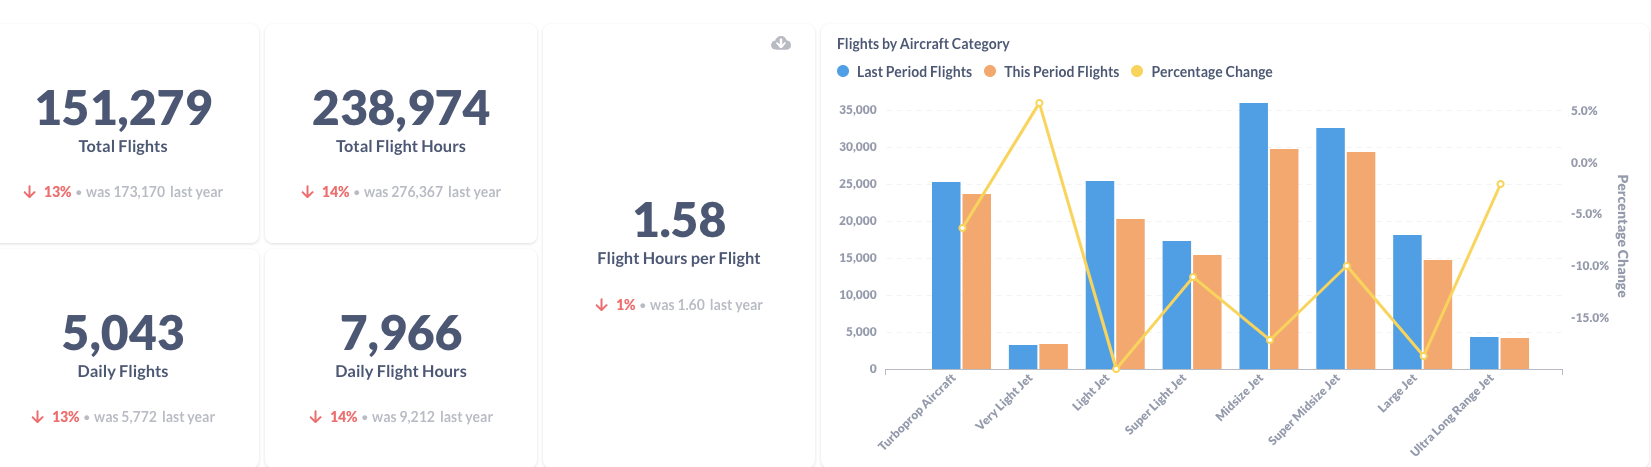
Figure 4: Comparison of the U.S. BizAv Flights This Year vs. Last Year
Compared to November last year, total business flights decreased by 13%. Total flight hours dropped by 14% because the average flight hours per flight also shrank by 1%. Although the smallest category – Very Light Jets – achieved a 5.8% growth, all other aircraft types had fewer flights than last year. The decreasing trend was also accelerated in November.
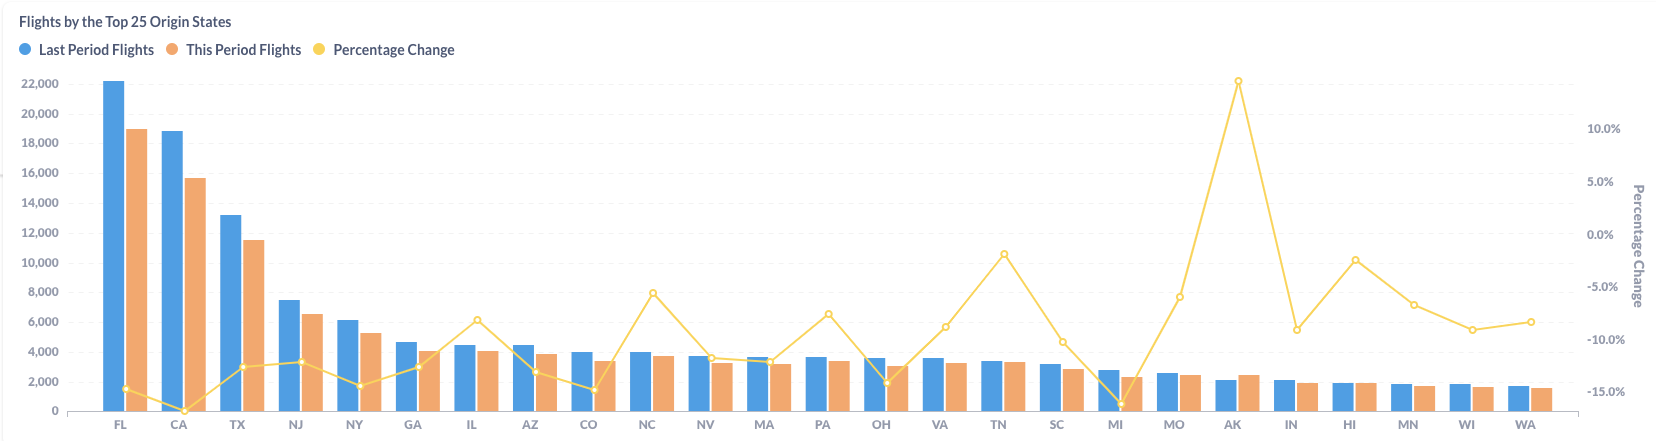
Figure 5: Comparison of the U.S. BizAv Flights by the Top 25 Origin States (This Year vs. Last Year)
The flight contraction happened in almost all top states except Alaska(AK). Florida (FL) decreased by 14.7% but was still the largest origin state in November. California (CA) and Texas(TX) dropped by 16.8% and 12.6%, respectively.