Daily and hourly airport traffic is crucial for businesses related to airports, including airport authorities, airlines, retailers, ground handlers, rental car companies, and hotels. If you belong to any of these industries, utilizing daily airport traffic data can help you plan your operations, schedule your resources, forecast revenue, and plan budgets more accurately. Additionally, this data can help you target your marketing and promotional efforts more specifically, leading to more effective business strategies.
FlightBI collects and normalizes the airport passenger throughput data from US Transportation Security Administration (TSA). In addition, it has developed a product called Fligence TSA, which features a wide variety of data visualizations. FlightBI is currently offering a two-week, no-obligation trial of Fligence TSA for you to explore valuable insights from the airport traffic data.
This article summarizes US air traffic using the aforementioned tool, utilizing actual airport-level data as of Sep. 30th, 2023. Our analysis will examine trends in different segments of air travel, such as domestic versus international flights and leisure versus business travel. To learn more about the specific airports chosen to represent these markets, please refer to this article.
US Overall Airport Traffic Status
Figure 1 illustrates that U.S. air traffic surpassed pre-pandemic 2019 levels around Labor Day this year and has consistently remained above that benchmark, suggesting a likelihood of continued growth beyond 2019 levels over the next three months.
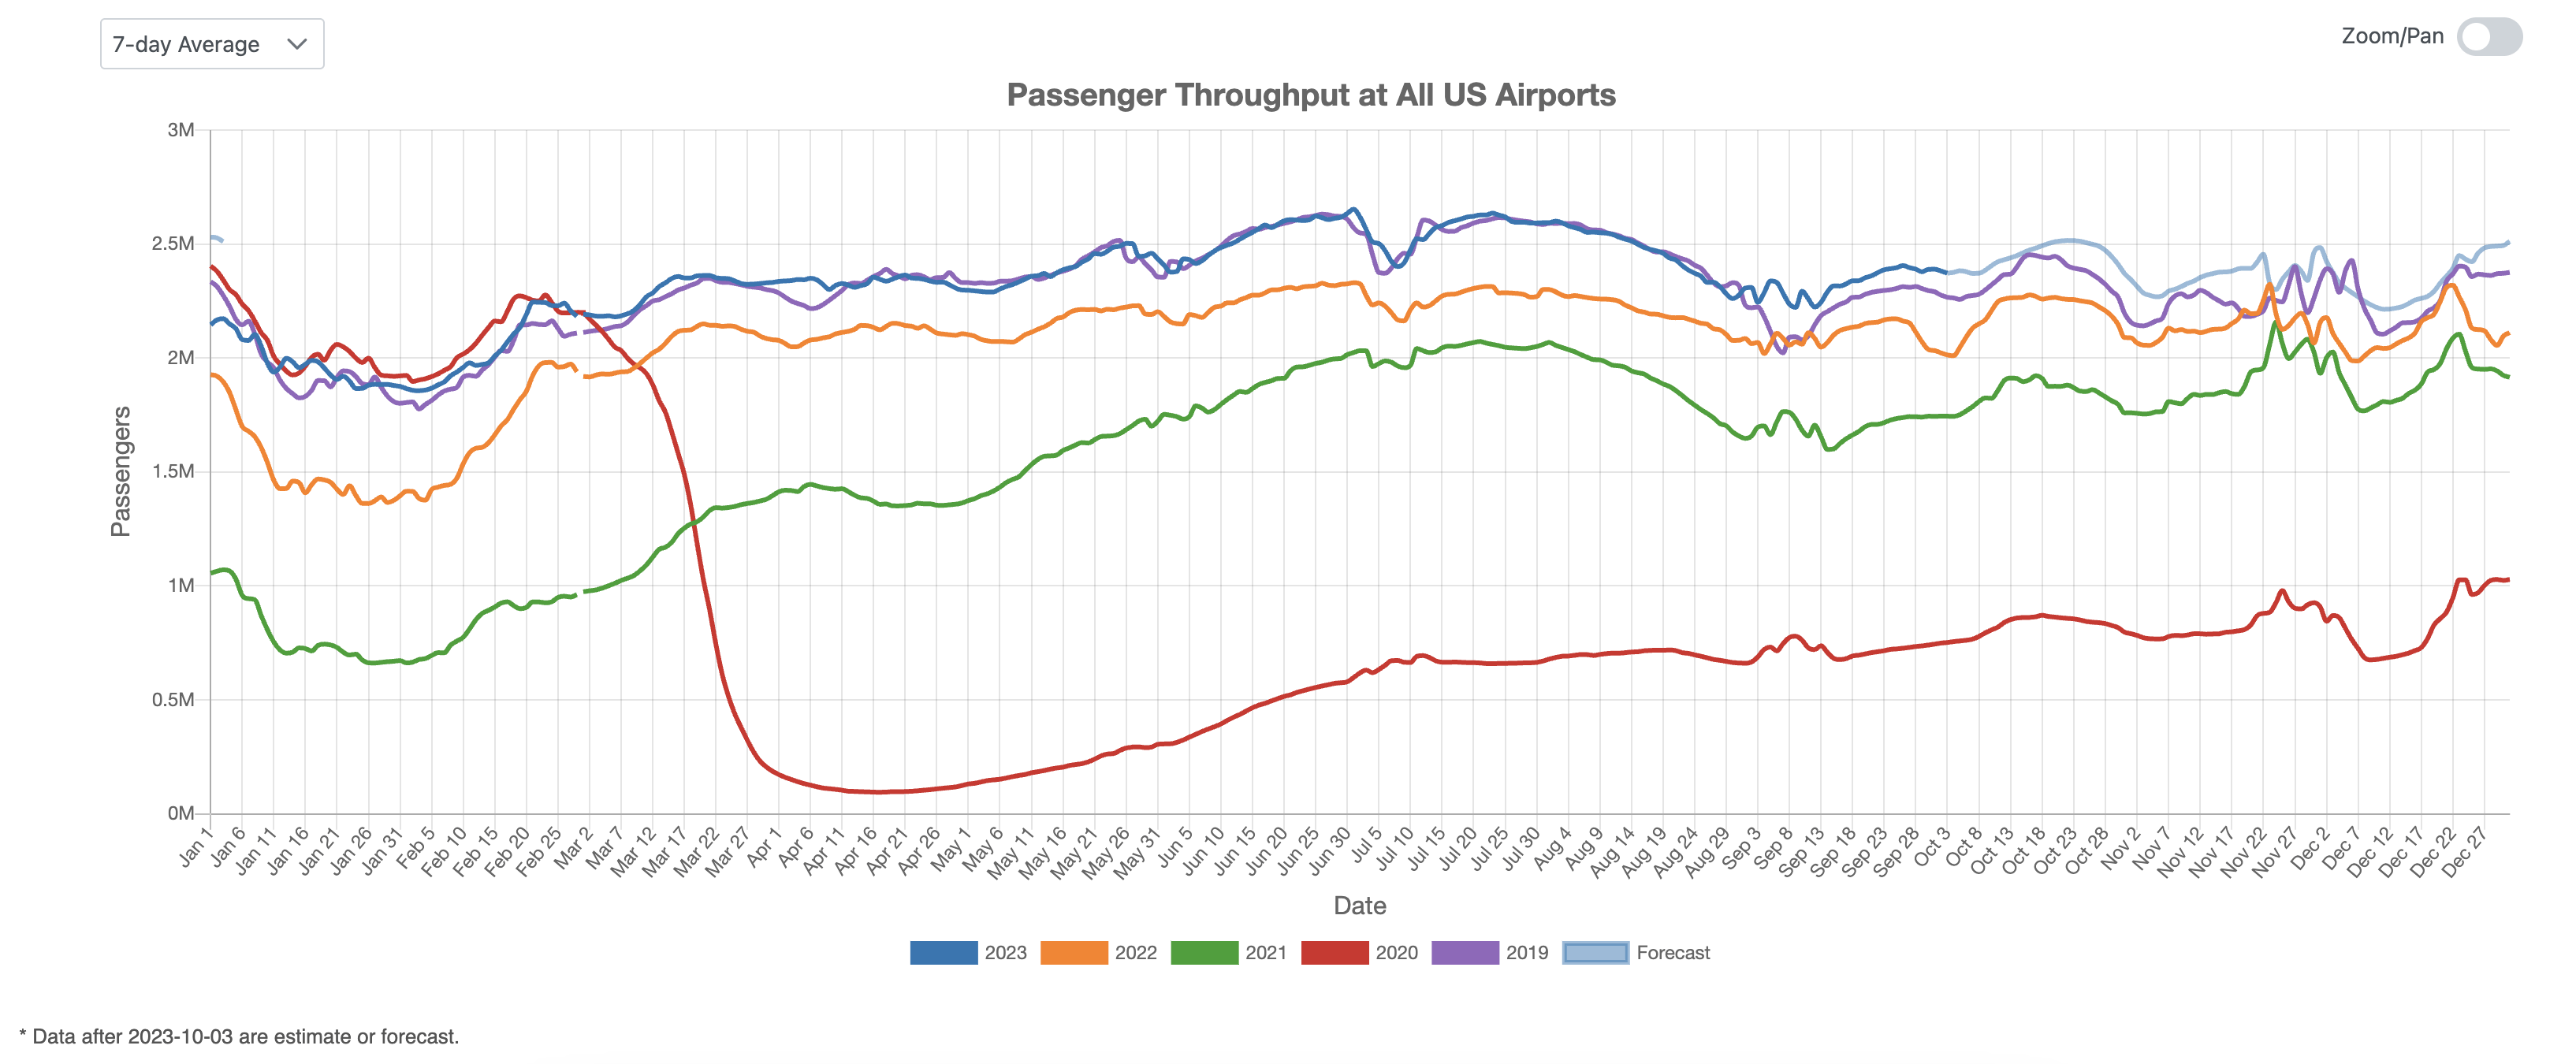
Figure 1: US Overall Air Traffic Trend
Domestic Airport Traffic Indicator
Figure 2 highlights the domestic U.S. air traffic trend, with a decline leading up to Labor Day followed by a September rebound, resulting in an overall volume exceeding 7-10% of 2019 levels in September. We anticipate strong growth in October, maintaining a 5% to 10% lead over the highest historical levels recorded.
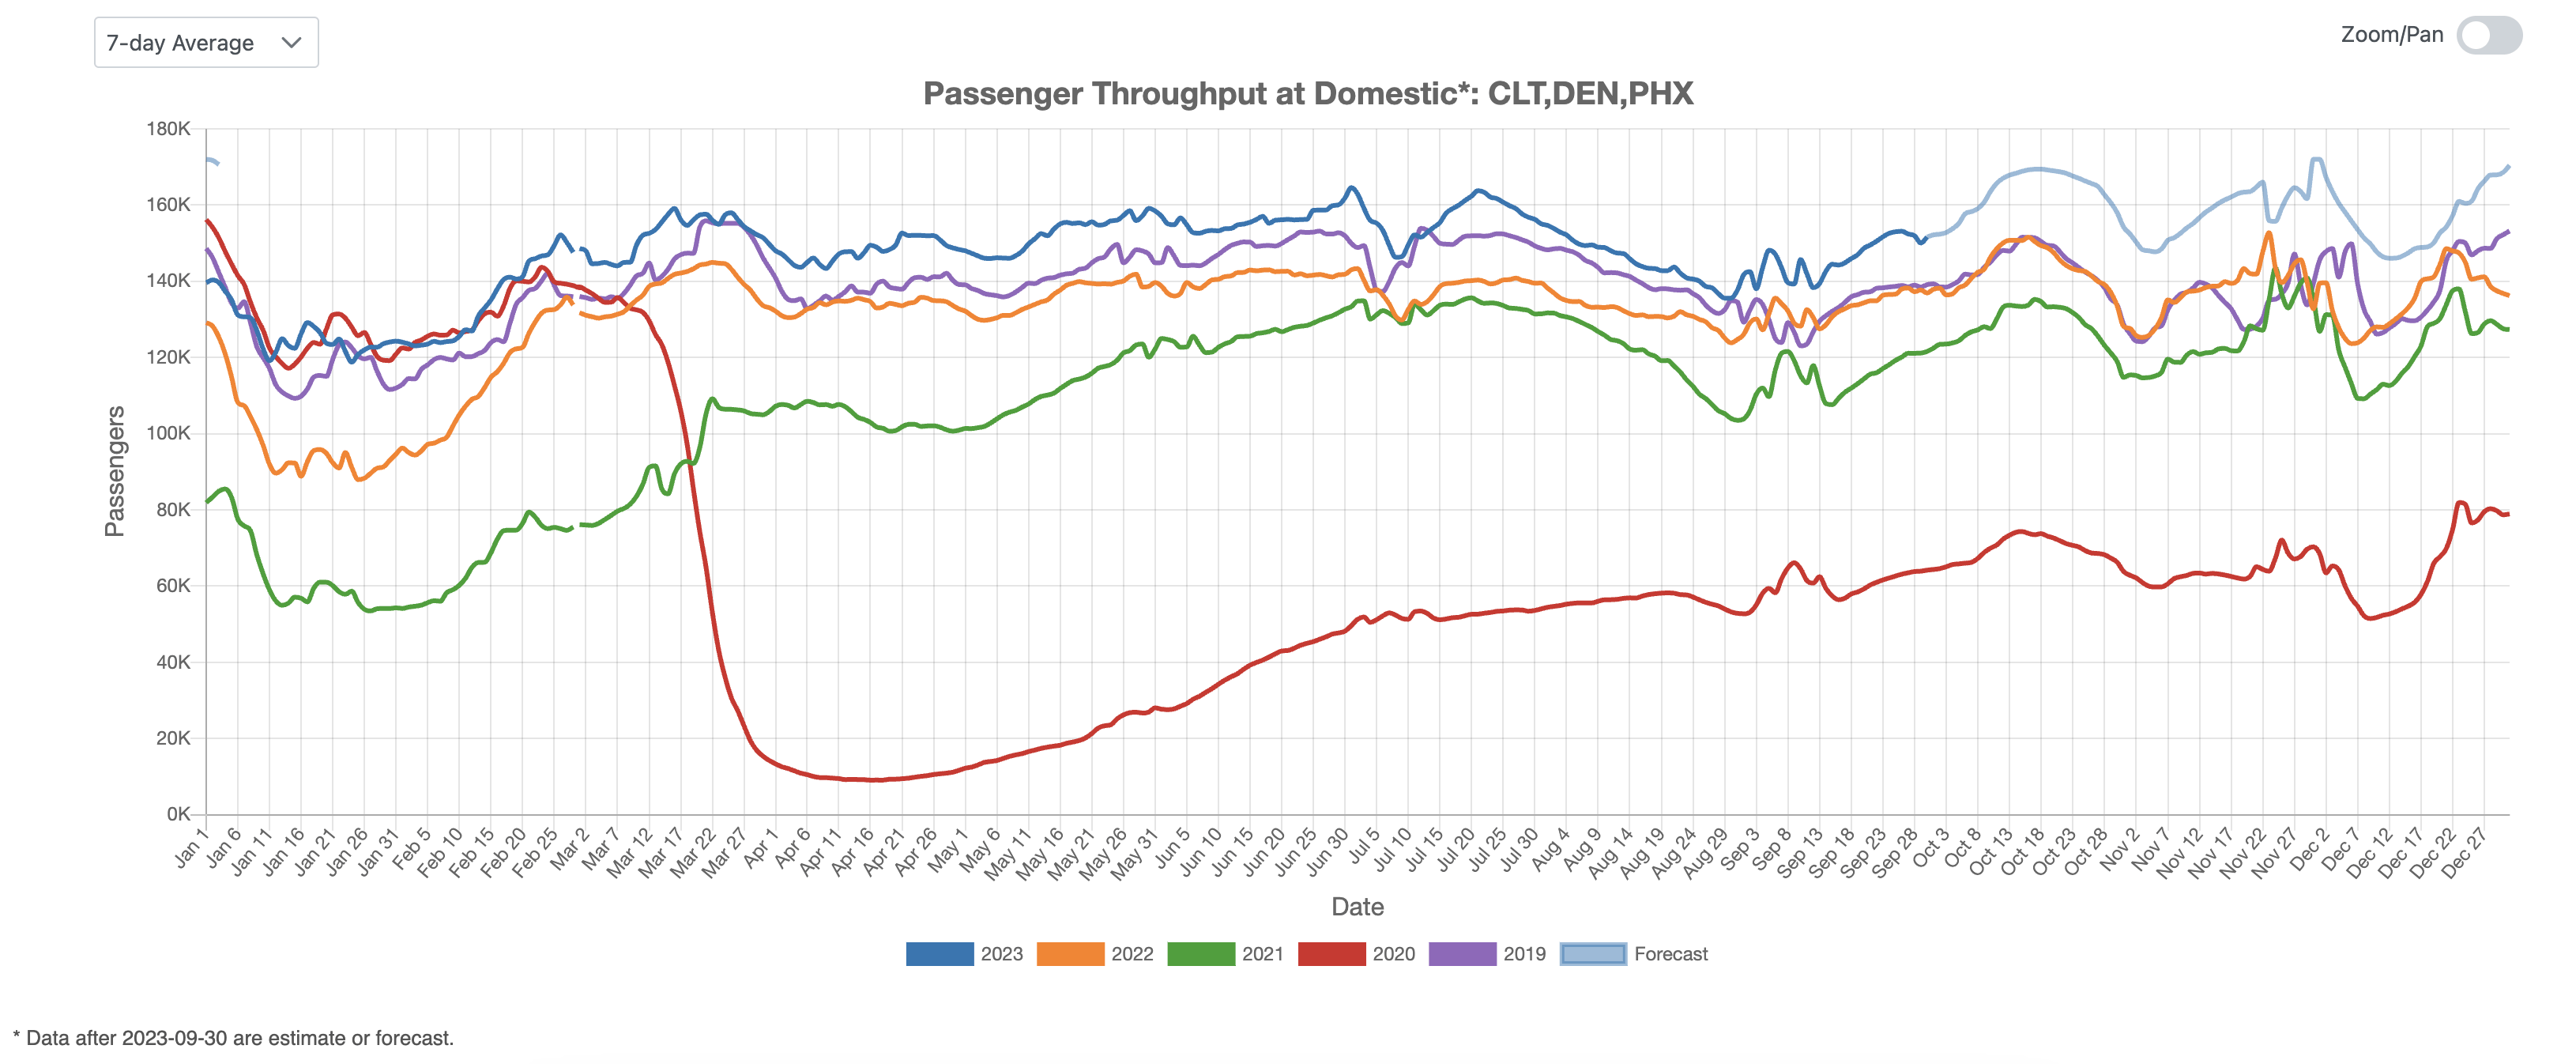
Figure 2: US Domestic Air Traffic Indicator
International Airport Traffic Indicator
Figure 3 displays the index of international air traffic in the U.S., where the 2023 curve falls between the 2022 and 2019 curves. We anticipate that international traffic for the remainder of the year will approach pre-COVID-19 levels.
Figure 3: US International Air Traffic Indicator
Leisure Air Traffic Indicator
In September, leisure air travel rebounded following a decline in August, and looking ahead at airline published schedules, we anticipate a surge in traffic during the 4th quarter, highlighting the ongoing resilience of the leisure air travel sector.
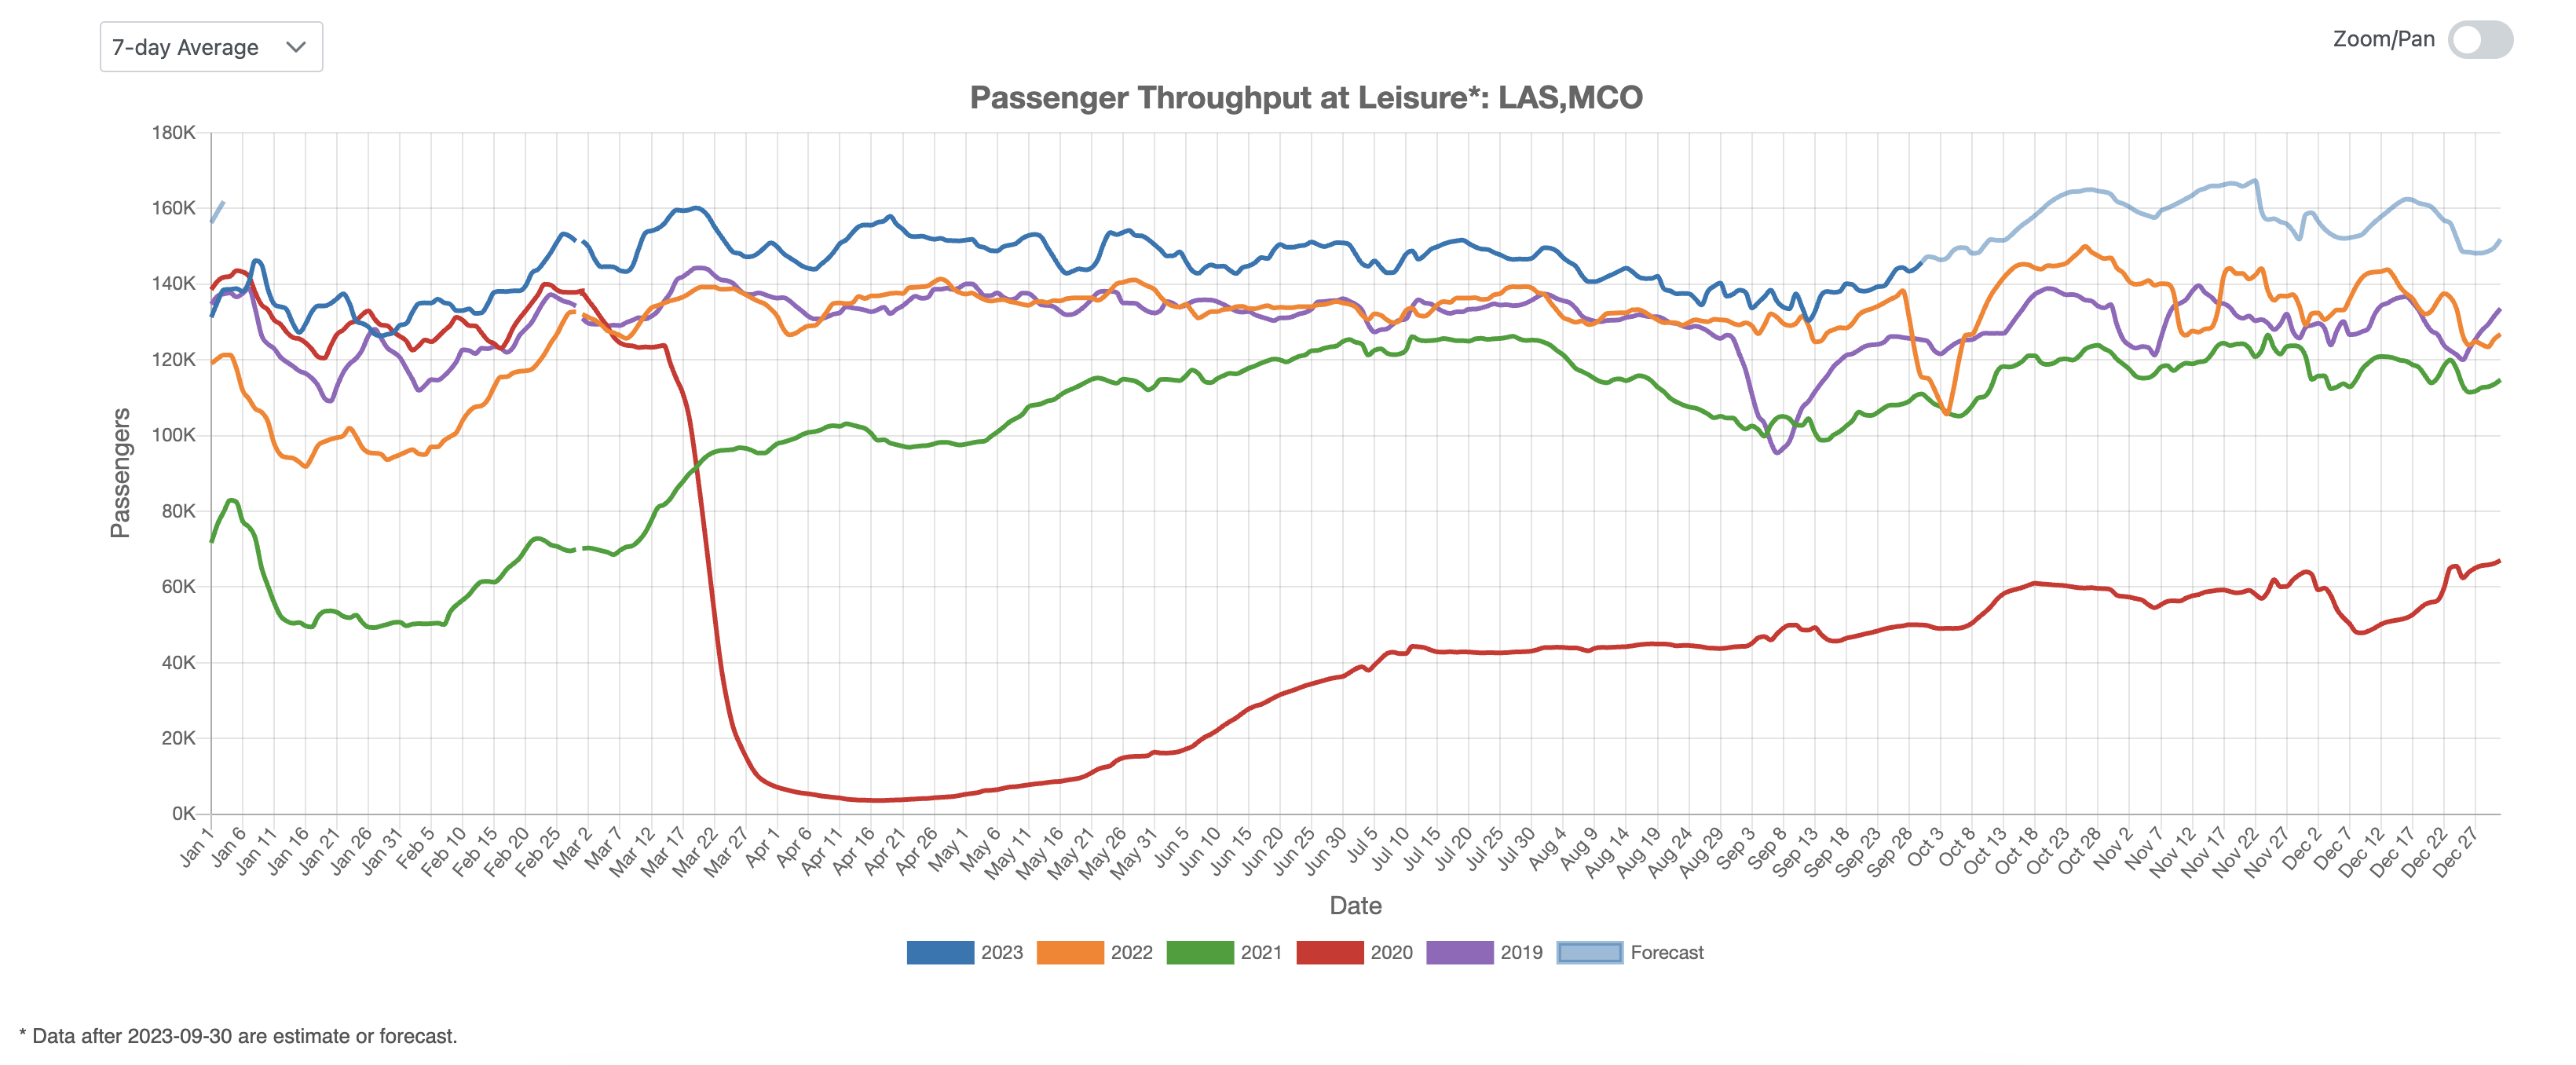
Figure 4: US Leisure Air Traffic Indicator
Business Air Traffic Indicator
Turning our attention to business-related air travel, Figure 5 underscores the stability of 2023’s business traffic, surpassing 2019 levels by 6-8%. Projections indicate that business air traffic is poised to exceed past historical peaks, offering an optimistic outlook for the sector’s recovery and suggesting potential growth beyond pre-pandemic levels.
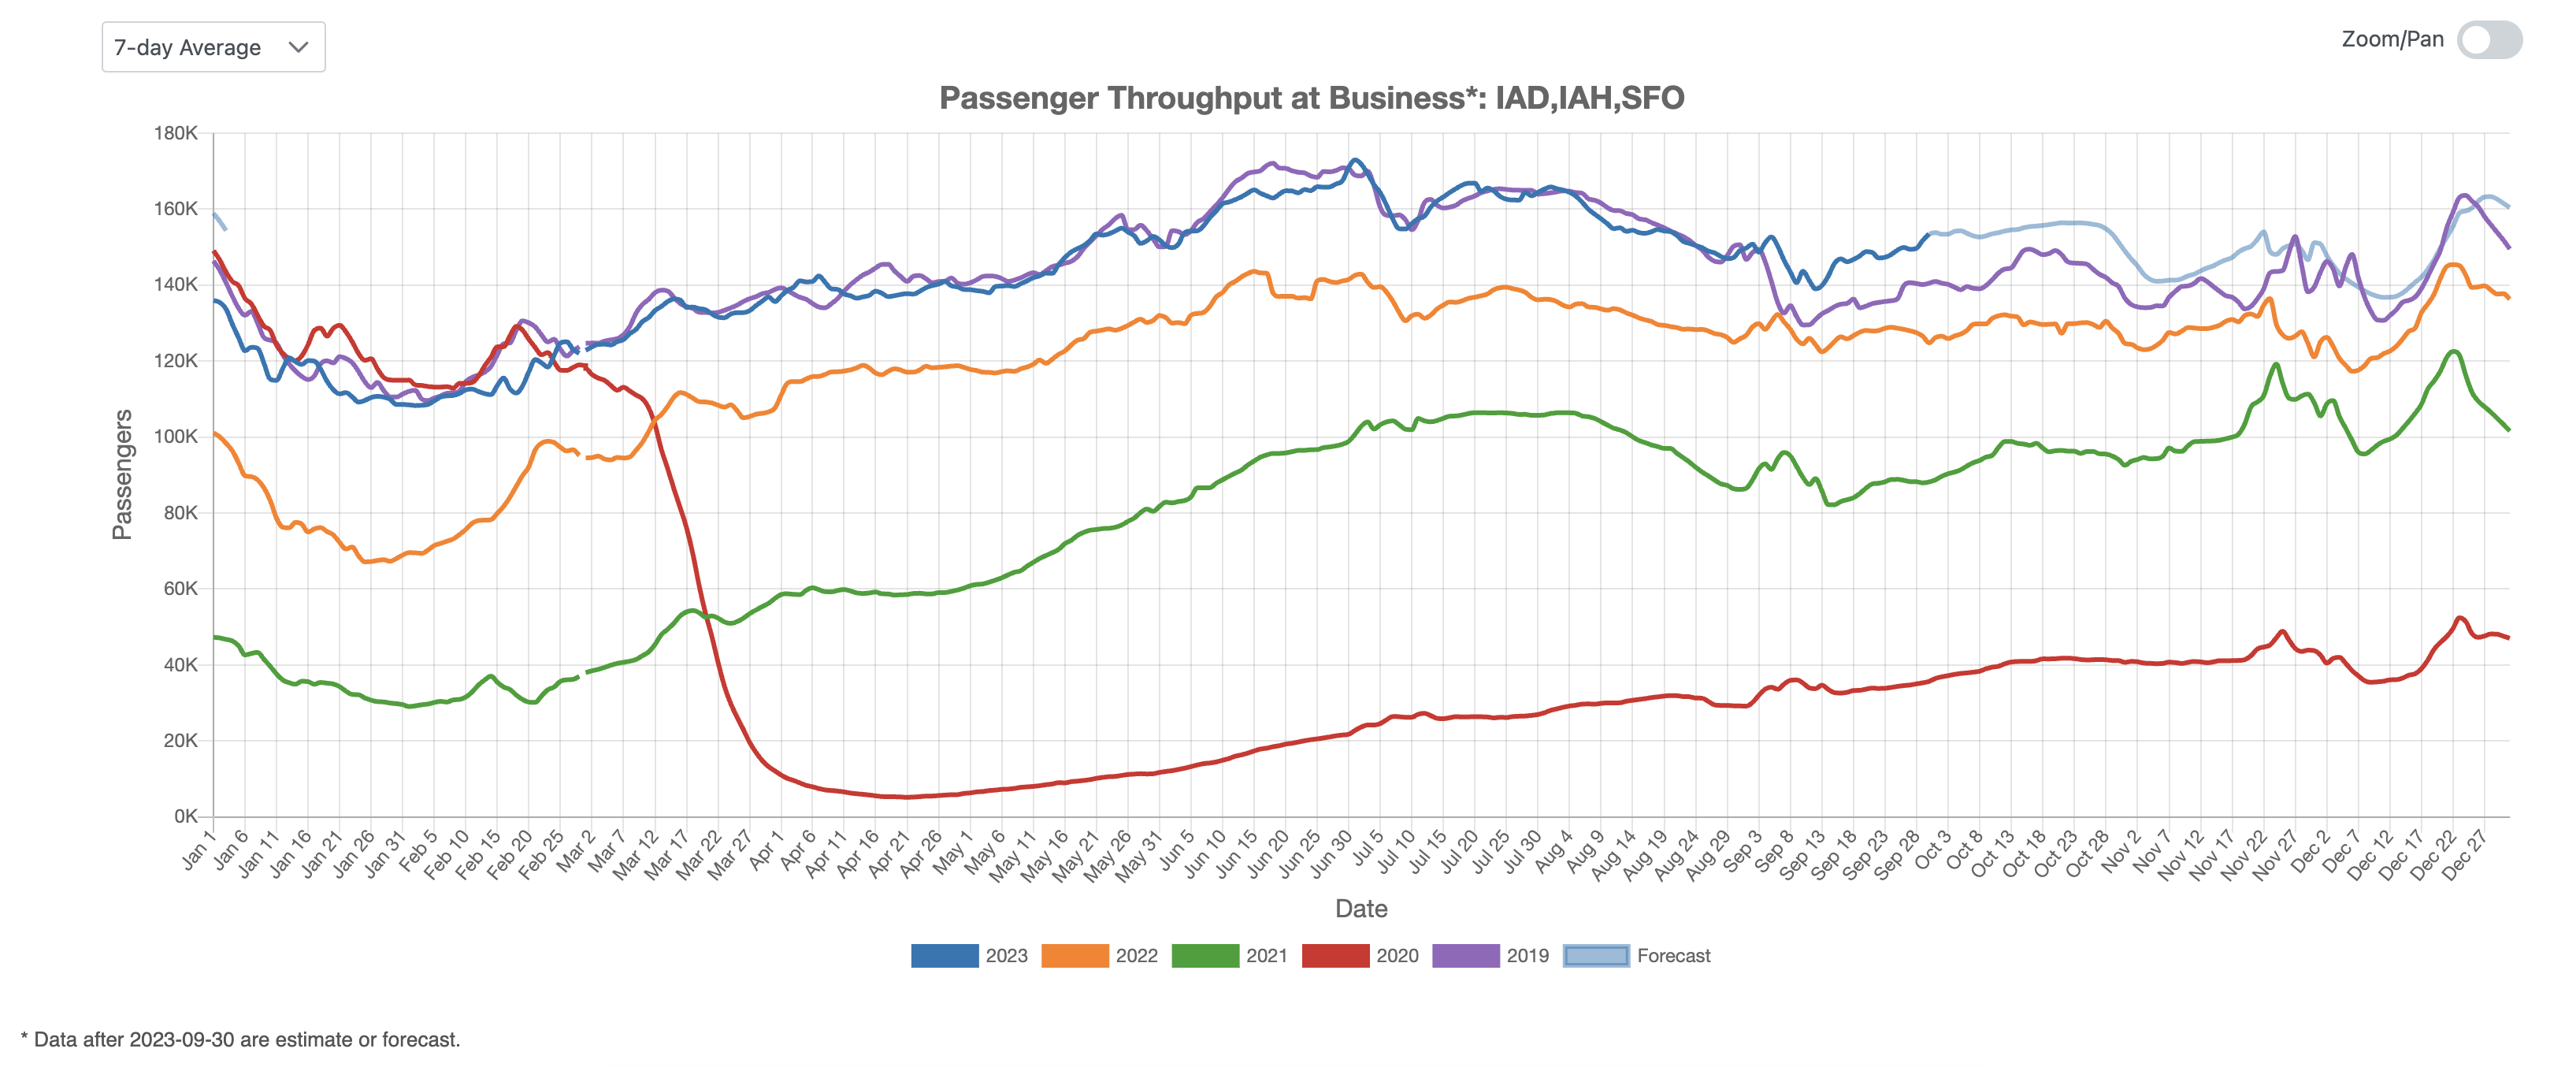
Figure 5: US Business Air Traffic Indicator
The U.S. air traffic trend reveals a robust recovery. Domestic air traffic rebounded significantly, surpassing 2019 levels by over 7-10%, with expectations of continued growth ahead. International air traffic aligns between 2022 and 2019 levels, hinting at a return to pre-COVID levels. Leisure air travel has also seen a rebound, underscoring the sector’s strength. Additionally, business air travel is stable and exceeds 2019 levels by 6-8%, indicating a strong recovery and potential for growth beyond pre-pandemic levels. In summary, these trends collectively signal a promising resurgence in the U.S. air travel sector.