Traffic and fare data by airline and route can provide valuable insights into market trends, demand, and competition. By analyzing this data, airlines can optimize their pricing strategies, plan their capacity, and make informed decisions about their route network. The data can also be used for market and competitive analysis, helping airlines identify profitable routes and gain a competitive advantage.
Based on initial true O&D level data from FlightBI released this week, both US domestic and US international air traffic experienced a decline from August to September. Meanwhile, average airfares fell slightly.
Volume Trend
The latest Origin and Destination (O&D) data reveals that the US air market is aligning with its traditional passenger volume trends. In September 2023, the US domestic air travel sector recorded 48.8 million passengers, marking a 10% decline from August’s 54.1 million. This decrease is attributed to seasonal factors. Notably, the September 2023 figures surpass the pre-pandemic levels, with a 6% increase compared to the 45.9 million passengers in September 2019. Concurrently, the international sector of the US air market was decreased from 22.0 million to 19.1 million.
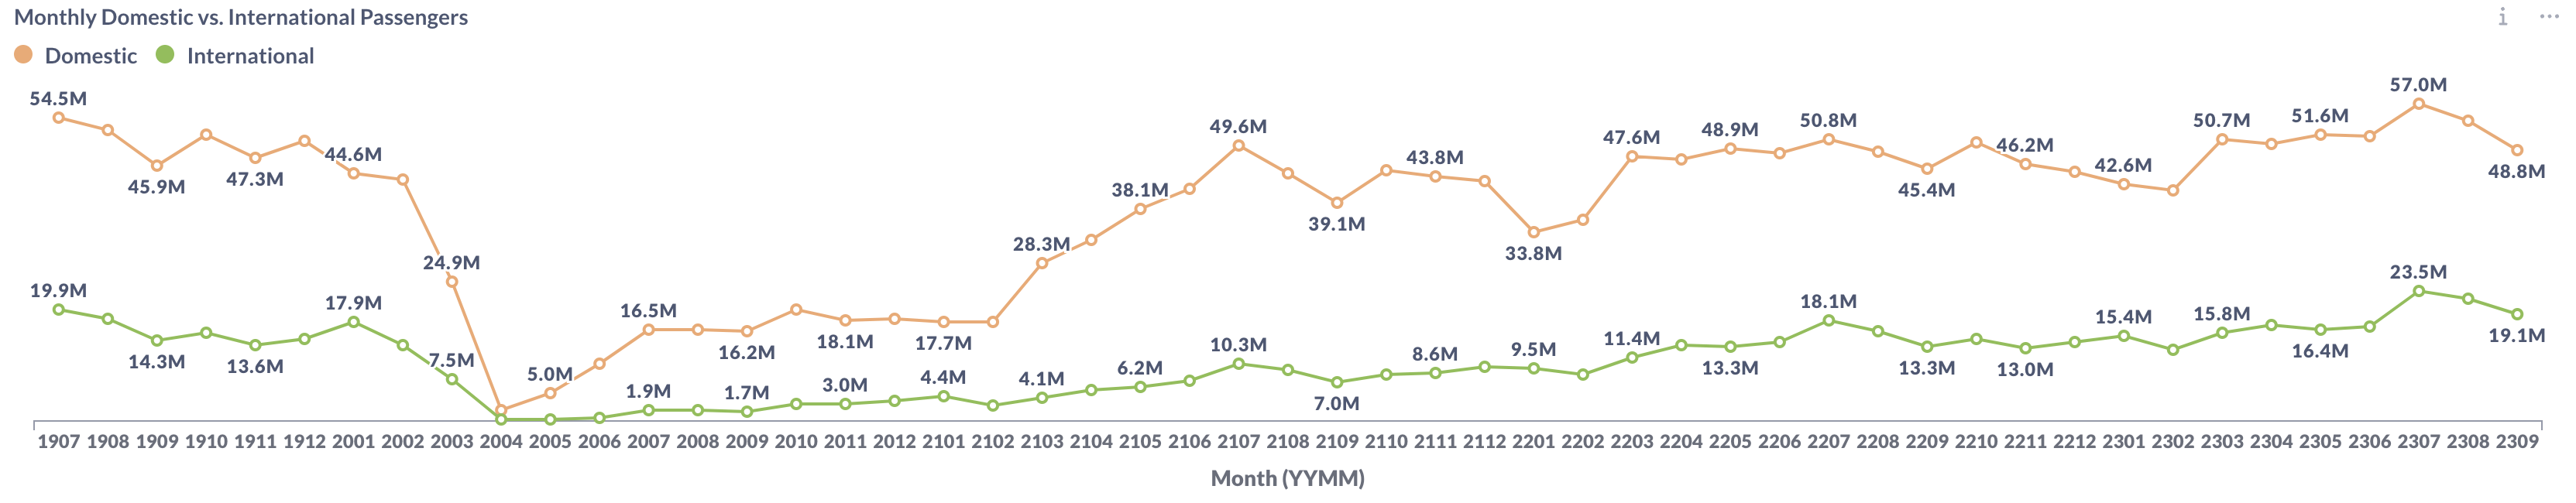
Figure 1: US Domestic and International Air Traffic by Month
Airfare Trend
Airfares continued to decline, as evidenced by the latest data. The average gross fare for air travel saw a reduction from $217 in August to $211 in September. Concurrently, the average net fare also decreased, moving from $186 in August to $181 in September.
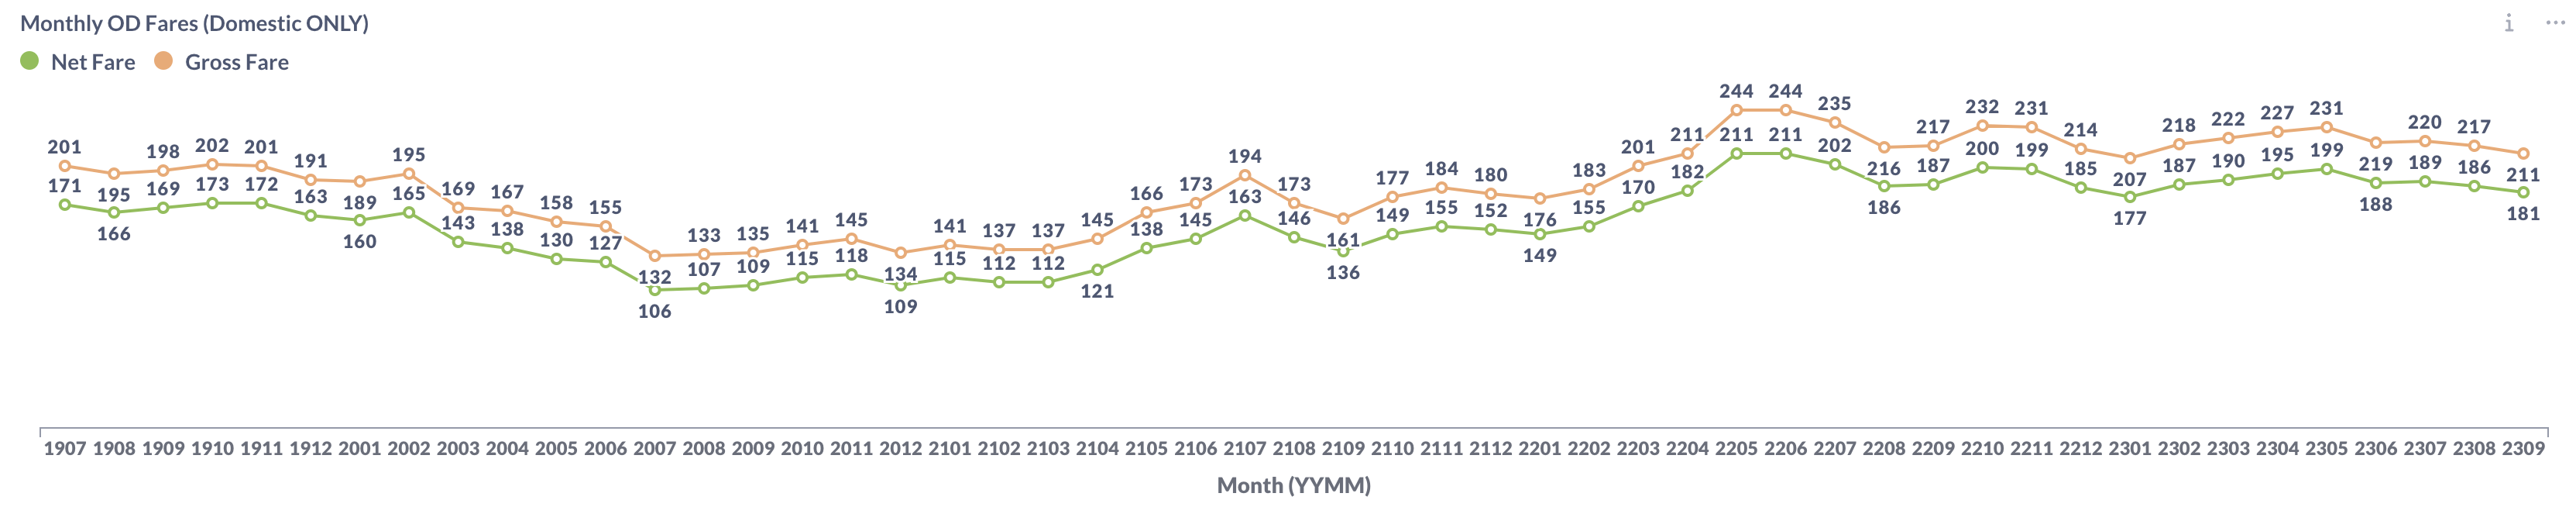
Figure 2: US Domestic Average Airfare by Month
The Energy Information Administration (EIA) reports indicate a rise in jet fuel prices for September, as depicted in the following chart. This trend signals a tightening of profit margins for airlines. However, there is a notable shift beginning in October, with jet fuel prices starting to decline.
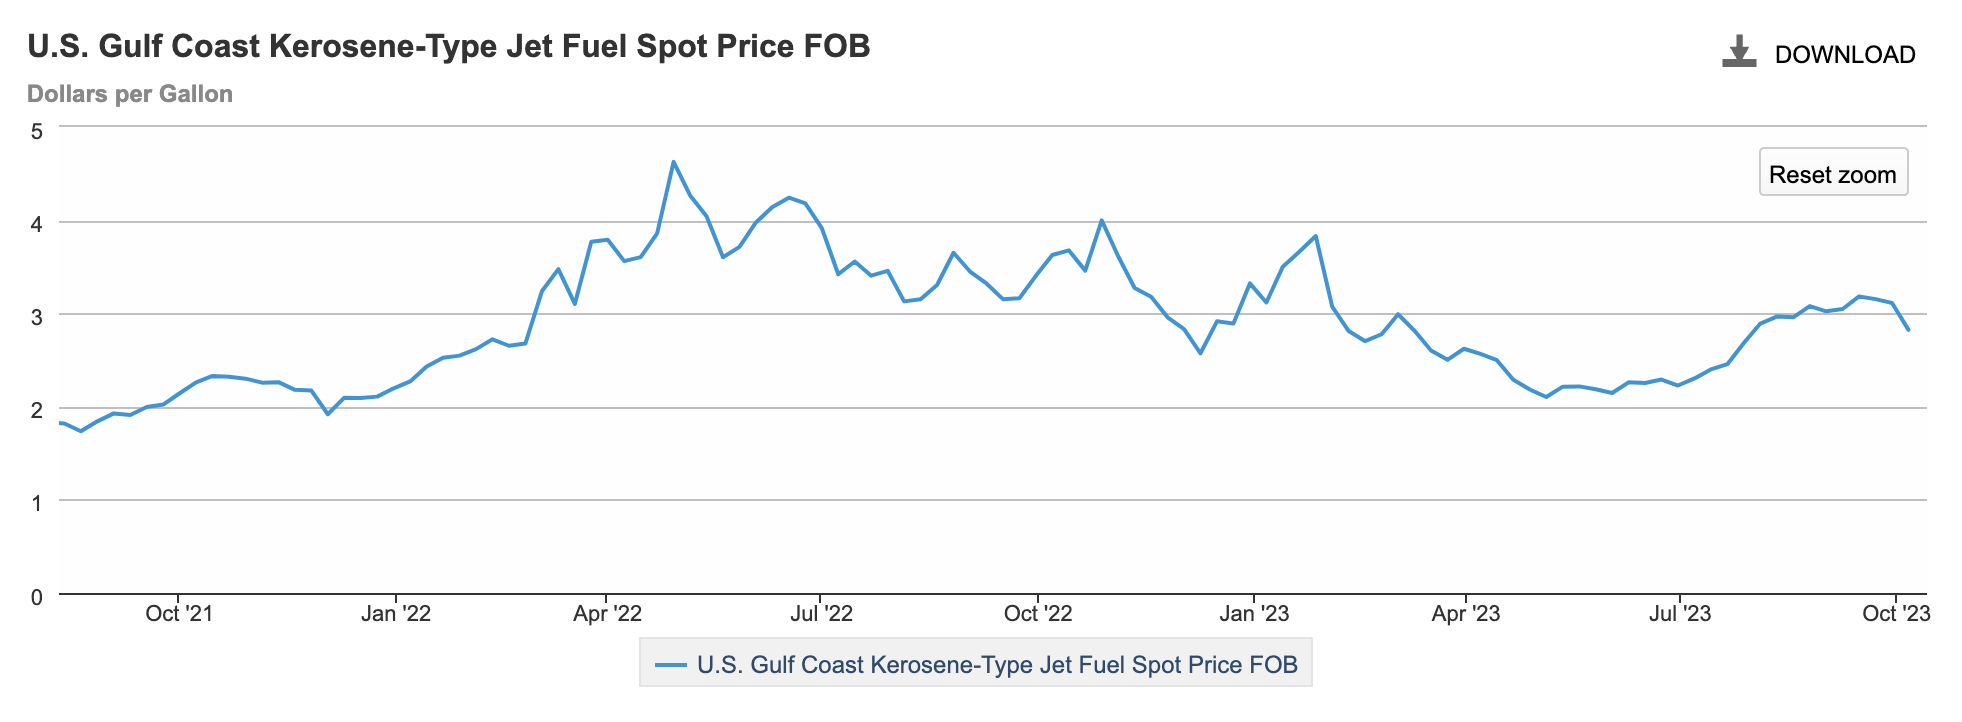
Figure 3: US Jet Fuel Price
Load Factor Trend
In September, major US airlines experienced a decrease in average load factor, dropping to 77.7% from August’s 80.1%, as shown in Figure 4. This decline was primarily led by low-cost carriers such as Spirit (NK), Frontier (F9), and JetBlue (B6).
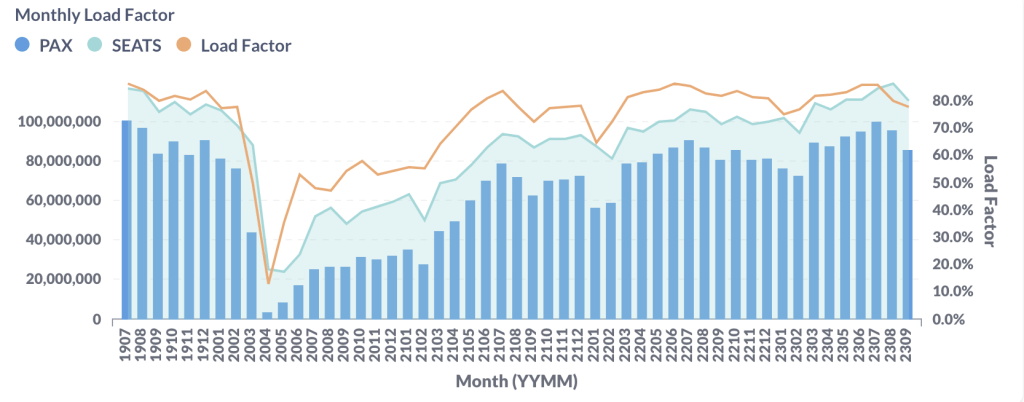
Figure 4: US Airlines’ Average Load Factor by Month
Month Over Month Comparison
Between August and September 2023, all major US airlines experienced a decline in traffic, consistent with typical seasonal patterns. The pronounced decrease in traffic for Allegiant (G4) aligns with their business model. Alongside Allegiant (G4), JetBlue (B6) and Spirit (NK) also saw significant reductions in traffic, with decreases of 15.2% and 14.7% respectively.
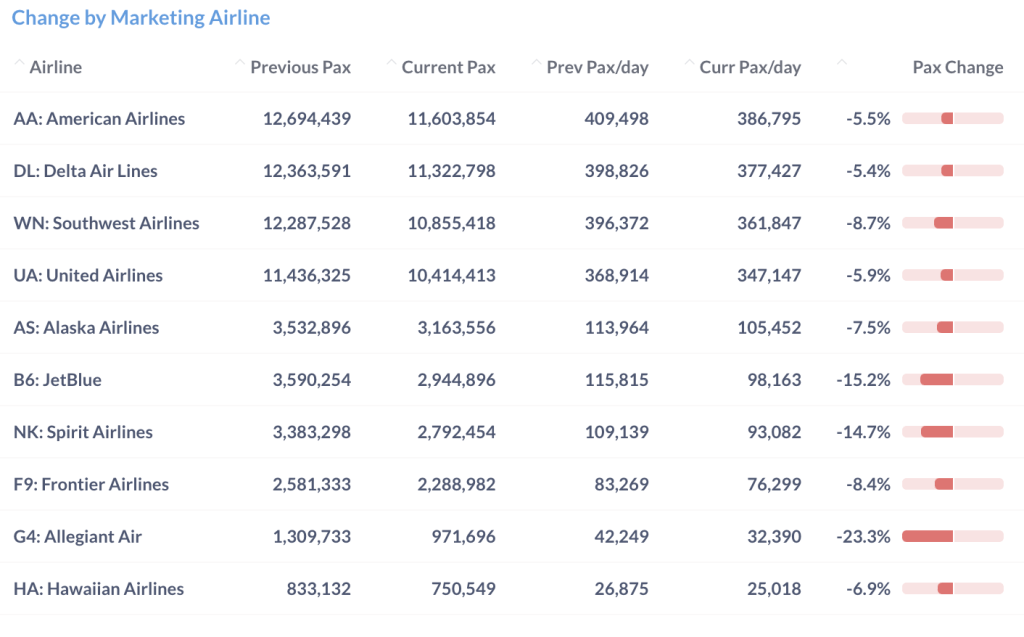
Figure 5: Air Traffic by Dominant Marketing Airlines in August 2023 (Previous) vs. September 2023 (Current)
In the same period, the majority of leading airports experienced a downturn in daily passenger traffic compared to the previous month. Orlando (MCO) experienced the most significant decline at 14.4%. In contrast, Phoenix (PHX) and Las Vegas (LAS) bucked the trend, witnessing increases of 5.4% and 1.5%, respectively.
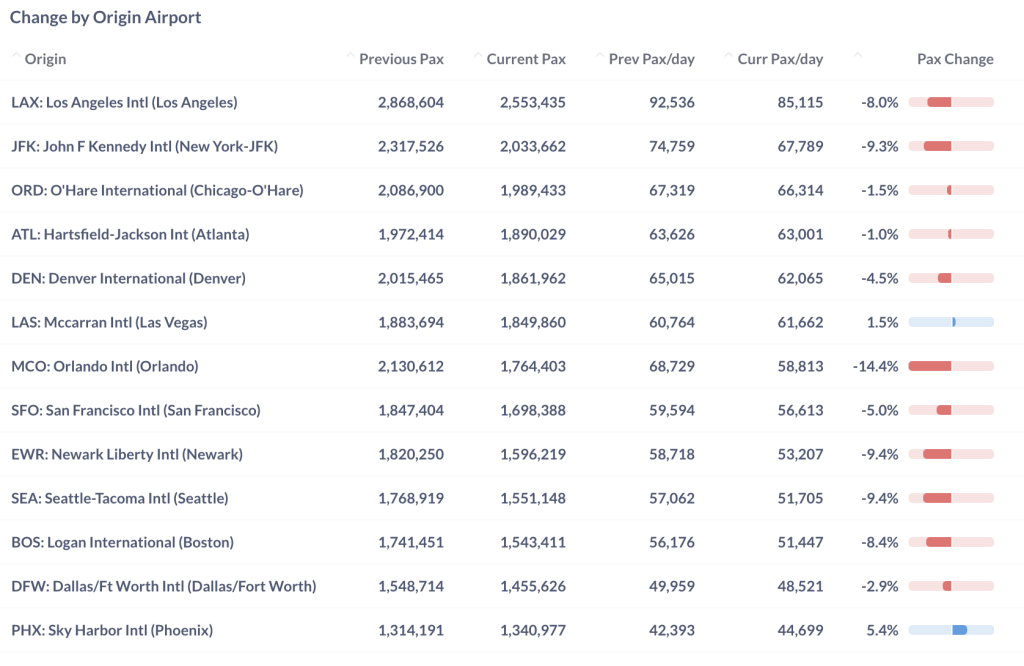
Figure 6: Air Traffic by Top Origin Airports in August 2023 (Previous) vs. September 2023 (Current)
Year Over Year Comparison
In a year-over-year comparison to September 2022, all major US airlines, except Allegiant (G4), showed positive growth. Frontier (F9), United (UA), and Delta (DL) were at the forefront of this growth, registering increases of 26.5%, 22.5%, and 12.8% respectively. In contrast, Allegiant (G4) saw a 2.1% decrease compared to the previous year.
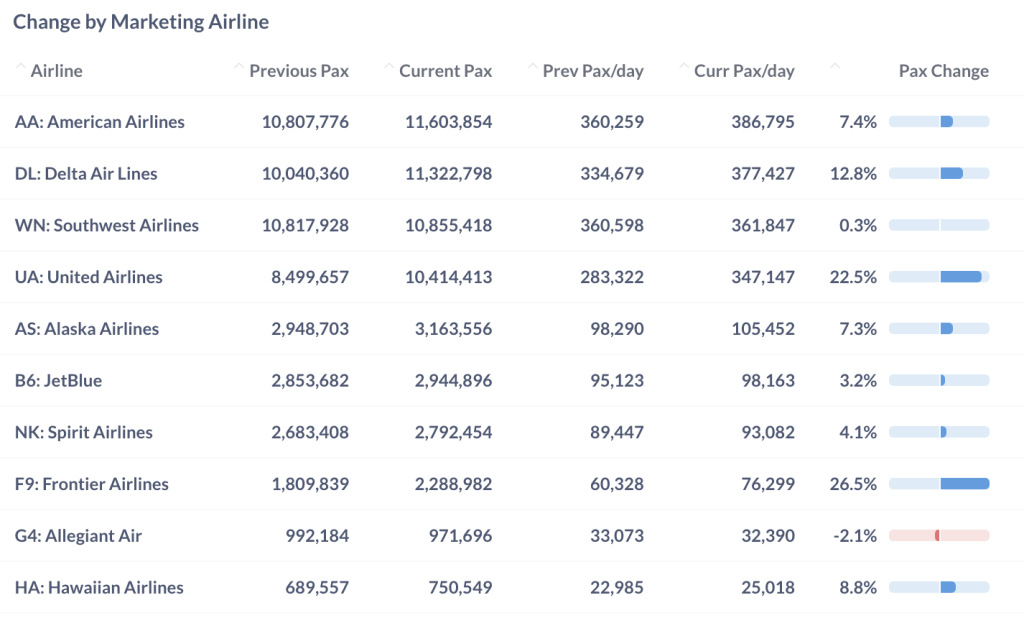
Figure 7: Air Traffic by Dominant Marketing Airlines in September 2023 (Current) vs. September 2022 (Previous)
From September 2022 to September 2023, the majority of top airports demonstrated growth exceeding 10%. Notably, two New York airports (JFK and EWR) along with San Francisco International Airport (SFO) led the year-over-year growth, each recording an increase of over 20%.
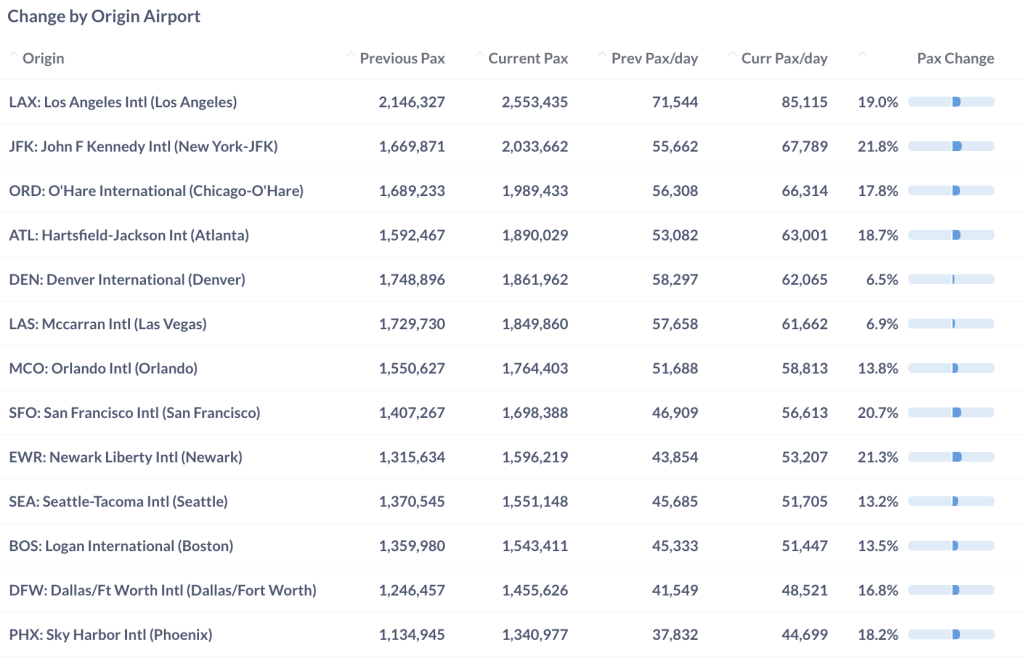
Figure 8: Air Traffic by Top Origin Airport in September 2023 (Current) vs. September 2022 (Previous)
For more detailed information on traffic and fares by route and airline, please contact service@flightbi.com or request a demo of Fligence USOD. They will be able to provide you with customized information to meet your specific needs and requirements.