Both overall air traffic and average airfares in the U.S. declined in August 2022! The preliminary true O&D level data released by FlightBI today shows that passenger volume dropped from July 2022 to August 2022 by 4% while the average airfare fell by 8%. Meanwhile, Jan 2022 to Jul 2022 data have been restated because more actual data are released by DOT.
Volume Trend
US domestic traffic by true O&D decreased from 51.0 million passengers in July to 48.7 million in August, which is still below the pre-pandemic level of 52.4 million in August 2019. The US international traffic also declined from 19.9 million in July to 18.5 million in August. The decline from July to August is a normal seasonality. But it indicates that the momentum of COVID recovery has reached an end.
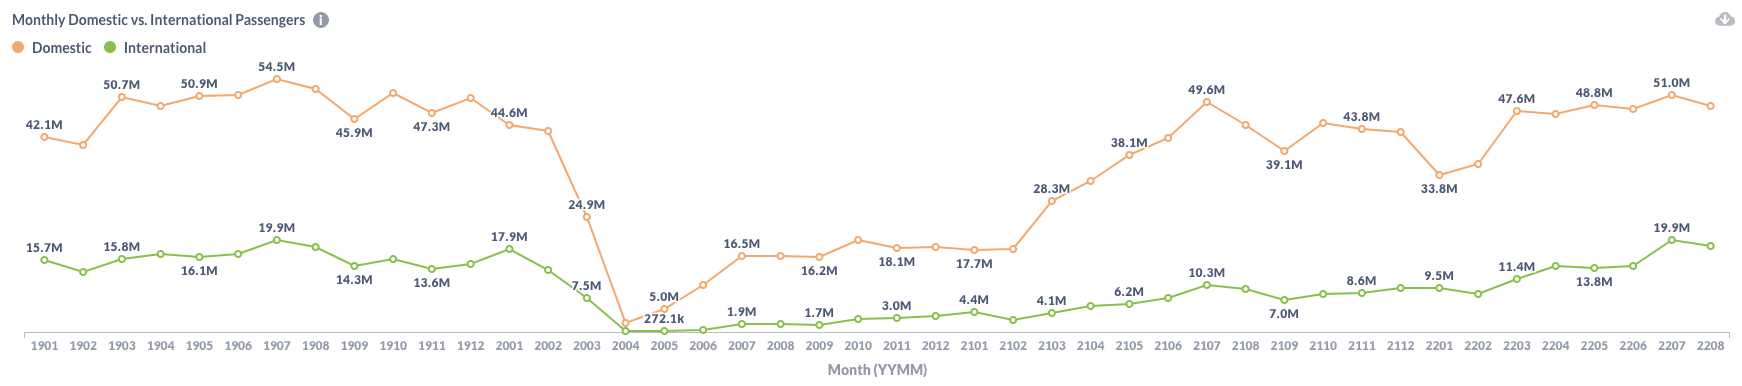
Figure 1: US Domestic and International Air Traffic by Month
Airfare Trend
Average domestic gross fares decreased by 8.1% from $221 in July to $203 in August while average net fares decreased by 7.3% from $190 to $176. Airfares in the second quarter have been restated lower after the actual data is available. However, the fare peak still appeared in May and June.
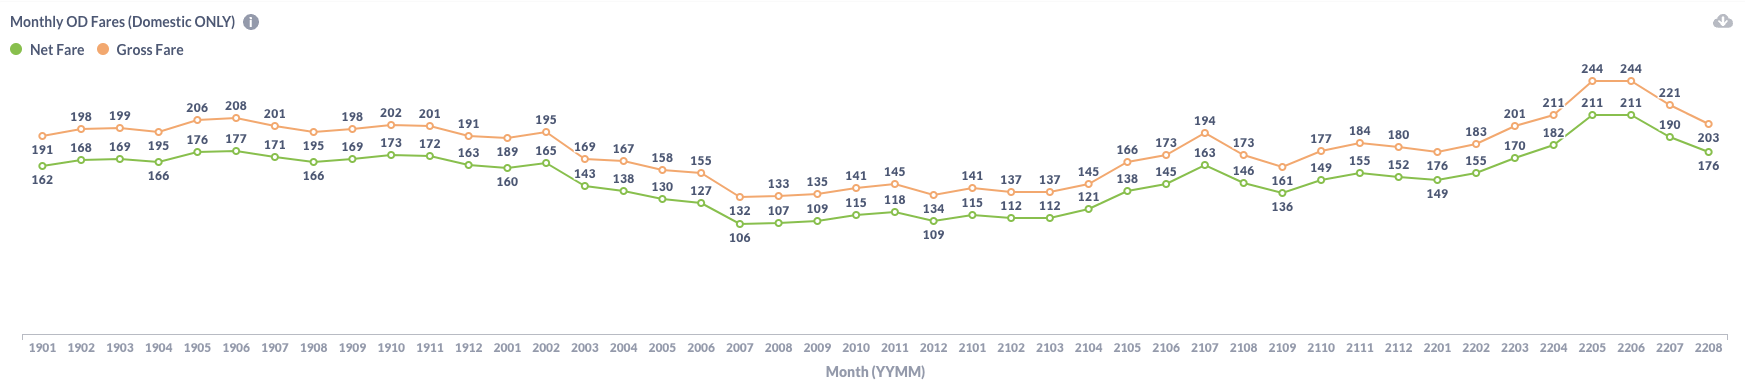
Figure 2: US Domestic Average Airfare by Month
The reduction of average fares is primarily driven by the cutback of Jet fuel prices. As shown in the chart below provided by EIA, the US jet fuel price has ebbed from its peak in May but stayed at a high level. Since Opec+ announced cutting oil production by 4.5%, the high fuel price will probably linger around.
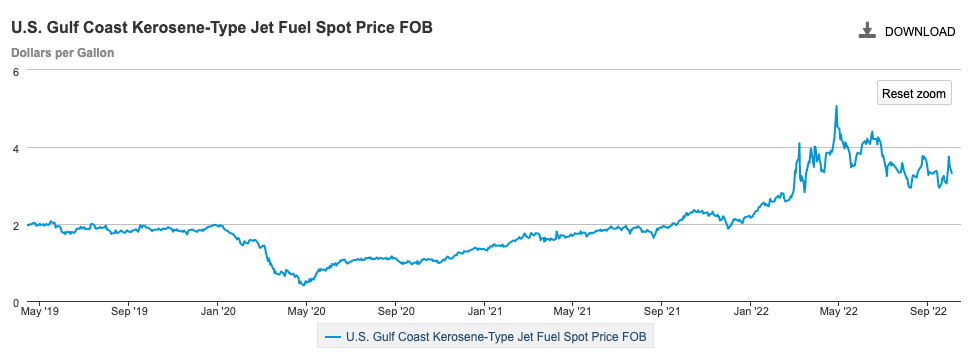
Figure 3: US Jet Fuel Price
Load Factor Trend
The bad news for airlines is that the average load factor got worse because traffic declined faster than the capacity did. The average load factor in August is 79.0%, down from 82.2% in July.
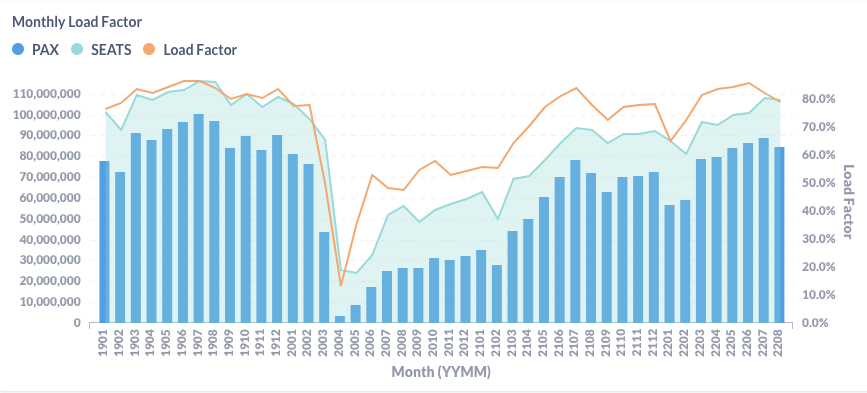
Figure 4: US Airlines’ Average Load Factor by Month
Month Over Month Comparison
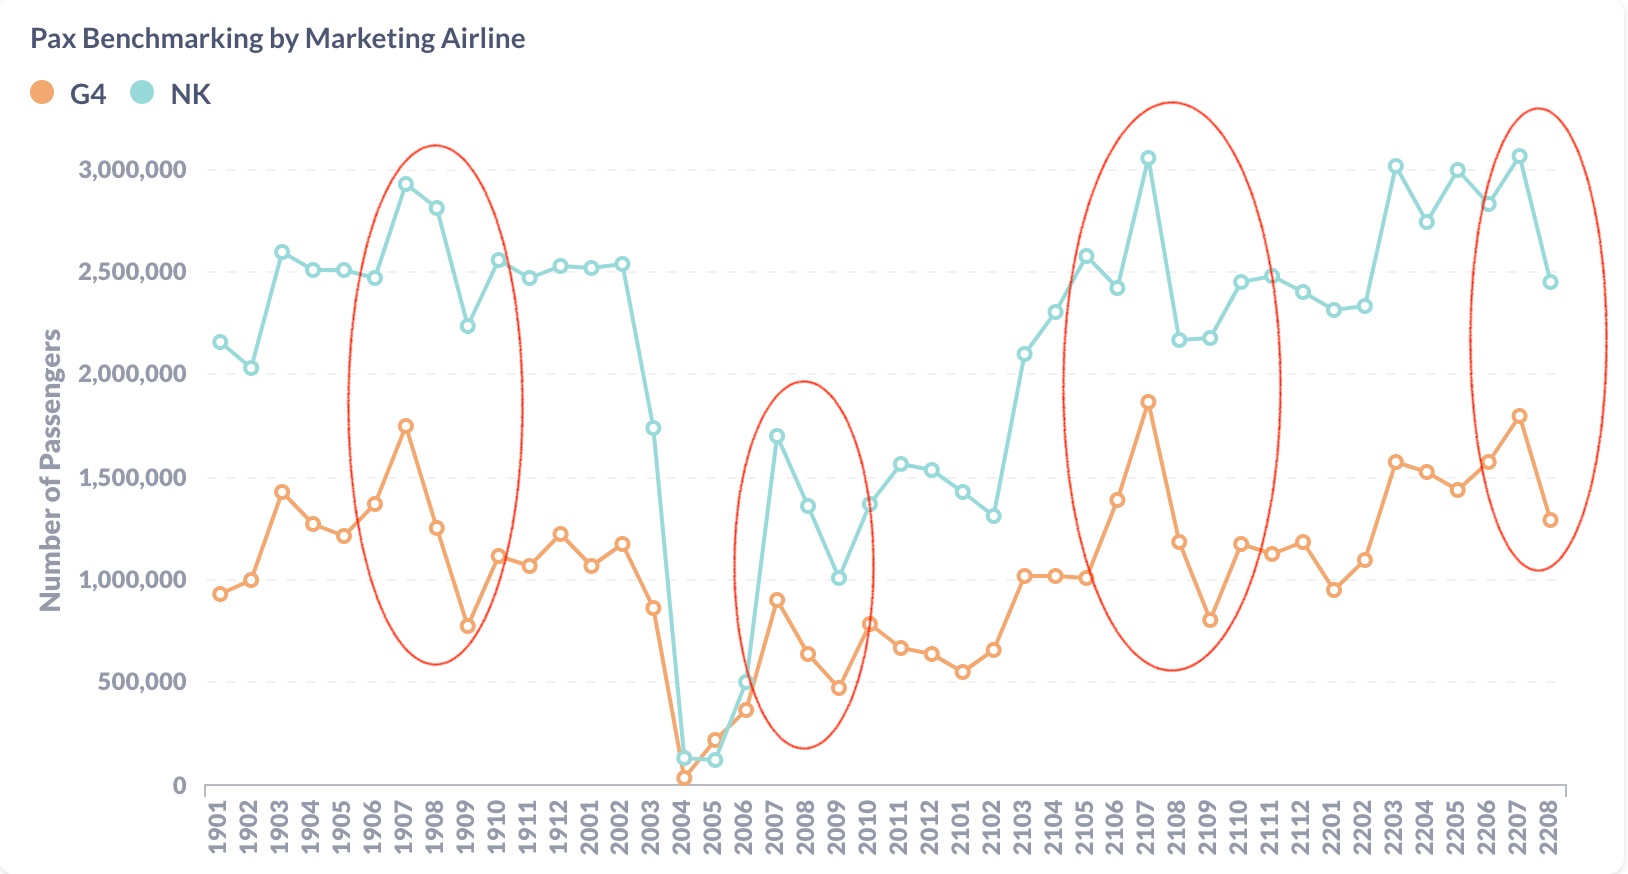
From July to August, all major US airlines carried less passenger traffic. But Allegiant(G4) and Spirit(NK) had dramatic decreases, at 28.4% and 19.9% respectively. Luckily, this is just caused by the seasonality because they carry lots of traffic to/from Florida. As shown in Figure 6, they always have significant traffic drops from July to August and September. The difference is that Allegiant also cut August’s capacities by 25.5% while Spirit did not. As a result, Spirit had a much worse load factor impact than Allegiant.
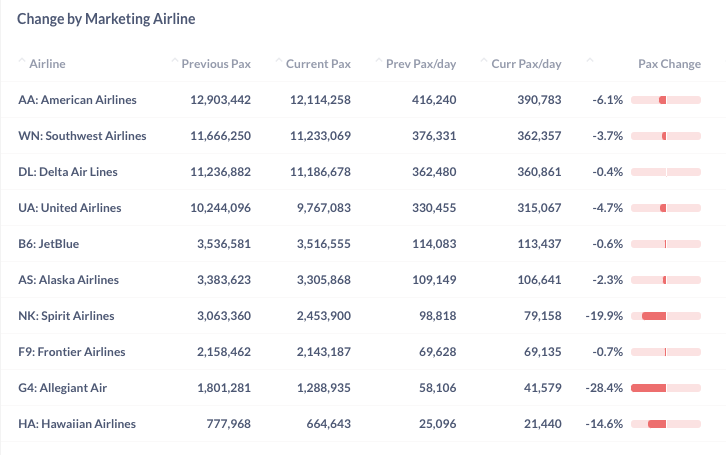
Figure 5: Pax by Dominant Marketing Airlines in August 2022 (Current) vs. July 2022 (Previous)
Most top airports reduced traffic in August, except Seattle (SEA), which achieved a monthly growth of 1.4%. Dallas (DFW) is the one with the largest decrease at 11.0%, probably because it was too hot in August.
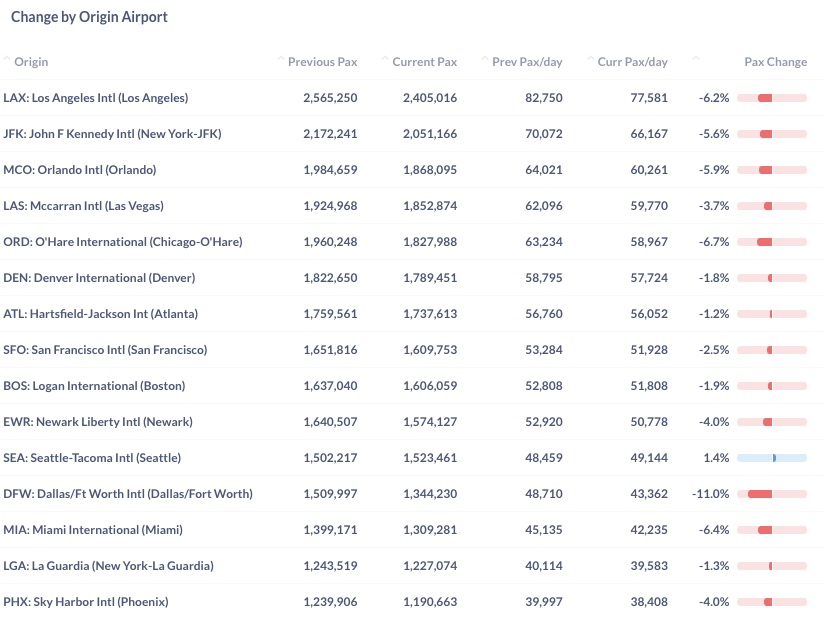
Figure 7: Pax by Top Origin Airports in August 2022 (Current) vs. July 2022 (Previous)
Year Over Year Comparison
Compared to the same month last year, all airlines had achieved some growth. United(UA) led with a year-over-year growth rate of 20.9%, thanks to its high share of international travel. Allegiant(G4) is at the low end but also increased traffic by 9.1% from last year.
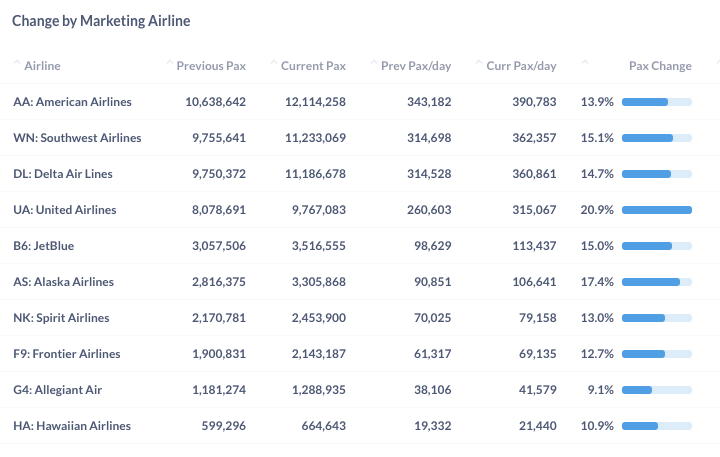
Figure 8: Pax by Dominant Marketing Airlines in August 2022 (Current) vs. August 2021 (Previous)
By origin, many airports had significant growth from last year. New York’s two airports increased traffic by 67.4% (LGA) and 42.7% (JFK), due to the rebound in international traffic and business trips. San Francisco (SFO) and Boston (BOS) generated 58.7% and 40.2% more passengers than last year. Among the top airports, Denver (DEN) has the smallest growth at 6.5% because it has more domestic traffic portion than other large airports.
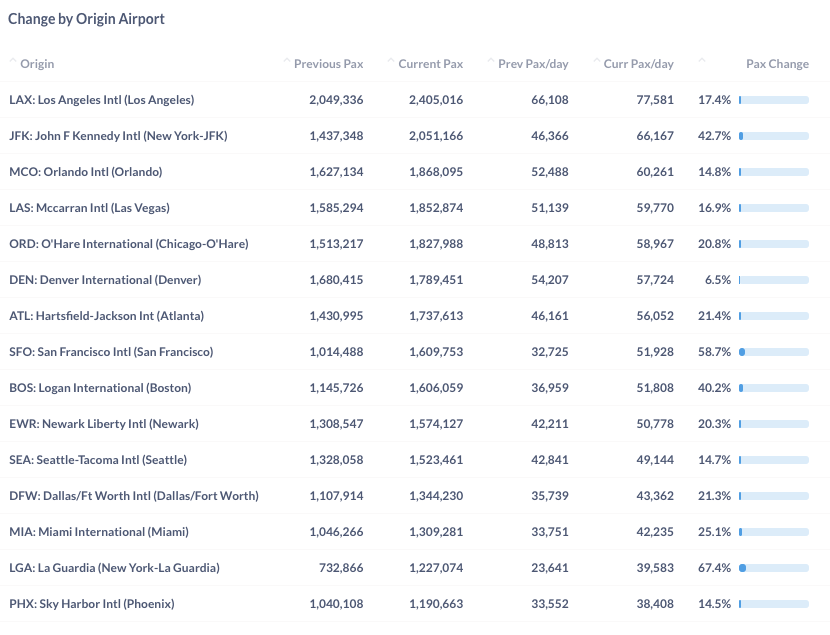
Figure 9: Pax by Top Origin Airport in August 2022 (Current) vs. August 2021 (Previous)
For more granular traffic and fare information by route and airline, please contact service@flightbi.com or request a demo of Fligence USOD.