
An airport’s catchment area does not exist in isolation. When travelers can reasonably access two or more airports, their geographic markets overlap, and each airport competes for passengers across that shared region.
As a result, a competing airport can reduce, reshape, or penetrate another airport’s catchment area—even in communities located relatively close to the airport.
This is why airport catchment areas should not be viewed as fixed territories with hard boundaries. In multi-airport regions, the more useful question is not simply “Is this community inside our catchment?” but:
“What position does our airport have within this community compared with other airports?”
Airport Catchment Areas Often Overlap
A traditional catchment map might assign every community within a certain drive time to one airport.
Real passenger behavior is more complicated.
Consider a ZIP code located:
35 minutes from Airport A
55 minutes from Airport B
80 minutes from Airport C
It might seem logical to assign the ZIP code entirely to Airport A.
But actual passenger distribution could look like:
| Airport | Share of Air Travelers |
|---|---|
| Airport A | 48% |
| Airport B | 37% |
| Airport C | 15% |
Airport A has the strongest position, but all three airports participate in the market.
Instead of thinking of this ZIP code as belonging exclusively to Airport A, it is better understood as an overlapping competitive market.
Competition Can Vary Across the Catchment Area
The influence of competing airports is rarely uniform.
Close to the airport, one airport may dominate passenger demand. As distance increases, its position may gradually weaken while competing airports become more important.
A simplified pattern might look like:
Core area: Airport A captures 75% of travelers
Middle area: Airport A captures 55%
Outer area: Airport A captures 35%
This creates a catchment with different levels of strength rather than one fixed boundary.
For airport analysis, it can therefore be useful to think in terms of:
Core markets — areas where the airport has a strong position
Competitive markets — areas where passengers are distributed among multiple airports
Outer markets — areas where the airport still attracts passengers but another airport may have a stronger position
This provides a more realistic picture of an airport’s geographic influence.
Manchester-Boston: Competition with Boston Logan
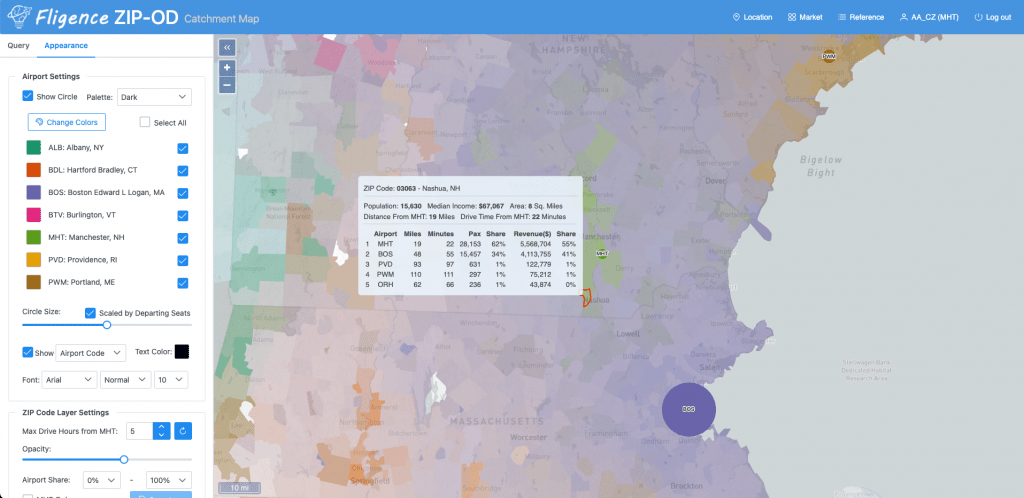
Manchester-Boston Regional Airport (MHT) provides a clear example of how a major competing airport can influence a regional airport’s catchment.
Manchester is located less than 50 miles from Boston, and the interstate highway network makes both MHT and Boston Logan (BOS) viable choices for many travelers in the region.
MHT itself has described the effect of increased low-cost-carrier competition at Boston Logan as creating additional challenges for Manchester and Providence’s T.F. Green Airport.
The effect can also be seen historically. Manchester reported almost 4.4 million passengers in 2005, while its more recent passenger volumes are substantially lower.
The important catchment lesson is that the population surrounding Manchester did not simply disappear.
Instead, changes in airline service and competitive choices available at Boston Logan altered how travelers within the broader region distributed themselves among airports.
A community can remain geographically close to MHT while becoming more competitive from an airport-choice perspective.
Punta Gorda: One Geographic Market, Several Airports
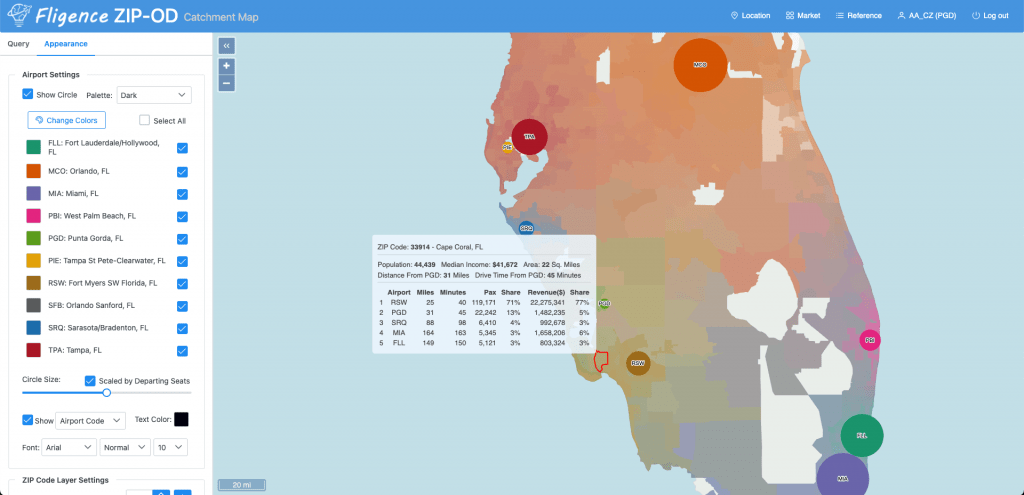
Southwest Florida provides another strong example.
Punta Gorda Airport (PGD) describes its catchment as extending from southern Tampa Bay to Marco Island, an area that also contains or is accessible to several other commercial airports.
PGD reports that its originating passenger base comes primarily from Lee County (35.5%), Charlotte County (26.2%), Sarasota County (18.3%), and Collier County (13.2%).
This means PGD’s passenger base extends substantially beyond Charlotte County, where the airport is located.
But those same communities also have access to airports such as Southwest Florida International (RSW), Sarasota-Bradenton (SRQ), and, for some travelers, Tampa International (TPA).
A PGD leakage and retention study illustrates just how overlapping this market can be. Across the study’s catchment area, RSW captured 55.4% of domestic traffic, while SRQ captured 14.1%, PGD captured 13.5%, and TPA captured 11.5%.
The catchment therefore cannot realistically be divided into simple geographic territories belonging exclusively to PGD, RSW, SRQ, or TPA.
The airports share portions of the same passenger market.
International Travel Can Produce a Completely Different Competitive Pattern
The Punta Gorda example also demonstrates another important characteristic of competing-airport catchments: competition can change dramatically depending on the type of trip.
In PGD’s leakage and retention study, Miami International Airport (MIA) accounted for only 1.0% of domestic traffic generated within the catchment but 47.8% of international traffic.
That is a striking difference.
Miami is geographically much farther from much of Southwest Florida than RSW or PGD. Yet its international network makes it relevant to travelers for trips where the closer airports may not provide comparable options.
This demonstrates why an airport’s competitive set is not necessarily the same for every passenger.
For domestic travel, Airport A may be the strongest competitor.
For international travel, Airport B—possibly much farther away—could become much more important.
Competition Can Be Different for Every ZIP Code
Airport competition is best examined at a detailed geographic level because neighboring communities can have very different airport-choice patterns.
For example:
| ZIP Code | Airport A | Airport B | Airport C |
| ZIP 1 | 78% | 17% | 5% |
| ZIP 2 | 61% | 30% | 9% |
| ZIP 3 | 44% | 43% | 13% |
| ZIP 4 | 29% | 58% | 13% |
Looking only at a regional average would hide these differences.
ZIP 1 is clearly part of Airport A’s core market.
ZIP 3 is highly competitive.
By ZIP 4, Airport B has become the dominant airport even though Airport A still attracts a meaningful share of travelers.
Mapping these patterns can reveal where one airport’s influence gradually transitions to another.
Catchment Boundaries Can Shift Over Time
Competitive catchments are also dynamic.
When one airport gains significant new service, its influence can expand into communities that previously favored another airport.
Likewise, service reductions can weaken an airport’s position.
Manchester-Boston provides a historical example. The airport has specifically identified the arrival of additional low-cost-carrier competition at Boston Logan as one of the factors associated with changes in MHT passenger traffic.
The physical distance between Manchester and Boston did not change.
The competitive environment did.
That distinction is important because a drive-time catchment map could remain virtually identical while actual passenger behavior changes substantially.
Airports should therefore periodically reassess their catchment using current passenger behavior rather than assuming that a catchment established several years ago remains unchanged.
A Competitor Does Not Have to Be the Closest Airport
Airports should also avoid defining competitors based solely on geographic proximity.
A nearby airport with limited service might have relatively little influence over a particular market, while a larger airport farther away could attract substantial numbers of passengers.
The PGD example illustrates this particularly well for international traffic, where distant Miami becomes much more significant.
A useful competitive-airport analysis therefore asks:
Which airports are passengers actually using?
rather than simply:
Which airports are nearby?
The answer can reveal competitors that might not be obvious from a map.
Competition Should Be Measured by Market, Not Just Airport-Wide
Airport-wide market share provides a useful overview, but competition can become much clearer when analyzed by destination.
An airport may have a strong overall position within a community but a relatively weak position for a particular destination.
For example, Airport A could capture 60% of all passengers from a ZIP code but only 25% of travelers going to a particular destination.
This means the competitive catchment for that destination is different from the airport’s overall catchment.
For Air Service Development teams, this distinction is especially important when evaluating potential new routes.
The question is not only:
“How many passengers live in our catchment?”
It is also:
“Which airports are those passengers currently using for this particular market?”
How Should Airports Analyze Competing Catchments?
A useful competitive catchment analysis combines geography with actual passenger behavior.
At the ZIP-code level, airports can examine:
- Total air travel demand
- Passengers using the target airport
- Passengers using other airports
- Airport share of passenger demand
- Dominant airport
- Changes in airport position across geography
- Differences by destination
- Changes over time
The resulting map may look very different from a simple drive-time boundary.
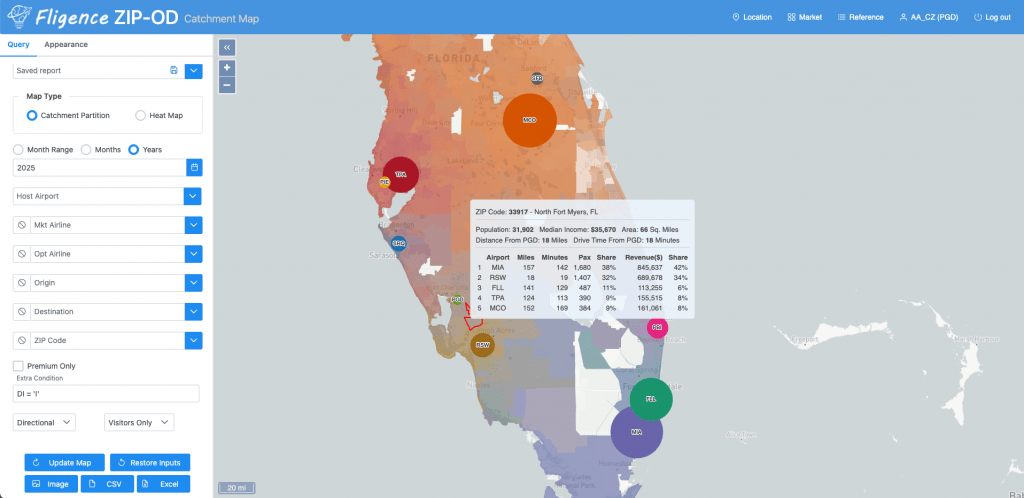
Instead of one line separating Airport A from Airport B, the market may contain a broad transition zone where both airports attract substantial numbers of passengers.
That transition zone can be one of the most strategically important parts of the catchment.
Why This Matters for Air Service Development
For Air Service Development teams, understanding competing catchments helps define the true addressable market for new service.
Suppose 500,000 people live within an airport’s traditional 60-minute catchment.
That population figure alone does not tell an airline how much air travel demand the airport can realistically attract.
Airlines need to understand how travelers within that region currently behave and how strongly other airports penetrate the market.
A behavioral catchment can provide a stronger story by showing:
where demand exists, where the airport is strongest, where the market is shared, and how much passenger activity occurs across the broader region.
This can help airports build more realistic airline business cases and demonstrate opportunities that may not be apparent from airport traffic statistics alone.
The Bottom Line
Competing airports make airport catchment areas overlap, change, and become much more complex than simple geographic boundaries.
A community does not necessarily belong exclusively to its nearest airport. Travelers within the same ZIP code may use several airports, and the relative strength of those airports can change across geography, by destination, and over time.
Manchester-Boston shows how increased service at a nearby major airport can alter a regional airport’s market even though the geography remains unchanged.
Punta Gorda demonstrates how several airports can share the same broad regional market—and how the competitive pattern can change dramatically between domestic and international travel.
For this reason, an airport’s catchment is better understood as a geographic pattern of passenger behavior and airport market position, rather than a fixed line drawn around the airport.