
Airports can identify promising unserved and underserved destinations by looking beyond their current nonstop route map. The real question is whether substantial passenger demand exists for a destination that the airport’s current service does not fully capture.
An unserved market has meaningful passenger demand but neither non-stop nor reasonable connecting air service from the airport. An underserved market already has air service, but its capacity, frequency, schedule, or airline options may not fully meet local demand. This can include a market that is served only through connections but has enough demand to potentially support nonstop service, as well as a nonstop market with insufficient frequency, capacity, or schedule quality.
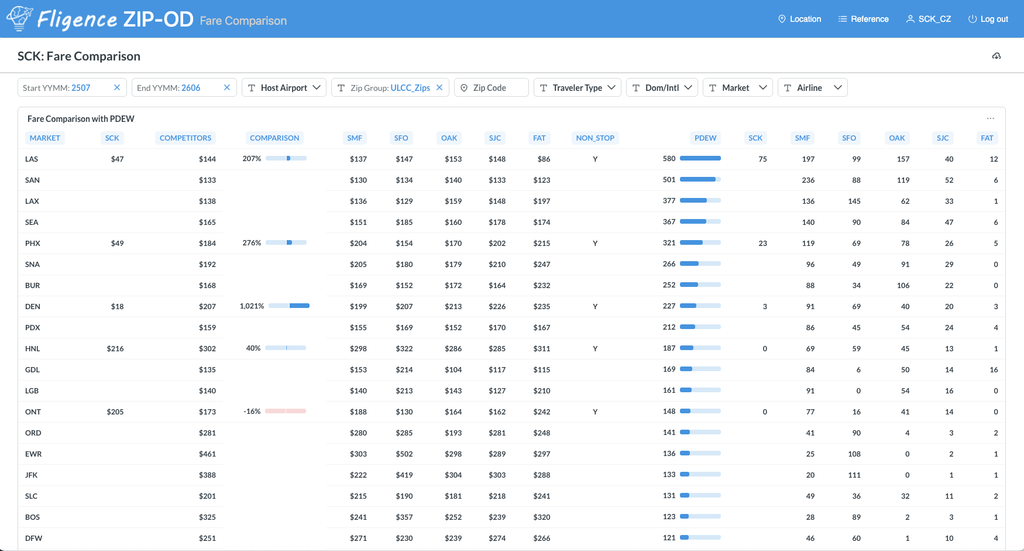
Using Stockton Metropolitan Airport (SCK) as an example, Fig. 1 shows that SCK has daily nonstop service to Las Vegas (LAS), twice-weekly service to Phoenix (PHX), seasonal service to Denver (DEN), and occasional charter flights to other destinations.
All scheduled commercial flights at SCK are operated and marketed by Allegiant Air (G4). Because Allegiant does not offer traditional connecting itineraries through these destinations, passengers generally cannot book a single connecting itinerary from SCK to other markets. As a result, the destinations shown in Fig. 1 other than LAS, PHX, and DEN can be considered unserved markets for SCK. Passengers traveling to these markets must begin their scheduled journey at another airport or arrange their own separate-ticket connection.
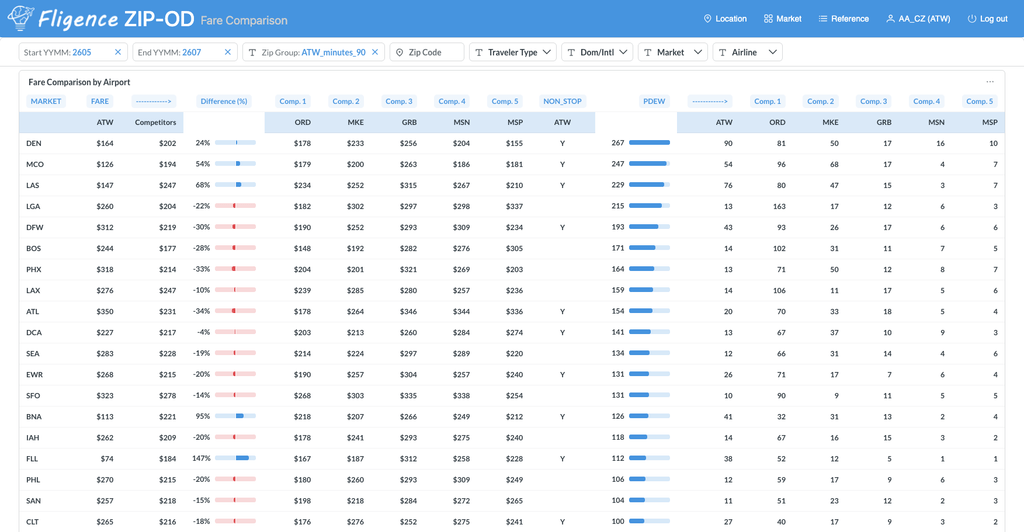
Appleton International Airport (ATW) presents a different situation. As shown in Fig. 2, ATW offers nonstop service to many destinations, including Denver (DEN), Orlando (MCO), and Las Vegas (LAS). However, it does not offer nonstop service to several other significant markets, including New York (LGA, although ATW has weekly service to EWR), Boston (BOS), Phoenix (PHX), and Los Angeles (LAX, although ATW has weekly service to SNA).
Because there is significant passenger demand to these markets, travelers must either drive to a competing airport, such as Milwaukee (MKE) or Chicago O’Hare (ORD), or take a connecting flight from ATW. These destinations can therefore be considered underserved markets for ATW. The demand already exists and air service is available through connections or alternative airports, but additional nonstop service from ATW could provide a more convenient option and potentially capture more of the market.
Start with Total Destination Demand
A good starting point is to rank destinations by the total number of passengers traveling between the airport’s broader market and each destination.
Consider the following example:
| Destination | Total Market PDEW | Local Airport PDEW | Current Nonstop |
|---|---|---|---|
| Nashville | 90 | 18 | No |
| Austin | 76 | 20 | No |
| Orlando | 120 | 95 | Yes |
| San Diego | 58 | 15 | No |
| Denver | 110 | 82 | Yes |
Nashville and Austin immediately stand out as relatively large markets without nonstop service. Orlando and Denver are different. Both already have nonstop service, but the remaining demand may justify examining whether additional frequency, capacity, or schedule improvements could capture more passengers.
A useful initial screen should therefore compare:
- Total market demand
- Demand currently using the local airport
- Demand using competing airports
- Existing nonstop service
This provides a much better picture than looking at the airport’s current passengers alone. The key data required is demand from the target’s catchment area, rather than travelers using the target airport today.
What Makes a Market Unserved?
An unserved market has passenger demand but no nonstop flight or convenient connections between the local airport and the destination. Those passengers have not disappeared. They may currently drive to a competing airport for a nonstop flight, or connect through another airport, or decide not to make some trips because the available options are inconvenient.
Suppose a market has:
- Total market demand: 75 PDEW
- Local airport traffic: 1 PDEW
- Local nonstop service: None
The local airport has only 1 PDEW, connecting through some inconvenient way to the destination. That number alone makes the destination appear very small. But looking at the entire market tells a different story. There are actually 75 PDEW traveling to the destination, making it a much more meaningful market to investigate.
What Makes a Market Underserved?
Underserved demand is more nuanced because a nonstop or a connecting flight already exists. The question becomes whether the current service is capturing as much of the market as it reasonably could.
Consider a destination with:
- Total market demand: 140 PDEW
- Current local nonstop passengers: 70 PDEW
- Passengers using competing airports: 50 PDEW
- Local passengers making connections: 20 PDEW
The airport already has nonstop service, but half of the market is still not using that flight. Depending on the reason, the market might support:
- Additional frequency
- A larger aircraft with more seats
- Better departure or arrival times
- Seasonal expansion
- Year-round service
- A second airline
An underserved market should therefore be evaluated by how well the existing service meets total market demand, not simply by whether a nonstop flight exists.
Rank Markets by the Demand Gap
One useful screening measure is the demand gap, or the difference between total passenger demand and the demand currently captured by the local airport.
| Destination | Total PDEW | Local Airport PDEW | Demand Gap |
|---|---|---|---|
| Nashville | 90 | 18 | 72 |
| Austin | 76 | 20 | 56 |
| San Diego | 58 | 15 | 43 |
| Denver | 110 | 82 | 28 |
| Orlando | 120 | 95 | 25 |
Nashville has the largest demand gap in this example, but that does not automatically make it the best new route opportunity. The next questions are why the gap exists and how much of that demand is realistically addressable.
Passengers who live close to the local airport but drive much farther to reach a competitor may be relatively addressable. Passengers who live at the edge of the catchment and are actually closer to the competing airport may be much harder to win.
Look at PDEW, Not Just Annual Passenger Totals
Annual passenger totals can make a market sound large without showing how that demand translates into potential daily airline traffic. PDEW, or Passengers Daily Each Way, puts demand on a daily basis that can be compared more easily with aircraft capacity and proposed frequency.
For example: 36,500 annual directional passengers ≈ 100 PDEW
A market with 15,000 annual directional passengers represents only about 41 PDEW. Whether that is enough to support service depends on several factors:
- Aircraft size
- Proposed frequency
- Expected passenger capture
- Connecting demand
- Seasonality
- Potential demand stimulation
PDEW is therefore a useful screening metric, but it should not be treated as a route viability test by itself.
Separate Local Airport Demand from Total Market Demand
This distinction is particularly important for airports with substantial passenger leakage.
Suppose an airport’s own O&D data show only 20 PDEW to Destination X. Passenger-location analysis, however, identifies another 50 PDEW from the airport’s market using competing airports for the same destination. The true market is therefore closer to 70 PDEW.
Looking only at the airport’s existing O&D traffic would make the opportunity easy to overlook. Measuring total catchment demand by destination can reveal markets where passengers already travel in meaningful numbers but currently begin their trips somewhere else.
Identify Where the Unserved Passengers Live
Two destinations can each generate 70 PDEW and still represent very different opportunities.
Suppose:
- Destination A: 70 PDEW, with most passengers living within 45 minutes of the airport.
- Destination B: 70 PDEW, with most passengers living 90–120 minutes away and relatively close to another airport.
Destination A is likely to be more addressable even though total demand is identical.
This is why passenger geography matters. Knowing where the passengers live helps an ASD team distinguish between demand that belongs naturally within the airport’s core market and demand that may be difficult to capture.
Compare Demand with Competing Air Service
A large market can become less attractive when nearby airports already provide extensive nonstop service.
Consider two unserved destinations:
| Market A | Market B | |
|---|---|---|
| Total demand | 85 PDEW | 95 PDEW |
| Local nonstop | None | None |
| Competing service | 2 nonstop flights per week | 3 combined daily nonstops |
Market B has greater passenger demand, but it also faces much stronger competition. Market A could potentially offer a more realistic opportunity despite being smaller.
For each candidate destination, ASD teams should examine:
- Total passenger demand
- Competing nonstop service
- Flight frequency
- Airlines serving the destination
- Fares
- Drive time to competing airports
The strongest unserved market is not always the largest one.
Look at Which Competing Airports Capture the Demand
The distribution of leakage can provide another clue.
Suppose an 85-PDEW market is currently divided as follows:
- Local airport: 10 PDEW
- Competitor A: 58 PDEW
- Competitor B: 12 PDEW
- Other airports: 5 PDEW
This pattern shows that passengers are not simply scattering among many airport alternatives. Most of the uncaptured demand is flowing through one competitor.
That gives the ASD team a more specific market to investigate. The team can examine why passengers are choosing Competitor A, including nonstop availability, fares, schedules, airline preference, and airport accessibility.
Which Airlines Are Already Carrying the Demand?
Airline usage adds another dimension to an unserved-market analysis. Suppose passengers from the airport’s market traveling to a particular destination currently use:
- Airline A: 55%
- Airline B: 30%
- Other airlines: 15%
If Airline A already serves the local airport, it may be a logical carrier to approach about the new route. The airport can show that the airline already has customers within its catchment, although some of those passengers currently drive elsewhere to access its service.
This does not mean all of that traffic would be incremental for the airline. Some passengers could simply shift from the airline’s operation at the competing airport. A stronger business case therefore separates existing airline customers from passengers who could be captured from competing carriers and demand that could be stimulated by improved local service.
Existing Routes Can Still Have Significant Uncaptured Demand
A high load factor does not necessarily mean a market is fully served.
Suppose an airport has one daily 76-seat flight operating at an 85% average load factor. The route appears successful. However, if the total market generates 130 PDEW and the flight captures only 55–60 PDEW, a substantial amount of demand may still be using competing airports.
Depending on the market, that could support:
- A second daily frequency
- A larger aircraft
- Additional seasonal capacity
- Better schedule timing
Instead of evaluating the existing flight in isolation, ASD teams should compare its performance and capacity with total market demand.
Schedule Can Create Underserved Demand
Capacity is only part of the equation. A destination may have enough seats but still be underserved because the schedule does not fit passenger needs.
For example, one daily flight departing at 3:00 PM may work well for leisure travelers but poorly for business passengers who need to reach the destination in the morning. If travelers continue driving to competing airports despite available local seats, schedule utility may be the problem.
Useful factors to examine include:
- Frequency
- Departure times
- Arrival times
- Connection opportunities
- Day-of-week patterns
In some markets, improving the schedule could be more valuable than simply adding seats.
Seasonality Can Reveal Opportunities
Annual averages can also hide attractive seasonal markets. Suppose a destination averages only 45 PDEW for the full year, but demand varies considerably:
- January–March: 80 PDEW
- April–May: 50 PDEW
- June–September: 25 PDEW
- October–December: 45 PDEW
A 45-PDEW annual average may make the route look marginal. The 80-PDEW winter market tells a different story and could potentially support seasonal nonstop service.
Seasonal analysis is particularly useful for markets influenced by:
- Winter or summer tourism
- Second-home owners and seasonal residents
- Holiday travel
- College calendars
- Major events
- Snowbird travel
Not every strong air service opportunity needs to become a year-round route.
International Demand Needs a Broader View
International opportunities can be particularly difficult to identify from the local airport’s traffic alone. Passengers are often willing to drive much farther to reach a major international gateway with nonstop service, lower fares, or better connecting options.
As a result, an airport may show relatively little international O&D traffic while its broader catchment generates substantial international demand. ASD teams should examine:
- Total international demand by destination
- Where those passengers live
- Gateway airports they currently use
- Airlines carrying the traffic
- Existing connecting itineraries
This broader view can uncover international markets that would remain largely invisible in local airport traffic data.
Business and Leisure Markets Behave Differently
Two destinations with similar PDEW may require very different types of service. Business-oriented markets often have more year-round demand, higher fares, stronger corporate support, and greater need for frequency and convenient schedules.
Leisure markets may have different characteristics, including:
- Larger seasonal peaks
- Greater fare sensitivity
- Strong weekend demand
- More tolerance for less-than-daily service
Understanding the composition of demand helps the airport determine not only whether a market is attractive, but what type of service is likely to fit it.
Build an Air Service Opportunity Ranking
Rather than ranking destinations only by PDEW, airport teams can build a multi-factor opportunity screen.
| Factor | Question |
|---|---|
| Total PDEW | How large is the market? |
| Local airport PDEW | How much demand do we already capture? |
| Demand gap | How much demand is not using the airport? |
| Existing nonstop | Is the market unserved or underserved? |
| Competing service | How strong are nearby alternatives? |
| Passenger geography | Where does the demand originate? |
| Seasonality | Is demand stable or seasonal? |
| Airline fit | Which carrier could logically serve it? |
| Fare level | What revenue potential may exist? |
| Network value | Could the route support connecting traffic? |
This produces a much more useful opportunity list than simply sorting destinations from largest to smallest. It also helps explain why one market deserves more attention than another.
Different Markets Lead to Different Opportunities
Not every promising destination should result in a request for a brand-new year-round route. The analysis may point to several types of air service opportunities:
- New nonstop opportunity: Large addressable demand with no existing local nonstop.
- Frequency opportunity: Existing service with strong remaining demand and limited schedule choices.
- Capacity opportunity: Demand exceeds the seats currently available.
- Seasonal opportunity: Demand is strong during a specific part of the year.
- Airline opportunity: The market may support an additional carrier or network option.
- Schedule opportunity: Capacity exists, but current flight times do not adequately serve passenger needs.
Classifying markets this way makes the analysis more actionable for both the airport and prospective airlines.
Use Fligence Planning to Identify and Test Opportunities
FlightBI’s Fligence ZIP-OD and Fligence Planning helps Air Service Development teams move from market discovery to route evaluation. Airports can screen unserved and underserved destinations using measures such as:
- Passenger demand and PDEW
- Current airport traffic
- Competing airport traffic
- Market share
- Fares
Once a promising market is identified, the airport can build a proposed service scenario and evaluate how the new schedule could change passenger flows. Fligence Planning uses a QSI model to account for traffic captured from existing itineraries as well as demand stimulation, providing a more realistic estimate of how a proposed route may perform.
The analysis can therefore move beyond “Which destinations appear underserved?” to the more useful question: “Which opportunities are strong enough to develop into an airline proposal?”
From Opportunity List to Airline Target List
Once promising destinations have been identified, ASD teams can narrow the analysis into a practical airline-development pipeline:
- Rank destinations by total and addressable demand.
- Identify the strongest unserved and underserved markets.
- Examine competing service and passenger geography.
- Determine which airlines currently carry the demand.
- Evaluate airline network, schedule, and aircraft fit.
- Advance the strongest markets into scenario analysis.
This keeps the team focused on a manageable set of opportunities instead of producing a long list of destinations with little indication of which ones are realistic.
The Bottom Line
The destinations with the most unserved or underserved demand are not necessarily the largest destinations without nonstop service. A strong opportunity usually combines substantial total demand with a meaningful amount of uncaptured traffic, an addressable geographic market, insufficient existing service, and a realistic airline and aircraft fit.
PDEW provides a useful starting point, but it becomes much more valuable when combined with passenger geography, competing airport usage, nonstop capacity, schedules, fares, seasonality, and airline fit. This gives Air Service Development teams a clearer view of where passengers already want to go and where better air service has a realistic opportunity to capture more of that demand.