
Not all people have the same value to airports or airlines. Some people rarely travel or do not travel by air at all, while others take many air trips each year. Among air travelers, some are highly price-sensitive, while others are willing to pay more for nonstop service, better schedules, convenience, flexibility, extra space, or a better overall travel experience.
Understanding where these higher-value passengers live can help airports identify valuable catchment areas, strengthen airline business cases, and target marketing more effectively.
There are two types of higher-value passengers:
- High-income households, which show where residents with greater purchasing power live
- Premium air travelers, which show where passengers purchasing higher-value air travel actually originate
These are not the same thing. But they are closely related.
High Income Is a Useful Proxy for Premium Travel
A high-income household does not necessarily produce a premium air traveler. A household earning $250,000 may still purchase the lowest available economy fare. At the same time, a corporate traveler may regularly purchase expensive tickets because the employer pays for the trip.
However, household income and premium air travel tend to be highly correlated. Higher-income households generally have greater ability to pay for premium cabins, flexible fares, extra-legroom products, convenient schedules, and nonstop service. On the business travel side, careers that involve frequent employer-paid premium travel also tend to be higher-paying.
Therefore, when reliable premium passenger geography is available, airports should use it. When it is not available, the geographic distribution of high-income households can provide a useful proxy for where premium travel demand is likely to be concentrated.
The key is to treat income as an indicator of premium-market potential, not as a direct measurement of premium passengers.
Look Beyond Median Household Income
Median household income is useful, but it does not tell the whole story.
Consider two ZIP codes:
| ZIP A | ZIP B | |
|---|---|---|
| Median household income | $125,000 | $110,000 |
| Households earning $150,000+ | 2,500 | 6,500 |
ZIP A has the higher median income, but ZIP B contains far more households earning more than $150,000.
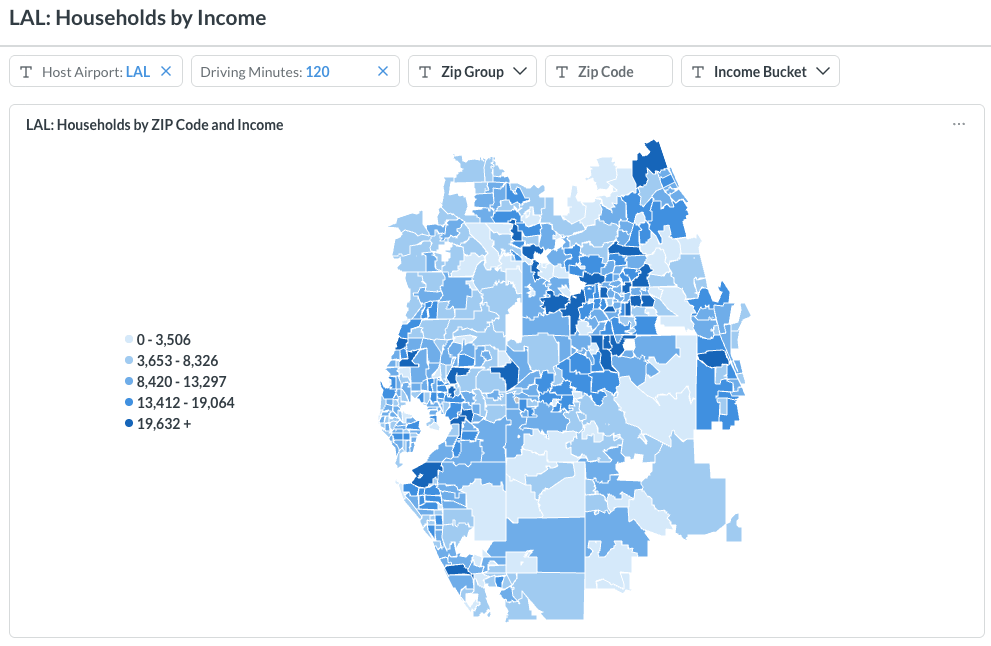
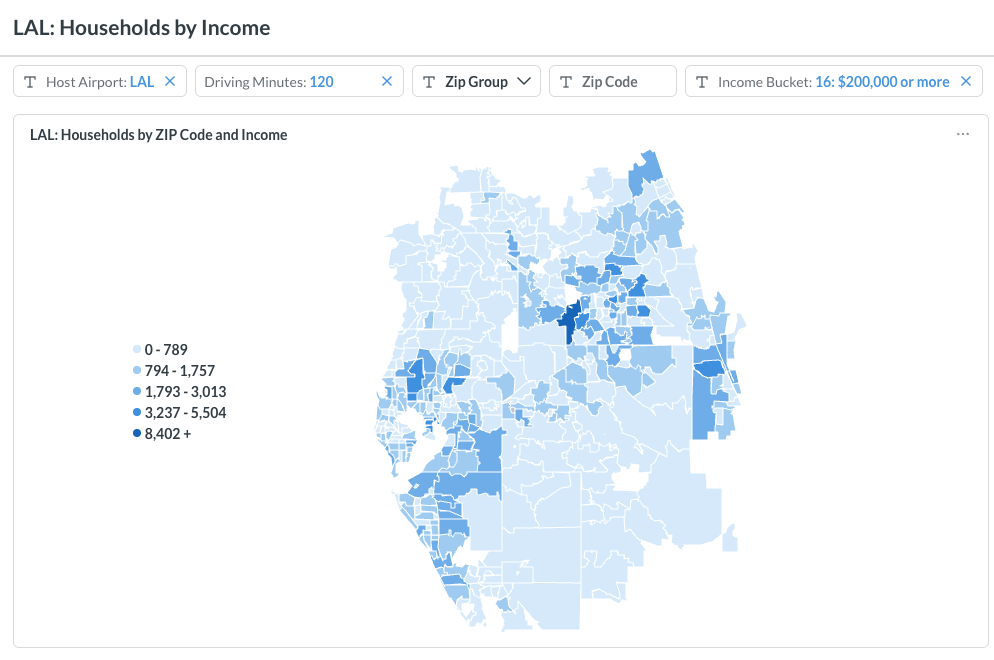
For airport analysis, household counts by income bucket can therefore be more useful than median income alone. They measure the actual size of the affluent population within each geographic market. For example, Fig. 1 and Fig. 2 show heat maps of households within a two-hour drive of Lakeland Airport (LAL). Fig. 1 includes all households while Fig. 2 includes only affluent households with annual income of $200,000 and more. The two maps show distinctly geographic distribution patterns.
This becomes particularly important in large metropolitan areas where a densely populated, moderately affluent ZIP code may contain more high-income households than a smaller community with a much higher median income.
Premium Passengers Definition
It is also important not to define premium passengers too narrowly. The traditional definition might focus on passengers flying first or business class on a full-service airline. Today’s airline products are more diverse.
Consider JSX. Its aircraft (ERJ-135, ERJ-145 and ATR 42-600) are configured with only 30 passenger seats, 20%-40% less than typical configuration of those aircraft. The product is specifically designed around a more premium travel experience, including additional space and a simplified airport experience. An airport evaluating potential demand for JSX would therefore be particularly interested in where higher-income and higher-value travelers are concentrated.
Premium travelers can also fly low-cost and ultra-low-cost carriers. Before its demise, Spirit Airlines attracted higher-income travelers to its Big Front Seat product when its routes and schedules met their needs. The appeal of premium seating within the ULCC model is also reflected in Frontier and Allegiant Air introducing first-class products. LCCs such as JetBlue and Breeze Airways offer premium products through Mint and Ascent, respectively. At the same time, affluent travelers may also choose economy when a low-cost carrier offers the most convenient nonstop schedule.
The airline’s business model therefore does not determine the value of its passengers. A premium traveler may fly a legacy carrier, a premium-focused operator, an LCC, or even a ULCC.
High-Income Travelers Matter Even When They Fly Economy
This distinction is particularly important for airport planning.
An affluent passenger does not need to purchase a first-class ticket to represent valuable demand.
Higher-income travelers may place greater value on:
- Nonstop availability
- Schedule quality and frequency
- Airport convenience
- Shorter drive times
- Extra-legroom or premium seating
- Flexibility
- Airline loyalty
- Lounge access
- International connectivity
- Total travel time
Consider a traveler choosing between paying $250 for a connecting itinerary from the local airport and $200 for a nonstop flight from an airport 90 minutes farther away. The traveler’s decision may have relatively little to do with the $50 airfare difference. Time and convenience may matter much more.
That makes high-income passenger geography relevant even for routes without traditional premium cabins.
Compare Premium Travelers with the Overall Passenger Market
When actual premium passenger estimates are available, airports can go beyond household income and determine whether premium travelers have a different geographic distribution from the overall passenger market.
Consider this example:
| ZIP Code | Share of All Passengers | Share of Premium Passengers |
|---|---|---|
| ZIP A | 8% | 15% |
| ZIP B | 10% | 12% |
| ZIP C | 12% | 6% |
| ZIP D | 6% | 11% |
ZIP C generates the most passengers overall, but contributes a relatively small share of premium travelers. ZIP A shows the opposite pattern. It accounts for only 8% of passengers but 15% of premium passengers. A standard passenger-volume analysis might emphasize ZIP C. A premium-market analysis would identify ZIP A as particularly important.
An airport can then compare this passenger behavior with household income. If ZIP A also contains a large concentration of high-income households, the two independent measures reinforce the conclusion that this is an important higher-value market.
Premium Geography Changes by Destination
Airport-wide premium passenger data is useful, but route-level analysis can be even more valuable for Air Service Development.
Suppose an airport is evaluating nonstop service to London. Rather than asking only:
Where do our premium passengers live?
The ASD team can ask:
Where do premium passengers traveling to London or Europe live?
The answer may be very different.
Premium demand to New York, Los Angeles, London, Seoul, or a leisure destination may originate from different portions of the catchment because the economic, business, cultural, and demographic relationships behind those markets differ.
For route development, the strongest analysis connects:
Passenger segment + destination + passenger ZIP code
This gives an airline much more specific evidence than an airport-wide premium passenger total.
Find Valuable Markets Where the Airport Underperforms
High-income and premium passenger geography becomes particularly actionable when combined with airport market share.
Consider:
| ZIP Code | Premium Passenger Demand | Local Airport Share |
|---|---|---|
| ZIP A | 8,000 | 70% |
| ZIP B | 10,000 | 35% |
| ZIP C | 6,500 | 40% |
| ZIP D | 4,000 | 75% |
ZIP B immediately stands out. It generates the most premium demand, but the local airport captures only 35%.
The next questions are:
- Where are these passengers traveling?
- Which competing airports are they using?
- Which airlines are they choosing?
- Are they driving elsewhere for nonstop service?
- Are they purchasing premium products at the competing airport?
The answers determine whether ZIP B represents an Air Service Development opportunity, a marketing opportunity, or both.
Premium Demand Can Support Different Airline Models
Premium-market analysis is useful for much more than attracting traditional first- and business-class service.
For a network carrier considering a long-haul route, an airport might demonstrate strong business-class and premium-economy demand.
For an airline such as JSX, the airport might demonstrate a large concentration of affluent passengers who value convenience, time savings, and a premium travel experience.
For an LCC or ULCC, the opportunity could look different. Affluent passengers may still choose the carrier because it provides the right nonstop route or schedule, while purchasing premium seating, bundles, priority services, or other higher-value products.
The question is therefore not simply:
“How many first-class passengers do we have?”
A better question is:
“How large is the market of passengers willing and able to pay more for the right air travel product?”
Use Premium Demand in Airline Business Cases
Passenger volume tells an airline how large a market is. High-income and premium passenger analysis can help demonstrate the potential revenue quality of that demand. This matters because premium passengers can account for a disproportionate share of airline revenue and profitability.
Instead of telling an airline only that a proposed market generates 120 PDEW, an airport might show that: A substantial portion of those passengers comes from affluent ZIP codes close to the airport, premium passenger demand is concentrated in the same area, and many of those travelers currently use a competing airport.
That creates a much richer picture of the opportunity. It can be particularly valuable for routes where revenue quality matters as much as raw passenger volume.
Market Differently to High-Income Travelers
Marketing to affluent travelers also does not necessarily need to focus on the lowest airfare. For these passengers, messages emphasizing time and convenience may be more effective:
- “Fly nonstop from your local airport.”
- “Spend less time driving to the airport.”
- “Skip the larger hub.”
- “Get home sooner.”
This can be especially valuable for regional airports competing against larger airports.
A high-income traveler may willingly pay somewhat more to use the local airport when the difference in schedule and airline product is relatively small. Conversely, that traveler may drive much farther when the competing airport provides a substantially better nonstop option.
Understanding both income and actual airport-choice behavior helps distinguish these situations.
High-Income Markets Can Also Support Leisure Routes
Higher-value demand is not limited to corporate travel. High-income households can generate substantial discretionary travel to international destinations, ski resorts, beaches, second homes, and weekend destinations.
Second-home markets can be especially interesting. Property owners may travel repeatedly between their primary and secondary residences and may place a high value on nonstop service, convenient schedules, and airport accessibility.
For airports serving resort destinations, these passengers can generate substantial higher-value demand that would not be apparent from the permanent local population alone.
How Fligence ZIP-OD Identifies High-Income and Premium Markets
FlightBI’s Fligence ZIP-OD allows airport teams to analyze high-income households geographically using median household income and household counts by income bucket at the ZIP-code level.
Where premium passenger estimates are available, airports can compare those passengers directly with household income and overall passenger demand.
For an important ZIP code, an airport can examine:
- Total passenger demand
- Estimated premium passenger demand
- Premium share of passengers
- Median household income
- Number of households by income range
- Airport market share
- Competing airport usage
- Major destinations
A Practical Premium-Market Analysis
Airport teams can follow a simple hierarchy:
- Map high-income households. Identify ZIP codes containing large concentrations of affluent households.
- Add premium passenger data when available. Determine whether actual premium travel follows the same geographic pattern.
- Compare with total passenger demand. Identify areas that over-index for higher-value passengers.
- Add airport market share. Find valuable areas where the local airport is underperforming.
- Analyze destinations and airlines. Determine where those passengers travel and which competing services they use.
- Match the opportunity to the airline product. The opportunity might support a traditional premium cabin, an airline such as JSX, or premium products offered by an LCC or ULCC.
- Target ASD and marketing efforts. Use the findings to support route development, airline discussions, corporate outreach, and geographic marketing.
The Bottom Line
High-income households are not the same as premium air travelers, but the two are strongly related.
When premium passenger geography is available, it provides a more direct measure of higher-value travel behavior. When it is not, high-income household distribution provides a useful proxy for locating potential premium demand.
At the same time, airports should think beyond traditional first and business class. Premium travelers can choose an all-premium-style operator such as JSX, a legacy carrier, an LCC, or even an ULCC when the route, schedule, convenience, and product meet their needs.
The objective is not simply to identify people who buy first-class tickets. It is to understand where higher-value travelers live, where they are going, what products they choose, which airports they use, and what could persuade them to choose your airport instead.