
Airport passenger leakage occurs when travelers within an airport’s natural market choose to begin their trip at another airport. It is particularly important for small and midsize airports located within driving distance of larger airports, but leakage can occur in almost any multi-airport region.
For example, if residents within an airport’s market generate 1 million annual air passenger trips but only 600,000 use the local airport, a portion of the remaining 400,000 trips may represent passenger leakage to other airports.
Measuring leakage helps airports answer three fundamental questions:
- How many local passengers are using other airports?
- Where do those passengers live?
- Which airports and destinations are capturing that demand?
A detailed leakage analysis goes beyond a single airport-wide percentage. It measures passenger behavior geographically, ideally at the ZIP-code level, and can examine leakage by destination, competing airport, passenger segment, and time period.
How Is Airport Passenger Leakage Calculated?
At its simplest, passenger leakage can be expressed as:
Passenger Leakage Rate = Passengers Using Other Airports ÷ Total Air Passenger Demand × 100
Suppose residents of an airport’s market generate 500,000 annual air passenger trips:
| Airport Used | Passenger Trips | Share |
|---|---|---|
| Local Airport | 300,000 | 60% |
| Competing Airport A | 125,000 | 25% |
| Competing Airport B | 50,000 | 10% |
| Other Airports | 25,000 | 5% |
| Total | 500,000 | 100% |
The local airport retains 60% of the market, while 40% of resident passenger demand uses other airports.
In a simple analysis, that 40% represents the potential leakage pool.
However, the calculation itself is only the beginning. Airports need to understand where that leakage occurs and what portion of it represents a realistic opportunity.
The Most Important Part Is Defining the Market
Before calculating leakage, an airport needs to define which passengers belong to the market being analyzed.
This is one of the most important methodological decisions in a leakage study.
Using everyone within an arbitrary 75-mile radius, for example, could substantially overstate leakage because some communities near the edge of the study area may naturally have a much stronger relationship with another airport.
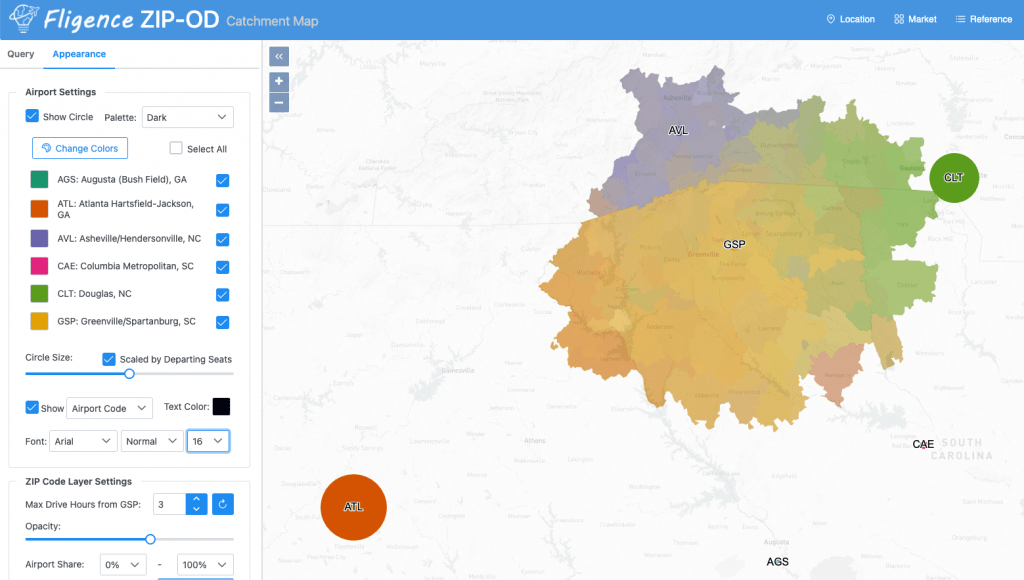
For example, the colored area in Fig. 1 represents a 75-mile radius around GSP Airport. This catchment definition may be reasonable for areas south of GSP, but it becomes problematic to the north because it includes Asheville (AVL) and many counties that are closer to Charlotte (CLT). Using this definition, GSP would appear to have significant passenger leakage to AVL and CLT. However, much of this traffic may not truly belong to GSP’s natural market in the first place.
A behavioral catchment provides another approach. Instead of assuming that everyone inside a geographic boundary belongs equally to the airport, passenger demand and actual airport usage can be analyzed geographically.
This makes it possible to distinguish between:
the airport’s core passenger market
and
areas where the airport has only a limited presence.
Leakage estimates become more meaningful when they are evaluated within the context of the airport’s actual geographic market.
Measure Leakage at the ZIP-Code Level
A single leakage percentage for the entire airport market can hide substantial geographic differences.
Consider four ZIP codes:
| ZIP Code | Total Air Demand | Local Airport | Other Airports | Leakage Rate |
| ZIP A | 20,000 | 16,000 | 4,000 | 20% |
| ZIP B | 30,000 | 18,000 | 12,000 | 40% |
| ZIP C | 40,000 | 16,000 | 24,000 | 60% |
| ZIP D | 10,000 | 2,000 | 8,000 | 80% |
The airport may have a relatively strong position in ZIP A but experience substantial leakage in ZIP C and ZIP D.
However, ZIP C represents 24,000 leaked passenger trips, compared with only 8,000 in ZIP D.
Therefore, ZIP C may be more important even though its leakage rate is lower.
This demonstrates why airports should look at both:
Leakage percentage
and
Leakage passenger volume
when evaluating the market.
Where Are Passengers Leaking To?
Knowing that passengers are using another airport is not enough. Airports also need to identify which airports are capturing those travelers.
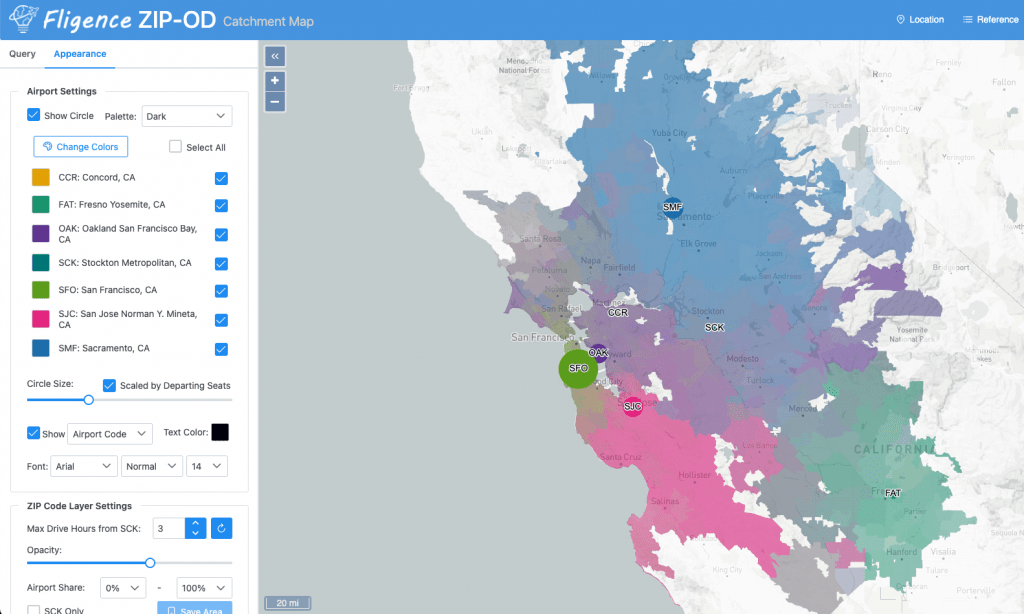
For example, Stockton Airport (SCK) estimates 1.86 million annual leaked passenger trips:
Sacramento (SMF): 698,610
San Francisco (SFO): 632,690
Oakland (OAK): 317,570
Other airports: 211,200
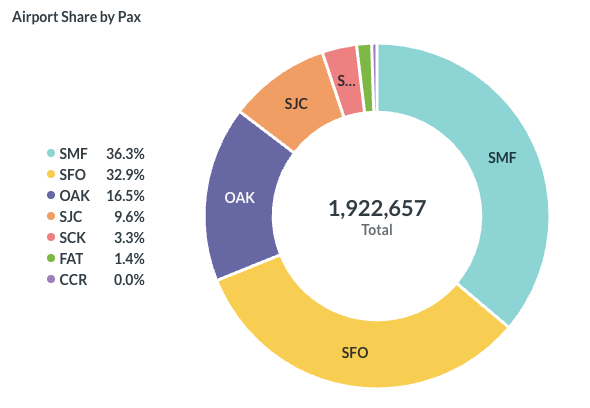
SMF and SFO clearly have the greatest impact on the local airport’s market, but their influence varies geographically. Communities on the northern side of the catchment may primarily use SMF, while communities in another direction are more likely to use SFO or OAK.
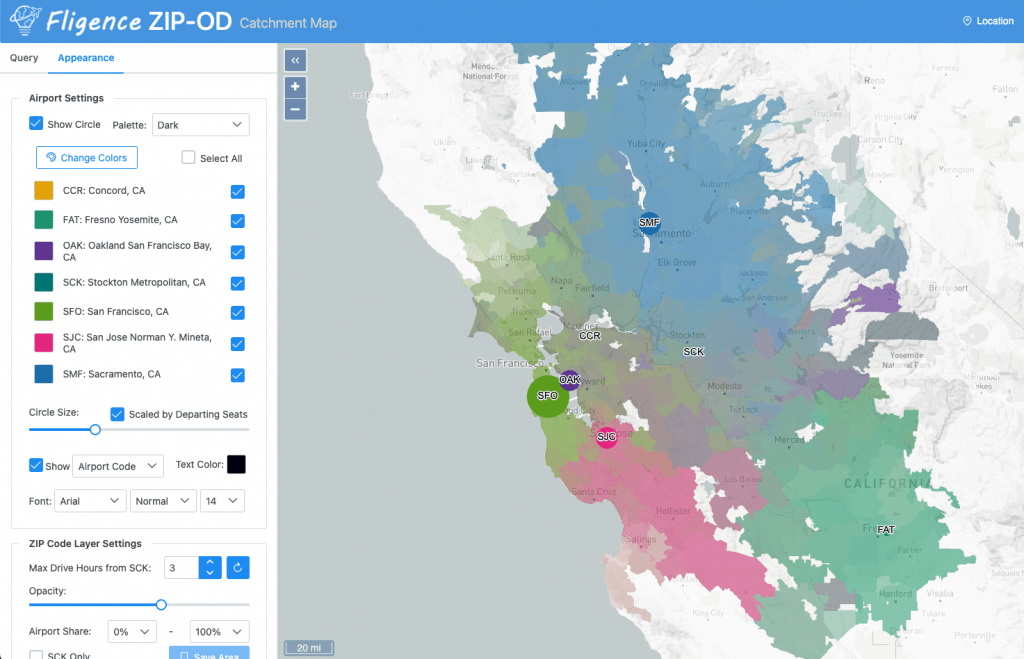
The example demonstrates an important point about leakage: travelers within an airport’s geographic market may distribute themselves among several larger airports rather than one dominant competitor.
For Stockton, understanding leakage therefore requires more than simply comparing itself with one competitor. The broader San Francisco airport system and Sacramental airport influence passenger behavior throughout the region.
Transborder Leakage
Air passenger leakage is not limited by national borders. In regions near the U.S.–Canada and U.S.–Mexico borders, passengers may choose to drive across the border and fly from an airport in another country.
For example, Fig. 3 shows that 9.6% of passengers from U.S. ZIP codes within a one-hour drive of BUF airport use Toronto Pearson International Airport (YYZ). Similarly, Fig. 4 shows that travelers in the Laredo area may cross the border to use Monterrey International Airport (MTY). These larger airports across the border may attract passengers by offering more nonstop destinations and, in some markets, lower airfares.
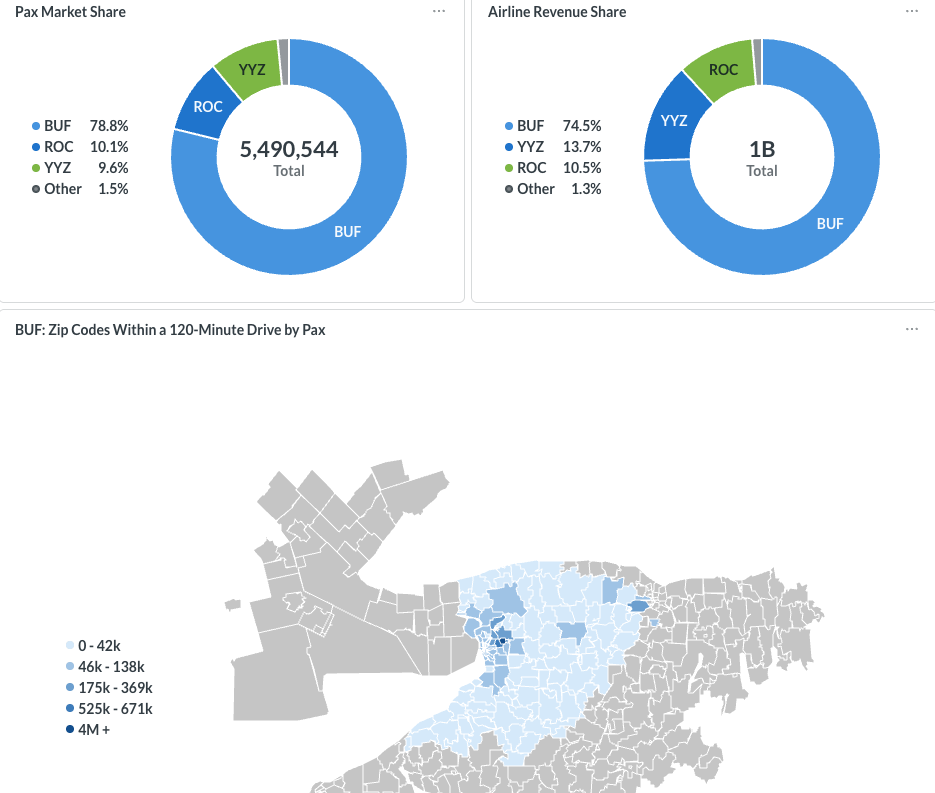
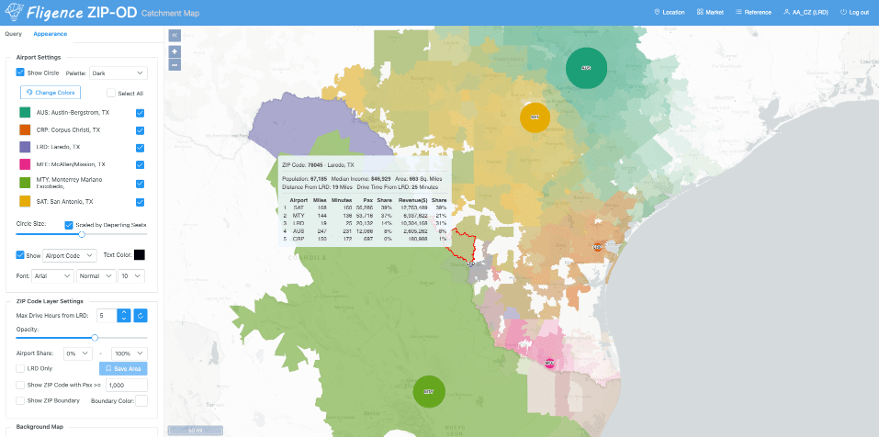
Fligence ZIP-OD incorporates mobile phone and hotel data across the United States, Canada, and Mexico to estimate transborder passenger leakage, helping airports near international borders better understand their true competitive market.
Leakage of Domestic versus International Trips
Sarasota Bradenton Airport (SRQ) provides another useful example.
Fligence catchment analysis found that domestic passenger demand was distributed among several airports.
Across the ZIP codes within 1-hour drive to SRQ:
- Tampa International (TPA): 59.1%
- Sarasota-Bradenton (SRQ): 17.3%
- St. Pete-Clearwater (PIE): 8.5%
- Orlando International (MCO): 5.5%
- Punta Gorda (PGD): 5.2%
- Southwest Florida (RSW): 4.4%
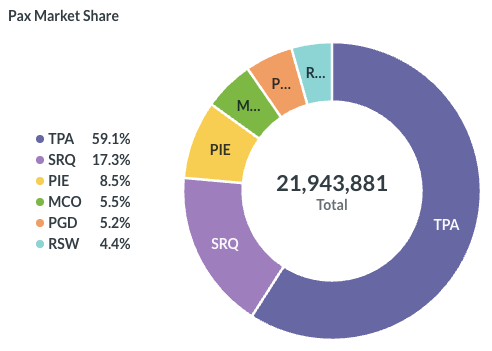
The pattern changes dramatically for international travel. Tampa International Airport’s (TPA) share increases from 59.1% to 79.8%, while Orlando International Airport’s (MCO) share nearly doubles from 5.5% to 9.9%. In contrast, smaller airports such as PIE and PGD capture almost no international traffic. SRQ’s own market share also declines, largely because of its relatively limited international nonstop service.
- Tampa International (TPA): 79.8%
- Orlando International (MCO): 9.8%
- Sarasota-Bradenton (SRQ): 7.8%
- Southwest Florida (RSW): 2.4%
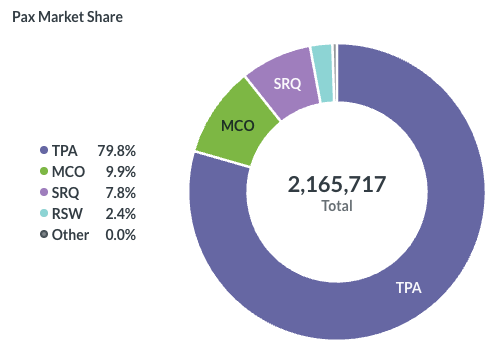
This shows why airport leakage should not always be measured as one airport-wide number. Domestic and international passengers can have very different leakage patterns.
Leakage Can Be Very Different by Destination
Airport-wide leakage tells an airport how much resident demand is leaving the market overall.
For Air Service Development, however, destination-level leakage may be even more useful.
Suppose residents within an airport’s market generate 50 PDEW to Nashville:
Local airport: 8 PDEW
Competing airports: 42 PDEW
If the local airport does not offer nonstop Nashville service, much of that demand may currently travel through other airports.
Now consider Orlando:
Local airport: 70 PDEW
Competing airports: 25 PDEW
The airport has a much stronger position for Orlando.
Looking only at overall leakage would hide this difference.
Destination-level analysis helps airports identify markets where substantial local passenger demand already exists but is currently using other airports.
Leakage Is Not the Same for Every Passenger Segment
Different types of passengers can also have different airport-choice patterns.
For example:
Premium passengers may place greater value on nonstop service, schedule, airline network, or frequent-flyer benefits.
Leisure passengers may be more sensitive to fare differences.
International passengers may travel farther to access a major international gateway.
Business travelers may place greater value on schedule and travel time.
As a result, an airport could retain a relatively high percentage of overall passengers while experiencing much greater leakage within a specific passenger segment.
Segment-level leakage analysis can reveal opportunities that may not be visible when looking at the total market. For example, Fig. 2 shows airport market share for the total market, while Fig. 5 focuses specifically on the leisure segment. In Fig. 2, SFO has a significant influence in the Stockton area. However, its impact becomes much smaller in the leisure market shown in Fig. 5. Instead, OAK takes a more prominent position, largely because of its strong Southwest Airlines presence, which is more heavily oriented toward leisure travelers.
Not All Leakage Is Equally Recoverable
This is one of the most important distinctions for airport decision-making.
An airport should not assume that every passenger using another airport can realistically be captured.
Consider two markets:
Market A: 50,000 leaked passengers live relatively close to the airport and travel to destinations the airport already serves.
Market B: 50,000 leaked passengers live near the outer edge of the catchment and primarily use another airport for international destinations unavailable locally.
Both show 50,000 leaked passengers.
But Market A may represent a much more addressable opportunity.
For this reason, airports should distinguish between total leakage and addressable or recoverable leakage.
Factors affecting recoverability can include:
- Available nonstop service
- Fare competitiveness
- Flight frequency
- Passenger location
- Destination
- Airline preference
- Ground accessibility
- Trip purpose
Leakage identifies where demand is leaving. Additional analysis determines where an airport has a realistic opportunity to change that behavior.
Leakage Can Reveal Air Service Opportunities
For Air Service Development teams, one of the most valuable applications of leakage analysis is identifying destinations with substantial local demand currently using other airports.
Suppose a market generates:
75 PDEW total demand
but only:
10 PDEW use the local airport
while:
65 PDEW use surrounding airports.
That does not automatically mean the airport can support new nonstop service. Aircraft size, frequency, stimulation, fares, connecting opportunities, seasonality, and airline strategy still need to be evaluated.
But it identifies a market worth investigating.
The Air Service Development team can then ask:
Where do those passengers live?
Which airports are they using?
What airlines are they flying?
What fares are they paying?
Would nonstop service change their airport choice?
Leakage analysis therefore works well as an opportunity-identification tool rather than as a standalone route forecast.
Leakage Analysis Can Also Guide Airport Marketing
For airport marketing teams, geographic leakage can help identify communities where additional passenger demand may be available.
However, a high leakage rate alone does not necessarily make a ZIP code the best marketing target.
Consider:
ZIP A: 80% leakage × 5,000 total passengers = 4,000 leaked passengers
ZIP B: 45% leakage × 30,000 total passengers = 13,500 leaked passengers
ZIP A has a much higher leakage percentage.
But ZIP B contains more than three times as many leaked passengers.
Marketing teams can therefore evaluate leakage together with:
Total passenger demand
Passenger location
Available air service
Demographics
Airport market share
This helps distinguish large addressable markets from areas that simply have a high leakage percentage.
Measure Leakage Over Time
Leakage should not be viewed as a permanent characteristic of an airport market.
Passenger behavior changes as airline service changes.
When an airport gains a new nonstop route, increases frequency, improves fares, or attracts a new airline, passenger retention may improve.
Conversely, service reductions can increase leakage.
Tracking leakage over time can help airports answer:
Is our share of local passenger demand improving?
Did a new route change passenger behavior?
Which communities showed the greatest change?
Did passenger retention improve for the destination where service was added?
This turns leakage analysis from a one-time catchment study into a performance measurement tool.
How Fligence Measures Passenger Leakage
FlightBI’s Fligence Leakage analysis estimates resident or visitor air passenger demand at the ZIP-code level and identifies the airports those travelers use.
This allows airport teams to examine:
- Total air passenger demand by ZIP code
- Passengers retained by the target airport
- Passengers using competing airports
- Leakage rate and passenger volume
- Which competing airports capture leaked passengers
- Destination-level passenger demand
Because the analysis is geographic, airports can see where leakage is concentrated rather than relying only on one market-wide percentage.
Fligence can also be used alongside passenger-location, fare, demographic, and air service analysis to provide context around the leakage patterns identified.
From Leakage Measurement to Action
The purpose of leakage analysis is not simply to produce a percentage.
A useful analysis should help an airport progress through four questions:
1. How much demand is leaving?
Measure passenger volume and leakage rate.
2. Where is it leaving from?
Identify the ZIP codes and communities generating leaked passengers.
3. Where is it going?
Identify the competing airports and destinations capturing that demand.
4. Which demand can we realistically address?
Evaluate service, fares, geography, passenger characteristics, and route opportunities.
This turns leakage from a descriptive statistic into actionable market intelligence.
The Bottom Line
Airport passenger leakage occurs when travelers within an airport’s market use another airport for their trip.
At the simplest level, leakage is measured as:
Passengers using other airports ÷ Total passenger demand × 100
But a useful airport leakage study goes much further.
It identifies how many passengers are leaking, where they live, which airports they use, which destinations they are traveling to, and how those patterns vary geographically and over time.
Most importantly, airports should distinguish between total leakage and realistically addressable leakage.
For Air Service Development teams, this can reveal markets where local passenger demand may support new or improved service. For airport marketing teams, it can identify geographic areas where substantial passenger demand exists but the airport is capturing only part of the market.
The goal is not simply to know that passengers are leaving.
It is to understand where the greatest opportunities exist to bring more of them back.