
Understanding an airport’s market requires more than knowing where passengers live.
Two ZIP codes can generate similar passenger volumes but have very different demographic and economic profiles. One may contain high-income households and frequent business travelers. Another may be dominated by university students, military personnel, hospital employees, or retirees.
For airport Air Service Development and Marketing teams, demographic and economic analysis helps answer:
- Who lives in our market?
- Which communities have the greatest economic capacity to travel?
- Where are major employment concentrations located?
- Which industries and institutions are likely to generate air travel demand?
Fligence ZIP-OD adds this context by combining passenger geography with population, income, household, and employment data at the ZIP-code level.
Start with Population Distribution
Population provides the foundation for understanding the scale of an airport’s surrounding market.
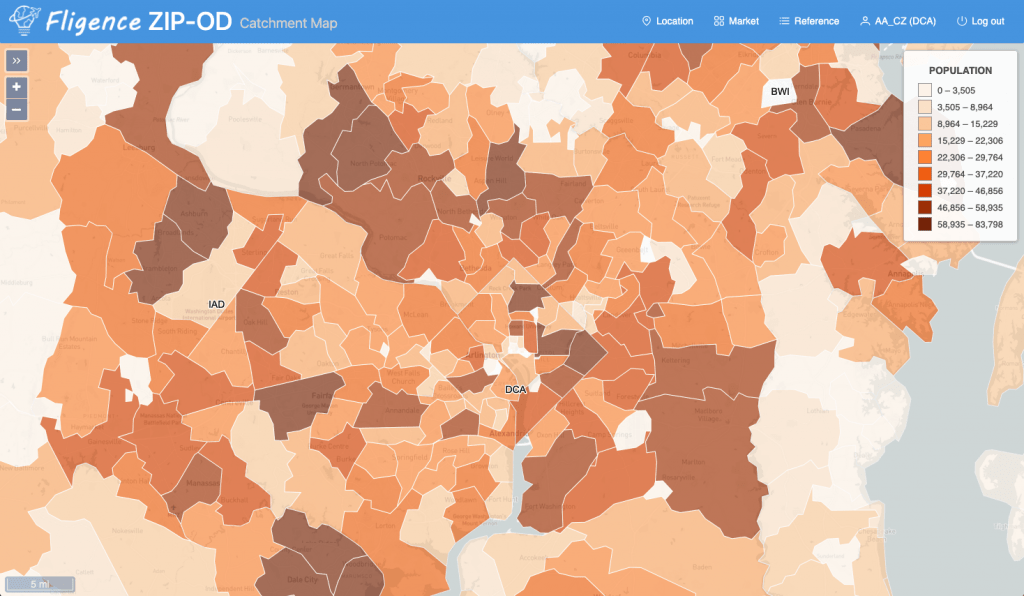
A population heat map can quickly show:
- Where the largest residential concentrations are located
- Which suburban areas are growing in importance
- How population is distributed across the catchment
- Whether the market is concentrated or geographically dispersed
This matters because a large population center may represent an important source of current or future passenger demand.
But population alone does not explain how much air travel a community is likely to generate. Two ZIP codes with the same population can have very different travel patterns because of differences in income, employment, age, and economic activity.
Add Median Household Income
Income can provide important context for air travel propensity. Higher-income households generally have greater ability to spend on:
- Leisure travel
- Premium travel
- International trips
- Second homes
- Frequent vacations
- Higher-fare itineraries
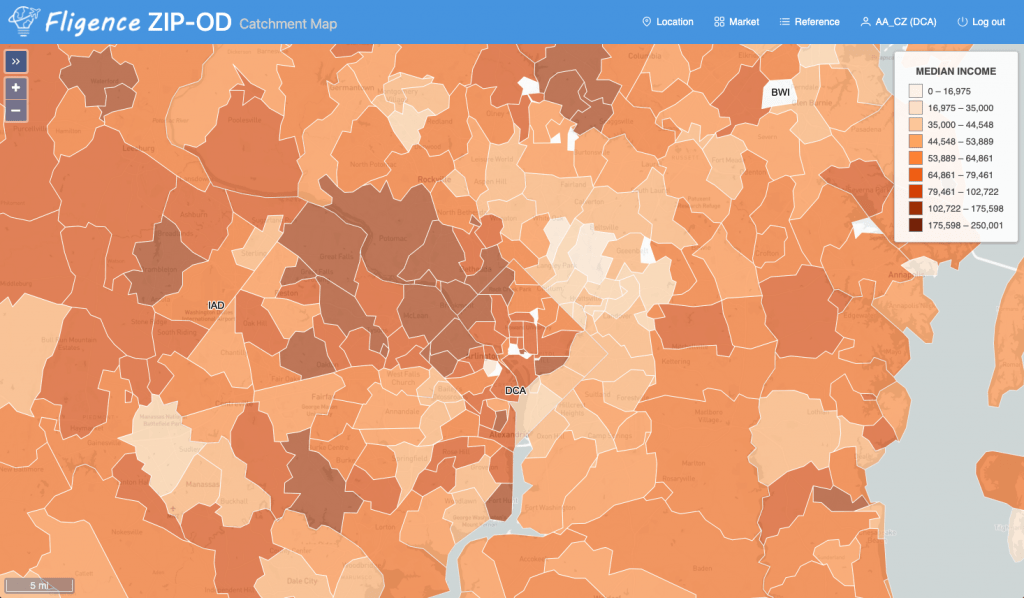
A median-income heat map allows airport teams to see where higher-income communities are concentrated across the market.
For example, Fig 1 and Fig 2 are population and median income heat maps around Ronald Reagan Washington National Airport (DCA). The airport authority discovered that a group of suburban ZIP codes to north-west of the airport generated moderate population but high passenger demand. Median income may help explain why.
This can also be useful when evaluating whether a market may support:
- Premium-oriented service
- International routes
- Higher-frequency business markets
- Targeted airport marketing
Median Income Does Not Tell the Whole Story
Median income is useful, but it compresses the entire household-income distribution into one number. Two ZIP codes can have the same median income while having very different household structures.
For example:
ZIP A
Median household income: $90,000
Most households concentrated between $75,000 and $125,000
ZIP B
Median household income: $90,000
Large concentrations of both lower-income and $150,000+ households
The median is identical. The underlying market is not. This is why household counts by income bucket can provide much deeper insight.
Analyze Households by Income Bucket
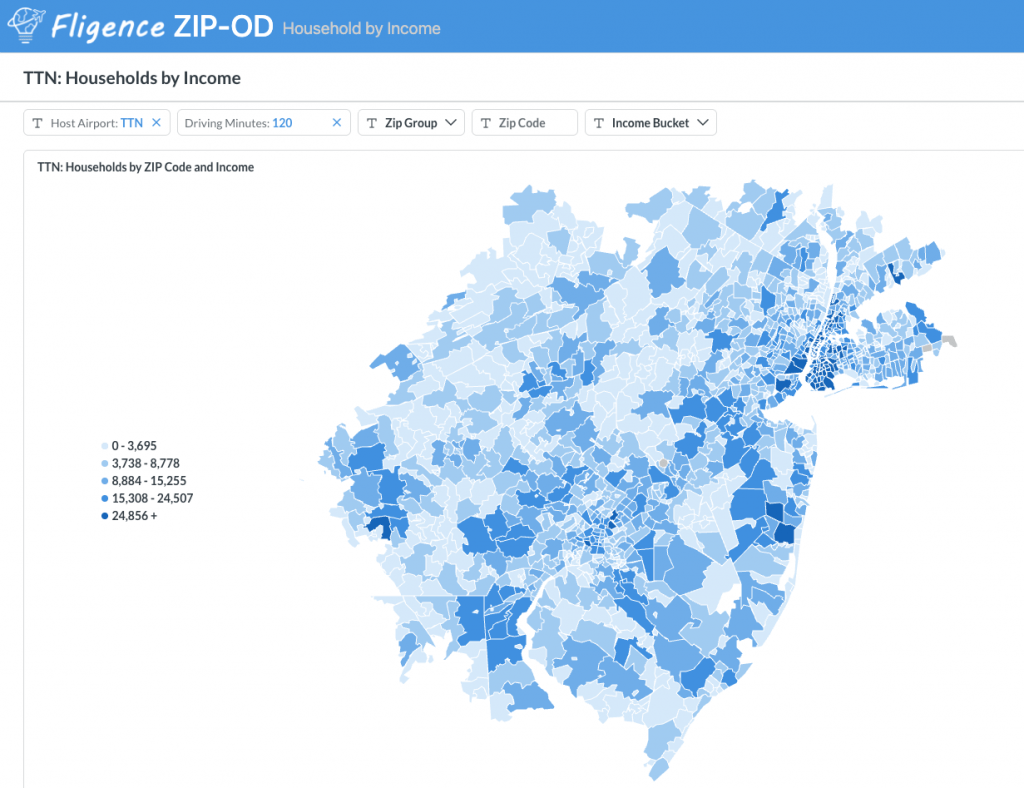
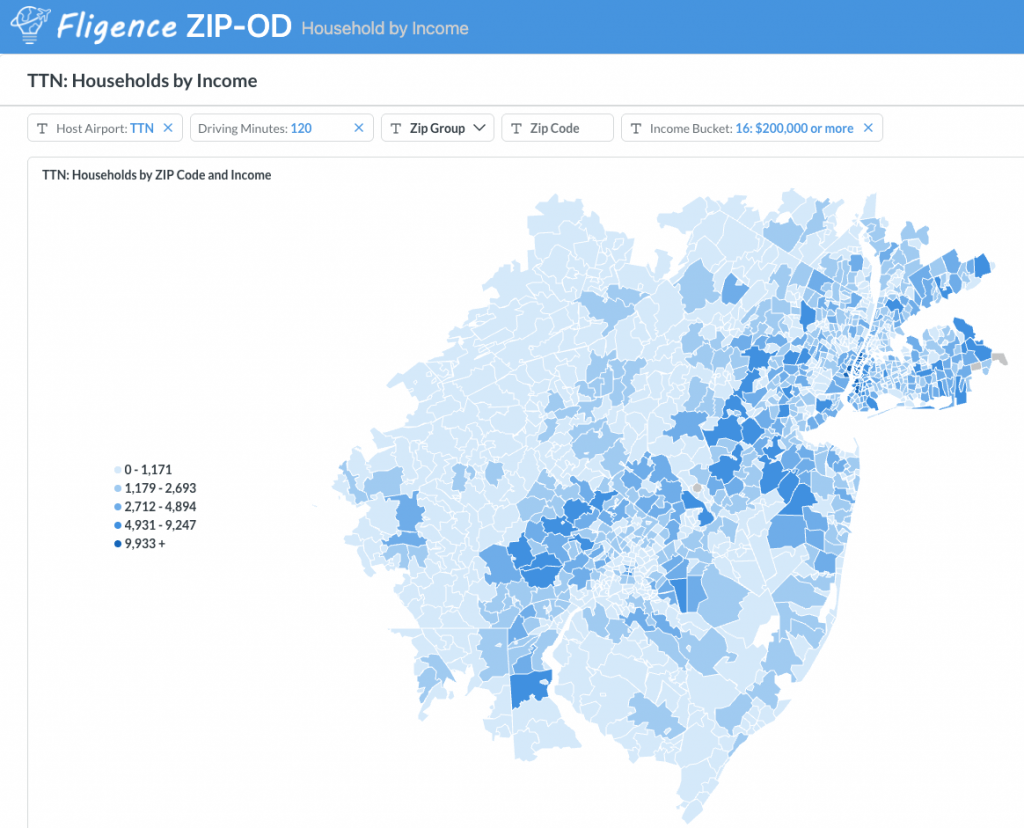
Fligence ZIP-OD includes household counts by income category at the ZIP-code level. For example, Fig. 3 and Fig. 4 show household heat maps for areas within a two-hour drive of Trenton-Mercer Airport (TTN), which is strategically located between Philadelphia and New York City.
If TTN considers only the overall household distribution, it may spread its marketing budget broadly across the surrounding region. However, a heat map focused on households earning more than $200,000 reveals a very different pattern. These higher-income households, which are more likely to generate more and higher-value air travel, are concentrated primarily in suburban communities along a relatively narrow corridor between Philadelphia and New York City.
This distinction can help the airport identify high-value geographic markets that may be less apparent from total population or household counts alone, allowing marketing resources to be targeted more precisely.
Why Income Distribution Matters for Airport Marketing
Different passenger groups may respond to different messages.
A market with a large concentration of high-income households may respond strongly to messaging around:
- Time savings
- Nonstop convenience
- Premium service
- International connectivity
- Easy parking and airport access
A more price-sensitive market may respond more strongly to:
- Competitive fares
- Low-cost airline service
- Total trip cost
Income data does not tell the airport exactly how each person will behave, but it can help shape the context in which passenger behavior is analyzed.
Look at Employment, Not Just Households
Airports serve economies as well as populations. Major employment centers can generate substantial travel through:
- Corporate travel
- Industry conferences
- Government travel
- University activity
- Medical travel
- Military travel
Understanding where employees work can therefore be as valuable as understanding where residents live.
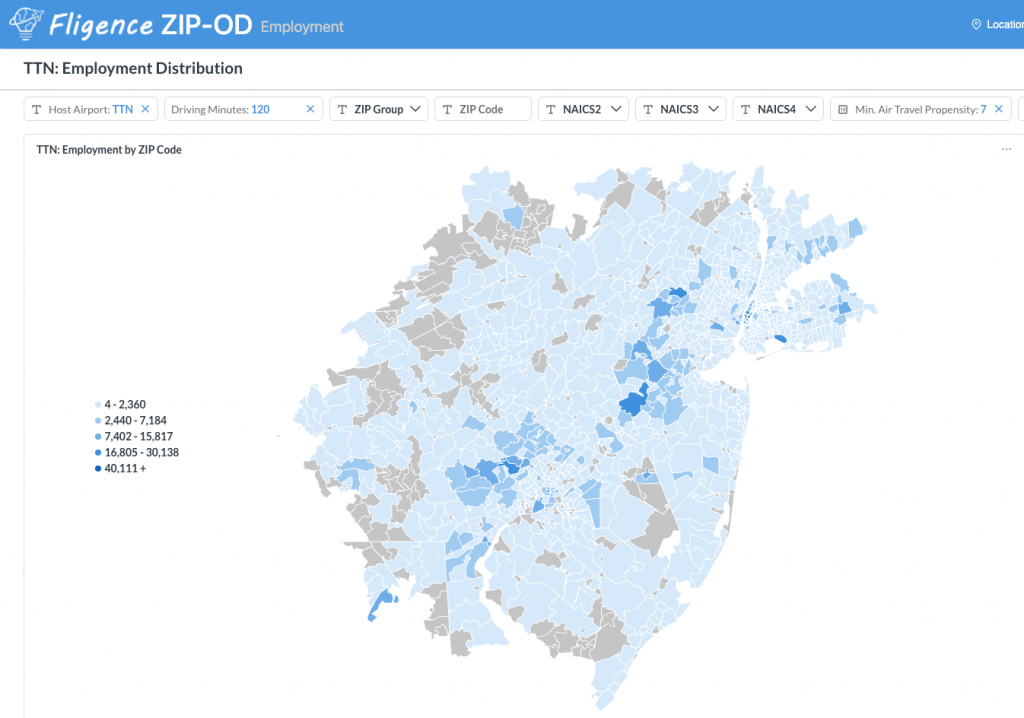
Fligence ZIP-OD includes employee counts by industry and ZIP code, allowing airport teams to identify geographic concentrations of economic activity.
Identify Major Industry Clusters
Different industries can generate very different travel patterns. For example, a ZIP code with a major concentration of technology employees may have strong business links to West Coast markets.
A concentration of Financial services employees may support stronger demand to New York or other financial centers.
A large Manufacturing cluster may generate travel to corporate headquarters, suppliers, and customers.
A strong Government employment base may generate recurring travel to Washington, D.C. or other government centers.
By mapping employment by industry, airports can connect economic structure with potential route demand.
University Students Can Be an Important Passenger Segment
University communities can create unusually strong and seasonal travel patterns. Students may generate demand around:
- Beginning and end of semesters
- Thanksgiving
- Winter break
- Spring break
- Summer
- Family visits
The geographic distribution of students can also affect which airport they use.
Fligence ZIP-OD can show university student concentrations by ZIP code, helping airport teams understand where student-related demand is located.
This can be especially useful for airports serving:
- College towns
- Large public universities
- Regional university systems
- Markets with substantial out-of-state enrollment
For route development, the student population may help explain unusually strong demand to specific metropolitan areas.
Hospital and Healthcare Employment Can Generate Travel
Hospitals and healthcare systems are often among the largest employers in regional economies. Healthcare-related travel can include:
- Medical professionals
- Researchers
- Conferences
- Vendor relationships
- Training
- Specialized medical travel
Fligence ZIP-OD can identify hospital employee concentrations by ZIP code, allowing airport teams to understand where major healthcare employment centers sit within the market.
This context can support analysis of both business travel and broader economic activity.
Government Employment Can Create Distinct Travel Patterns
Government workers can also represent an important passenger segment. Markets with large concentrations of federal, state, or local government employment may have recurring travel patterns tied to:
- Washington, D.C.
- State capitals
- Regional offices
- Conferences
- Training
- Agency operations
Mapping government employees by ZIP code can help explain why certain communities generate stronger demand to specific destinations than population alone would suggest.
Military Personnel Can Be Especially Important in Some Markets
Military bases can create major travel demand that is not fully explained by local household demographics. Military-related travel can include:
- Permanent-change-of-station moves
- Training
- Official travel
- Family visits
- Deployments
- Contractor activity
A market with a large military presence may therefore have very different passenger patterns from a similarly sized civilian market.
Fligence ZIP-OD can show military population or employment concentrations by ZIP code, allowing airports to identify where this demand is geographically concentrated.
This can be especially valuable for airports near:
- Army installations
- Air Force bases
- Naval facilities
- Marine Corps bases
- Joint military facilities
Combine Passenger Demand with Demographics
The greatest value comes from combining demographic data with actual passenger behavior.
Suppose two ZIP codes each generate 30,000 annual passenger trips:
ZIP A
Population: 55,000
Median income: $75,000
Limited major employment centers
ZIP B
Population: 35,000
Median income: $135,000
Large technology employment cluster
The passenger volume is the same, but the underlying market characteristics are very different.
ZIP B may contain:
- More frequent travelers
- Higher-value passengers
- Stronger business demand
- More premium potential
This helps airport teams understand why passenger demand exists, not just where it exists.
Identify High-Travel-Propensity Markets
A useful metric is passenger demand relative to population or households.
Suppose:
ZIP A
Population: 60,000
Annual passenger trips: 24,000
ZIP B
Population: 35,000
Annual passenger trips: 28,000
ZIP B generates more air travel despite having a much smaller population. Demographic and employment data can help explain this pattern. Possible reasons may include:
- Higher income
- More business employment
- University population
- Government employment
- Greater premium-passenger concentration
These markets can be particularly important because they generate disproportionately high aviation demand.
Compare Demographics with Airport Market Share
Demographic analysis becomes even more useful when combined with airport usage.
Suppose a high-income ZIP code generates substantial air travel but the local airport captures only 30% of that demand. That may represent a strategically important market. The airport can then examine:
- Which airports residents use
- Which destinations they travel to
- Whether premium travel is unusually high
- Whether local service meets their needs
For Marketing teams, this may become a priority audience. For Air Service Development, it may reveal route or service gaps.
Use Employment Data in Airline Business Cases
Airlines are often interested in knowing why a market generates demand. A route proposal becomes stronger when the airport can move beyond:
“Our catchment has 1.2 million people.”
to:
“The market contains a major concentration of technology employment with strong business relationships to the Bay Area.”
or:
“Our region includes a large military population and significant recurring travel to this destination.”
The first statement describes population while the second explains economic demand drivers. That can make the route story more credible.
University Market Examples
There are several regional airports serving large universities in the United States, including State College Regional Airport (SCE), serving Penn State University; Ithaca Tompkins International Airport (ITH), serving Cornell University and Ithaca College; Charlottesville-Albemarle Airport (CHO), serving the University of Virginia; Gainesville Regional Airport (GNV), serving the University of Florida; Lafayette Regional Airport (LFT), serving the University of Louisiana at Lafayette; and University of Illinois Willard Airport (CMI), serving the University of Illinois Urbana-Champaign.
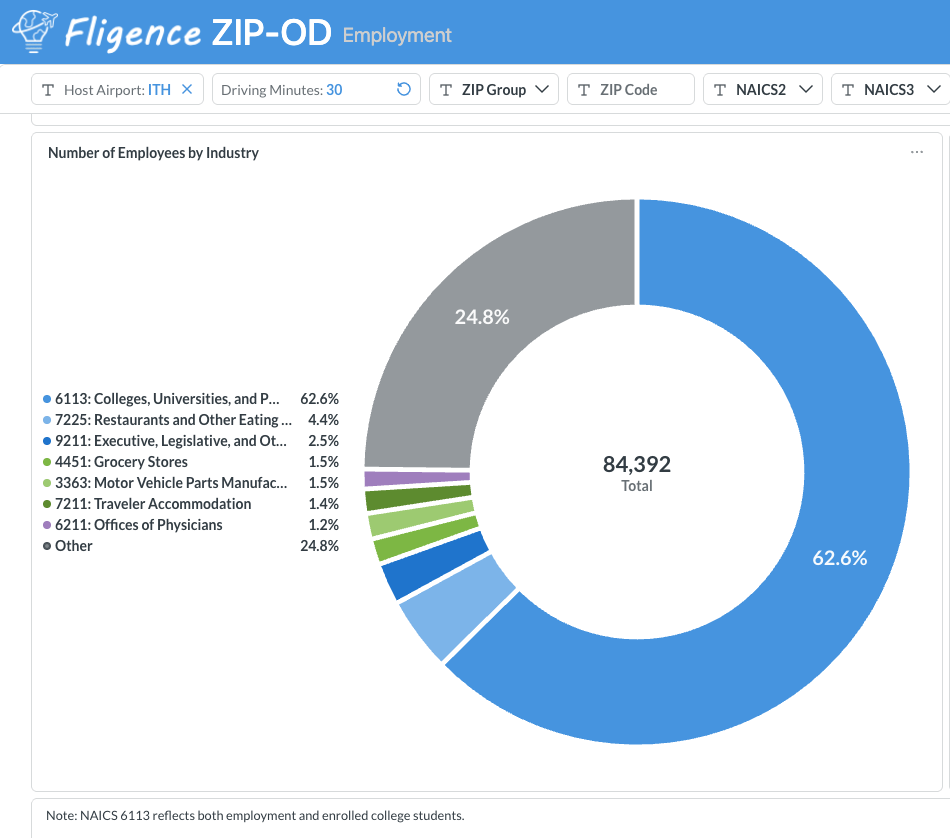
For these airports, the size of the surrounding metropolitan population may understate the potential for air travel. Ithaca, New York, provides a good example. While the local population is relatively modest, the Fligence ZIP-OD Employment Dashboard identifies 52,841 college students and employees associated with Cornell University, Ithaca College, and other higher-education institutions within a 30-minute drive of ITH.
This large university population can generate significant air travel demand to major markets such as New York, Washington, D.C., Chicago, and Los Angeles. Historical O&D data may already reveal strong demand to these destinations, but student and employment data provide important context for understanding why that demand exists.
These demographics can also help airports understand seasonal travel patterns associated with the academic calendar and identify opportunities to coordinate with universities on targeted marketing during peak periods such as the beginning and end of semesters, holidays, and school breaks.
Government and Military Market Examples
Several airports in the United States serve markets with significant military, federal government, and defense-related employment. Examples include Destin-Fort Walton Beach Airport (VPS), whose region includes Eglin Air Force Base and Hurlburt Field; Fayetteville Regional Airport (FAY), serving Fort Bragg (formerly Fort Liberty); and Colorado Springs Airport (COS), whose market includes Fort Carson, Peterson Space Force Base, Schriever Space Force Base, the U.S. Air Force Academy, and NORAD/U.S. Northern Command. Huntsville International Airport (HSV) provides another strong example, with demand supported by Redstone Arsenal, NASA’s Marshall Space Flight Center, the Missile Defense Agency, and a large concentration of aerospace and defense contractors.
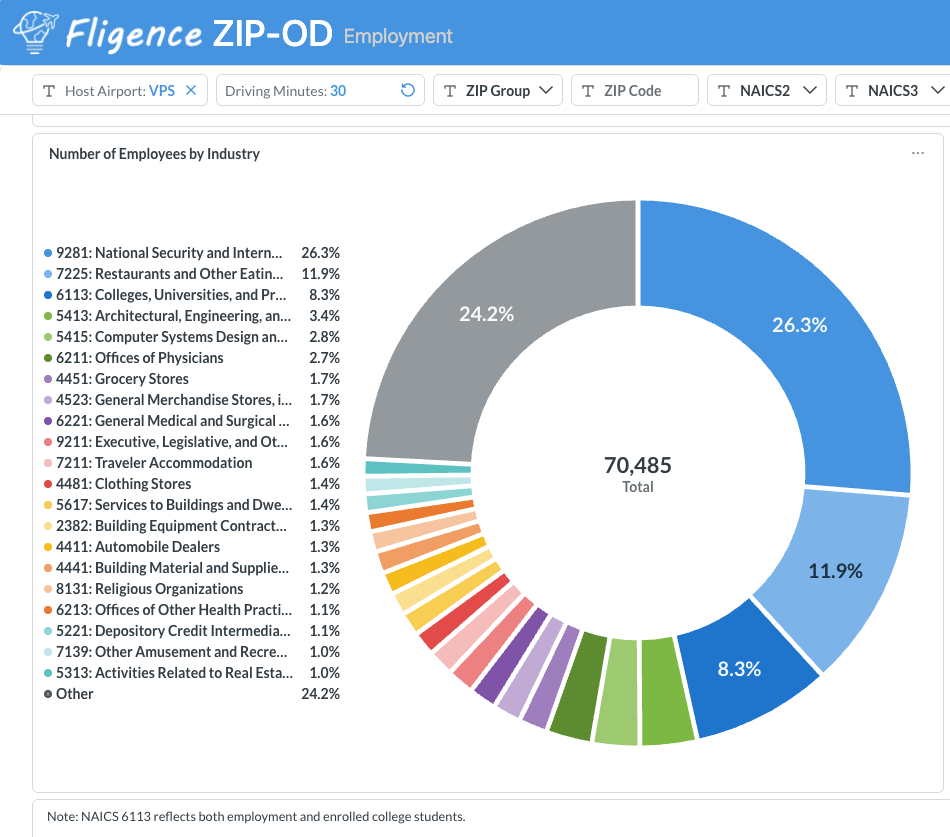
Destin-Fort Walton Beach Airport (VPS) provides a particularly useful example. At first glance, the size of the surrounding population and the area’s reputation as a leisure destination may not reveal the full extent of its business and government-related air travel demand. However, the region is home to major military installations, including Eglin Air Force Base and Hurlburt Field, as well as a substantial network of defense contractors and federal employees.
Employment data can help airports identify these concentrations of military, government, and defense-related activity and provide context for travel demand between the region and major government and military centers such as Washington, D.C., San Antonio, Norfolk, and San Diego. Historical O&D data may show strong traffic in these markets, but employment characteristics can help explain why these travel patterns exist.
For airports with substantial military or government activity, understanding the economic structure of the catchment area can therefore reveal important market relationships that population and household data alone may not fully explain.
High-Income Suburban Market Examples
Suppose an airport identifies a cluster of suburban ZIP codes where:
- Median household income is above the regional average
- A large share of households earn more than $150,000 annually
- Premium passenger demand is high
- Yet the airport captures a relatively small share of travelers
These ZIP codes may represent an important opportunity for both Air Service Development (ASD) and Marketing. Marketing teams can target these high-value travelers by emphasizing convenience, time savings, nonstop service, and premium travel benefits. At the same time, ASD teams can analyze where these passengers are traveling and determine whether gaps in the airport’s existing airline service are contributing to leakage to competing airports.
Rhode Island T. F. Green International Airport (PVD) provides a good example. Affluent communities in Rhode Island and southeastern Massachusetts have access to both PVD and Boston Logan International Airport (BOS). ZIP-level analysis may identify high-income communities with substantial premium passenger demand but relatively low PVD market share, as some travelers drive to BOS for its broader nonstop network, international connectivity, and premium service options. These communities could therefore become priority markets for both targeted marketing and future air service development.
Similar opportunities may exist at San José Mineta International Airport (SJC), where affluent Silicon Valley communities can leak to SFO; San Francisco Bay Oakland International Airport (OAK), where East Bay travelers may choose SFO; John Wayne Airport (SNA), where affluent Orange County travelers may use LAX for broader long-haul and international service; and Manchester-Boston Regional Airport (MHT), where travelers from higher-income communities in southern New Hampshire may drive to BOS.
Combining household income, premium passenger demand, airport market share, and destination-level O&D data can help airports distinguish high-value growth opportunities from areas that simply have large populations.
Demographics Should Explain Passenger Behavior, Not Replace It
Demographic data is valuable, but airports should avoid assuming that demographics alone determine travel demand. A wealthy ZIP code does not automatically generate the most passengers. A large university does not automatically support a specific route. A major employer does not guarantee airline demand.
The strongest approach starts with actual passenger behavior and uses demographic and economic data to explain and segment that behavior. In other words: Passenger data tells you what travelers are doing. Demographic and economic data helps explain who those travelers are and why demand may be concentrated in certain markets.
Track How the Economic Market Changes
Demographic and economic conditions are not static. Over time, an airport’s market can change because of:
- Population growth
- Income growth
- New corporate facilities
- University expansion
- Hospital expansion
- Government relocation
- Military changes
These developments can change both the volume and composition of air travel demand. Tracking them can help airport teams identify emerging passenger markets before they become obvious in airport traffic totals.
How Air Service Development Teams Can Use Demographic and Economic Data
For Air Service Development teams, this information can help:
- Explain the economic drivers behind passenger demand
- Strengthen airline business cases
- Identify industry-specific travel relationships
- Support premium and business-route analysis
- Understand university and student travel
- Identify government and military demand
- Explain differences in travel propensity across the catchment
- Provide context for future demand growth
This can make airline presentations more specific and more relevant than relying only on population totals.
How Airport Marketing Teams Can Use Demographic and Economic Data
Marketing teams can use the same information to refine passenger audiences. For example:
- High-income ZIP codes may support premium and convenience-focused messaging.
- University communities may respond to seasonal route campaigns.
- Government and military markets may have destination-specific travel needs.
- Hospital and healthcare employment centers may support professional and business-travel campaigns.
- Rapidly growing residential markets may deserve increased awareness investment.
The key is to layer these characteristics onto actual passenger demand rather than targeting demographics in isolation.
How Fligence ZIP-OD Shows the Airport’s Demographic and Economic Market
FlightBI’s Fligence ZIP-OD provides several geographic views that help airport teams understand the people and economic activity behind passenger demand.
These include heat maps of:
- Population by ZIP code
- Median household income by ZIP code
- Households by income bucket
- Employee counts by industry
The employment analysis can also identify concentrations of important passenger-generating groups such as:
- University students
- Hospital employees
- Government employees
- Military personnel
Because these datasets are displayed geographically, airport teams can compare them directly with passenger origins, airport market share, route demand, and other aviation metrics.
Build a Passenger Market Profile
A useful airport market profile can bring several dimensions together.
For each important ZIP code or geographic cluster, an airport can examine:
- Population
- Passenger demand
- Passengers per capita
- Median household income
- Household income distribution
- Major employment industries
- University population
- Healthcare employment
- Government employment
- Military presence
- Airport market share
- Top destinations
This creates a much richer description of the airport market than a single catchment population number.
The Bottom Line
What are the demographic and economic characteristics of an airport’s market?
The answer goes far beyond total population.
A useful market profile examines:
- where people live
- how income is distributed
- where major employment is concentrated
- which industries drive the local economy
- where students, healthcare workers, government employees, and military personnel are located
and then connects those characteristics with actual passenger demand.
With Fligence ZIP-OD, airport Air Service Development and Marketing teams can use ZIP-level heat maps of population, median income, household income distribution, and employment by industry to better understand the communities and economic sectors generating air travel.
The strategic question is not simply:
“How many people live in our catchment?”
It is:
“Who lives and works in our market—and how do those characteristics help explain the air travel demand we see?”