
Passengers do not always choose the airport closest to home. Airfare and nonstop service are two of the most important factors that can influence airport choice, especially when travelers have several airports within a reasonable driving distance.
A traveler may drive farther to another airport to save significantly on airfare or to avoid a connection. Conversely, when nearby airports offer similar fares and comparable nonstop service, convenience and drive time may become more important.
For airport Air Service Development teams, understanding the relationship between fare, nonstop availability, and passenger demand can help explain why travelers choose one airport over another and identify opportunities to strengthen the airport’s market position.
How Does Airfare Affect Airport Choice?
Airfare can strongly influence which airport a passenger chooses, particularly for leisure and price-sensitive travelers.
Consider a traveler who lives 30 minutes from Airport A and 75 minutes from Airport B.
If a round-trip ticket costs:
Airport A: $500
Airport B: $300
the traveler may decide that an additional 45-minute drive is worthwhile to save $200.
The decision may become even more compelling for a family of four. A $200 difference per ticket could represent $800 in total airfare savings.
On the other hand, if the fares are:
Airport A: $350
Airport B: $325
the relatively small savings may not justify the additional drive.
This is why airport choice should not be analyzed using geographic proximity alone.
The Importance of Comparing Fares by Destination
An airport’s average fare across all passengers does not necessarily explain its competitive position.
Fare differences should be examined by destination.
An airport might be highly competitive for Orlando but considerably more expensive for Los Angeles. Passengers traveling to those two destinations could therefore make very different airport choices.
For Air Service Development teams, useful questions include:
- What is our average fare to each major destination?
- How does that compare with fares available from competing airports?
- For which destinations do we have a fare advantage?
- Where are our fares significantly higher?
This destination-level analysis provides much more actionable information than a single airport-wide average fare.
Compare Against the Competitive Fare Travelers Actually Face
When several competing airports serve the same region, comparing the target airport with only one competitor may also provide an incomplete picture.
Suppose an airport competes with three surrounding airports for passengers traveling to a particular destination. A weighted average competitive fare can provide better perspective by reflecting the fares available from competing airports and the relative passenger demand associated with those alternatives.
This gives airport teams a more representative benchmark for evaluating whether their fares are competitive in a particular destination market.
How Does Nonstop Service Affect Airport Choice?
Nonstop service can be just as important as airfare—and in some cases more important.
A nonstop flight eliminates the time and inconvenience associated with making a connection. It can reduce total travel time, lower the risk of missed connections, and make the overall trip more convenient.
Consider a traveler with two choices:
Airport A: 40-minute drive + one-stop itinerary
Airport B: 80-minute drive + nonstop flight
Even though Airport B is farther away, the traveler may prefer it because the nonstop flight saves time and simplifies the journey.
This is why the geographic reach of an airport can expand when it offers nonstop service that is unavailable at nearby airports.
Unique Nonstop Service Can Draw Passengers from Farther Away
The effect becomes particularly strong when an airport offers a nonstop destination that travelers cannot easily access elsewhere.
Consider an airport offering nonstop service to both New York City and Grand Cayman.
New York is served by multiple airports, including JFK, LGA, and EWR, while GCM is the only airport serving Grand Cayman. Passengers traveling to Grand Cayman may drive several hours to this airport if it offers their only nonstop option. The same traveler may choose an airport closer to home for a New York trip if that airport also offers nonstop service to the New York area.
This means an airport does not necessarily have one fixed geographic market for every destination.
Each route can have a different passenger distribution depending on the availability and attractiveness of competing service.
Fare and Nonstop Service Work Together
Airfare and nonstop service should not be evaluated independently.
Passengers are effectively comparing the total value of each travel option.
Imagine three choices for the same destination:
| Airport | Drive Time | Average Fare | Service |
|---|---|---|---|
| Airport A | 30 min | $425 | Connecting |
| Airport B | 60 min | $450 | Nonstop |
| Airport C | 90 min | $325 | Nonstop |
There is no obvious choice for every passenger.
A business traveler may prefer Airport B because it provides nonstop service without requiring a very long drive.
A price-sensitive leisure traveler may choose Airport C to save $125.
Another traveler may use Airport A because minimizing ground travel is more important.
Airport choice therefore reflects a tradeoff among drive time, airfare, nonstop availability, schedule, frequency, and individual passenger preferences.
Passenger Demand Provides Another Important Signal
Fare comparison becomes even more useful when it is analyzed alongside passenger demand.
One commonly used measure is PDEW—Passengers Daily Each Way. PDEW represents the average number of passengers traveling in each direction per day within an origin-and-destination market.
Suppose an airport examines a major destination and finds:
Target airport: 18 PDEW
Competing airports: 72 PDEW
The difference indicates that substantially more passengers in the broader market are accessing that destination through competing airports.
Now combine that information with fare:
If the target airport has a significantly higher average fare, price may be one factor influencing the difference.
If the target airport has a competitive fare but lacks nonstop service, the service pattern may help explain passenger behavior.
If the target airport offers both competitive fares and nonstop service, other factors such as schedule, frequency, airline preference, or geographic passenger distribution may need to be examined.
Fare explains part of the story. PDEW shows the passenger-demand outcome.
Analyze Fare and Demand with the Fligence Fare Comparison Dashboard
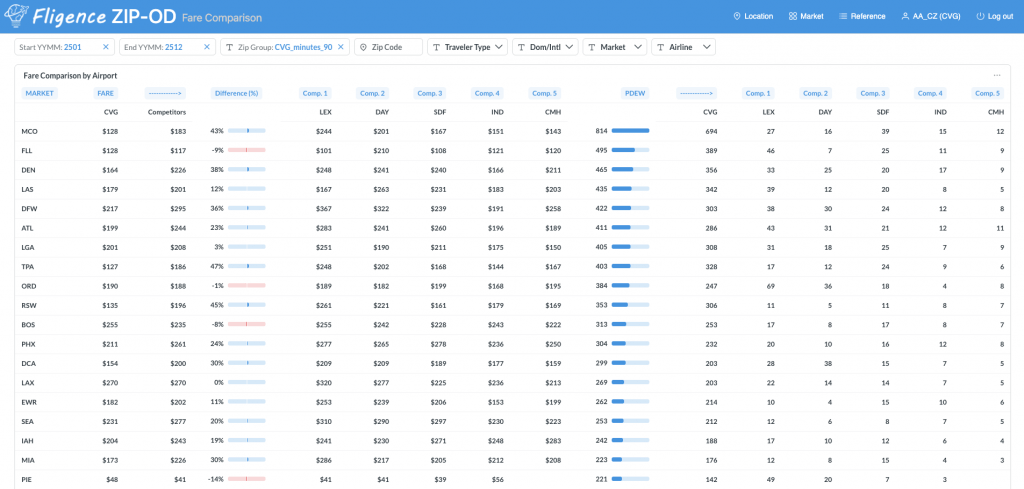
FlightBI’s Fligence Fare Comparison Dashboard helps airport teams analyze these relationships across major destination markets.
For each major destination, the dashboard compares:
The target airport’s average fare with the weighted average fare from competing airports
This allows Air Service Development teams to quickly identify destinations where their airport has a fare advantage or disadvantage relative to the competitive alternatives available to travelers.
The dashboard also compares:
PDEW from the target airport with PDEW from competing airports
Putting fare and passenger demand together provides useful context for understanding individual markets.
For example, an airport can identify destinations where:
- Its fare is higher and competitor PDEW is substantially greater
- Its fare is competitive but passenger volume remains relatively low
- Its fare is lower and it captures substantial passenger demand
- A large destination market exists across competing airports
- Fare differences may be influencing passenger behavior
Rather than reviewing fare data and passenger demand separately, airport teams can see both sides of the market in one analysis.
Use Fare Comparison to Identify Markets Worth Investigating
The purpose of fare comparison is not simply to determine whether an airport is “cheap” or “expensive.”
The more important objective is to identify destination markets that deserve additional investigation.
For example, consider a market where:
Target airport average fare: $420
Competitive weighted average fare: $335
and:
Target airport: 12 PDEW
Competitors: 65 PDEW
This combination could indicate an important market for the Air Service Development team to examine more closely.
The team might investigate:
- Whether competitors offer nonstop service
- Whether the target airport requires a connection
- Differences in flight frequency
- Airline schedules
- Geographic distribution of passenger demand
- Whether additional or improved service could make the airport more competitive
The dashboard helps identify the question. Additional market analysis helps explain the answer.
Competitive Fare Does Not Automatically Mean High Market Share
It is important not to assume that lower fares automatically produce more passengers.
Airport choice is multidimensional.
An airport could offer a competitive fare but still attract fewer passengers because another airport provides:
- Nonstop service
- More daily frequencies
- Better departure times
- A preferred airline
- Better connectivity
- Greater schedule reliability
- Easier access for a particular geographic market
Likewise, passengers may sometimes pay a higher fare to use a nearby airport or obtain a more convenient nonstop flight.
Fare comparison is therefore most valuable when combined with service characteristics and passenger demand.
How Air Service Development Teams Can Use Fare Comparison
Fare and PDEW comparison can help Air Service Development teams:
- Understand fare competitiveness by destination
- Identify markets with significant passenger demand
- Compare the airport’s PDEW with competing airports
- Identify destinations where high fares may be affecting airport choice
- Evaluate markets where competitors capture substantial demand
- Support discussions with existing airlines
- Identify opportunities for new or expanded service
- Strengthen airline business cases with competitive market evidence
Instead of simply telling an airline that a destination has substantial demand, an airport can show how that demand is distributed and how the airport’s fare compares with alternatives available in the broader market.
The Bottom Line
Airfare and nonstop service can have a major influence on airport choice.
Passengers may drive farther to save money or access a nonstop flight, while they may prefer a closer airport when fares and service are similar. The effect can vary substantially by destination, meaning airport choice should be analyzed at the individual market level rather than only at the airport level.
FlightBI’s Fligence Fare Comparison Dashboard helps airports evaluate this relationship by comparing the target airport’s average fare with the weighted average fare of competing airports for major destinations and showing PDEW from the target airport versus competing airports.