
Digital advertising allows airports to target specific geographic areas, but passenger markets rarely follow a simple radius around an airport. Two communities the same distance away can generate very different levels of air travel and have very different airport preferences.
A better approach is to use actual passenger behavior to decide where advertising should run.
For airport Marketing teams, the key question is:
“Where are the passengers this campaign is designed to reach?”
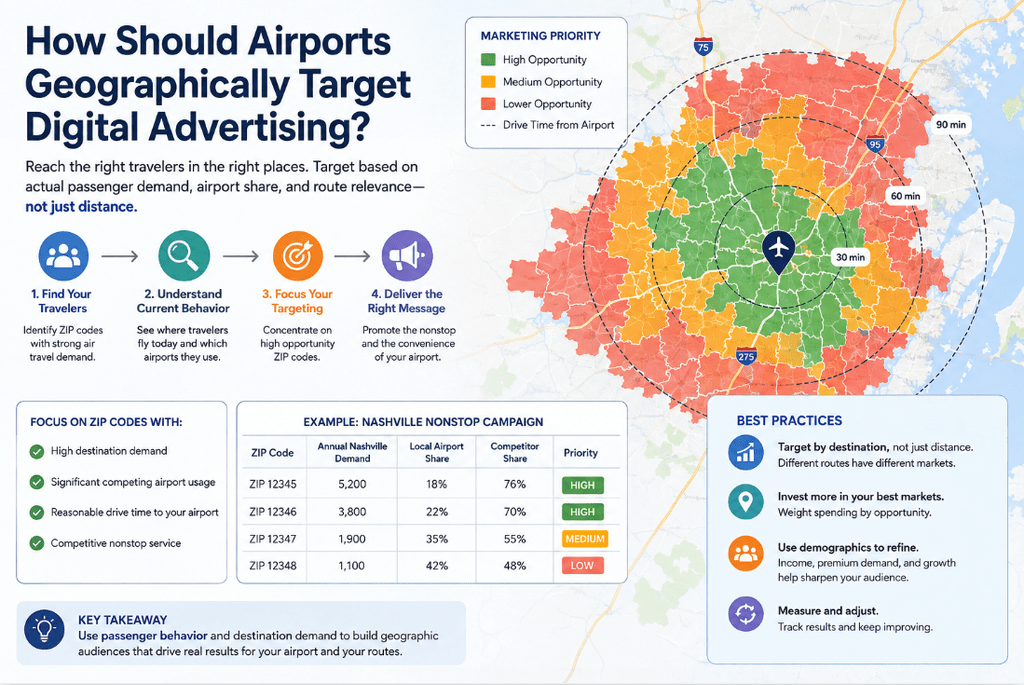
Start with Where Air Travelers Actually Live
A traditional campaign might target everyone within 25, 50, or 75 miles of the airport. Drive-time areas provide a better geographic boundary because they account for the road network and actual airport accessibility.
Passenger data adds another important layer. It shows which communities within that geography actually generate air travel.
Consider these ZIP codes:
| ZIP Code | Annual Air Passenger Demand |
|---|---|
| ZIP A | 55,000 |
| ZIP B | 42,000 |
| ZIP C | 28,000 |
| ZIP D | 12,000 |
| ZIP E | 5,000 |
If the advertising budget is limited, spending equally across all five ZIP codes would make little sense. ZIP A generates more than ten times the air travel demand of ZIP E.
Population can also give an incomplete picture. A ZIP code with 60,000 residents might generate 20,000 annual passenger trips, while another with only 35,000 residents generates 30,000 trips. The smaller community has fewer residents, yet its residents travel much more frequently.
Passenger demand therefore provides a strong starting point for deciding where airport advertising dollars should go.
Match the Geography to the Campaign
Different campaigns require different geographic audiences.
An airport-wide brand campaign may focus on communities that generate substantial overall passenger demand. A new-route campaign should focus more specifically on passengers traveling to that destination. A premium-service campaign may emphasize areas with high premium demand or concentrations of business travelers.
Inbound visitor campaigns require a different geographic approach. The target audience may live hundreds or thousands of miles from the airport.
The purpose of the campaign should determine the geography.
Route Marketing Should Be Destination-Specific
Suppose an airport launches a new nonstop to Houston. Advertising the new flight to everyone within a 60-minute drive will create awareness, but Houston demand may be concentrated in only part of that area.
For example:
| ZIP Code | Total Air Demand | Houston Demand |
|---|---|---|
| ZIP A | 45,000 | 5,500 |
| ZIP B | 50,000 | 1,200 |
| ZIP C | 30,000 | 4,200 |
| ZIP D | 20,000 | 3,000 |
ZIP B is the largest overall air travel market, yet it generates relatively little Houston traffic. ZIP A, ZIP C, and ZIP D are more relevant to a Houston campaign.
Travelers in those communities have already demonstrated demand for Houston. The campaign can focus on getting more of them to use the new local nonstop.
This means an airport’s geographic advertising footprint can change substantially from one route to another.
Find Passengers Who Currently Use Other Airports
Destination demand becomes even more useful when combined with airport choice.
Suppose a ZIP code generates 4,000 annual Houston passenger trips:
- 900 use the local airport
- 3,100 use competing airports
Once the local airport offers a competitive Houston nonstop, those 3,100 trips become particularly interesting.
The airport has identified a community where travelers already have demonstrated demand for Houston and where a large share currently begins the trip somewhere else.
The next step is to determine how many of those passengers are realistically addressable.
Consider Drive Time and Competing Airports
A large pool of leakage can look attractive until geography is considered.
Suppose a community generates substantial Houston traffic but is 100 minutes from the local airport and only 25 minutes from a competing airport. Even with a new nonstop, that community may be difficult to win.
A stronger geographic target might combine:
- High destination demand
- Significant competing-airport usage
- Reasonable drive time to the local airport
- A competitive local nonstop
- Meaningful room to increase airport share
Drive time can therefore help narrow a large pool of uncaptured passengers into a more realistic advertising audience.
Give the Best Markets More Weight
Geographic targeting does not require a simple decision to include or exclude each ZIP code. Airports can divide the market into priority tiers.
| Priority | Typical Characteristics | Advertising Approach |
|---|---|---|
| Tier 1 | High destination demand, significant leakage, strong local service advantage | Highest investment |
| Tier 2 | Meaningful demand and reasonable opportunity | Moderate investment |
| Tier 3 | Lower demand or weaker addressability | Limited or test spending |
This approach allows the media budget to reflect the size and quality of the passenger opportunity.
It also provides flexibility. Narrowing a campaign to only a few ZIP codes can reduce reach or make digital media more expensive. Tiering allows the airport to concentrate spending in the strongest areas while maintaining broader coverage where appropriate.
Different Routes Need Different Maps
The geographic market for Houston may look very different from the market for Orlando, New York, or an international destination.
Orlando demand may be concentrated in family-oriented suburban communities. New York may draw heavily from business centers. An international route may have strong demand from particular corporate or demographic markets.
These patterns can reflect:
- Business relationships
- Tourism
- Family connections
- Universities
- Corporate activity
- Seasonal residents
- Second-home ownership
Airport Marketing teams can therefore build route-specific geographic audiences for important services.
For an established route, the analysis can identify ZIP codes with strong destination demand and relatively low local airport share. For a new route, existing destination demand and competing-airport usage can provide the starting point before the first flight operates.
Use Demographics to Refine the Audience
Passenger demand identifies where the travel market exists. Demographic and economic data can help explain the market and shape the campaign.
Depending on the route, useful information may include:
- Household income
- Household composition
- Employment and industry
- Premium passenger demand
- Population growth
- Migration
For example, two ZIP codes may each generate 30,000 annual passenger trips. One also has substantial premium passenger demand and a large concentration of corporate employment. That market may deserve greater weight for a business-oriented route.
For a leisure route, household characteristics or second-home ownership may provide more useful context.
This approach keeps the analysis grounded in actual travel demand while using demographics to make the targeting more precise.
Include Emerging Markets
Historical passenger data shows where travelers have been coming from, but airport markets change.
A rapidly growing suburban area may still rank below established communities in passenger volume. New housing, migration, population growth, and major employers can quickly change its importance.
Marketing teams can supplement current passenger demand with:
- Population growth
- In-migration
- New residential development
- Employment growth
- Changes in household income
These areas may be worth testing before historical passenger volume fully reflects their potential.
Turn the Analysis into a Campaign Map
The final analysis should be simple enough for an airport Marketing team, airline partner, or advertising agency to use directly.
For a Houston campaign, for example, the airport could create a map showing:
- Tier 1 ZIP codes: Highest priority
- Tier 2 ZIP codes: Secondary priority
- Tier 3 ZIP codes: Testing or awareness
The tiers could be based on Houston passenger demand, competing-airport usage, local airport share, drive time, and the strength of the new Houston service.
The resulting map gives the media team a clear geographic plan rather than a collection of passenger statistics.
How Fligence Supports Geographic Digital Advertising
FlightBI’s Fligence ZIP-OD allows airport Marketing teams to build geographic audiences using passenger behavior at the ZIP-code level.
Teams can analyze:
- Total passenger demand
- Destination-specific demand
- Resident passenger locations
- Airport market share
- Competing-airport usage
- Drive time
- Household income
- Premium passenger demand
- Migration and market growth
For a route-specific campaign, an airport can identify where passengers traveling to that destination live, determine which communities send the most traffic to competing airports, and use drive time and local air service to assess how realistic the opportunity is.
The results can then be translated into ZIP-code target lists and campaign priority maps for digital advertising.
A Practical Targeting Process
A geographic targeting analysis can follow six steps:
- Define the campaign. Determine whether the campaign supports airport awareness, an existing route, a new route, or a particular passenger segment.
- Find the relevant passengers. Measure total or destination-specific passenger demand by ZIP code.
- Measure the opportunity. Identify communities where many of those passengers currently use competing airports.
- Check accessibility and service. Consider drive time and the strength of the local flight option.
- Rank the markets. Create priority tiers based on the size and quality of the opportunity.
- Build the campaign map. Provide the resulting ZIP-code audiences to the Marketing team, airline partner, or advertising agency.
This creates a direct path from passenger analysis to media buying.
The Bottom Line
Geographic digital advertising works best when the target area reflects where relevant passengers actually live and how they currently travel.
For a route campaign, strong targets often combine high destination demand, significant competing-airport usage, reasonable access to the local airport, and a competitive service to promote.
ZIP-level passenger analysis allows airports to concentrate more of their advertising budget in these areas while reducing spending in markets with limited passenger opportunity.
The central question is simple:
“Where are the passengers this campaign is designed to reach?”