
Some of the best growth opportunities for an airport are not necessarily the ZIP codes that already generate the most airport passengers. They may be communities where many people travel by air, but a relatively small share use the local airport.
These markets are important because the demand already exists. The airport does not need to convince people to travel. The opportunity is to understand why they use competing airports and determine whether some of those trips can be captured locally.
Start with the Gap Between Total Demand and Airport Usage
Consider four ZIP codes:
| ZIP Code | Total Air Demand | Local Airport Passengers | Airport Share | Uncaptured Demand |
|---|---|---|---|---|
| ZIP A | 50,000 | 40,000 | 80% | 10,000 |
| ZIP B | 45,000 | 18,000 | 40% | 27,000 |
| ZIP C | 30,000 | 12,000 | 40% | 18,000 |
| ZIP D | 15,000 | 3,000 | 20% | 12,000 |
ZIP A sends the most passengers to the local airport, but the airport already captures 80% of the market.
ZIP B is more interesting from a growth perspective. It generates almost as much total air travel, but 27,000 trips are currently going through other airports.
A simple way to measure this is:
Market Opportunity Gap = Total Air Travel Demand − Passengers Using the Local Airport
This does not mean every uncaptured passenger can be won. It simply identifies where there is enough traffic to warrant a closer look.
Do Not Rank ZIP Codes by Market Share Alone
A very low airport share can attract attention, but the percentage needs to be considered together with the size of the market.
Suppose:
- ZIP A: 10,000 total trips and 20% local airport share
- ZIP B: 60,000 total trips and 50% local airport share
ZIP A has a much lower share, but only 8,000 trips are uncaptured. ZIP B has a higher share, yet 30,000 trips use other airports.
From a passenger-growth perspective, ZIP B may be much more important.
A useful way to organize the market is:
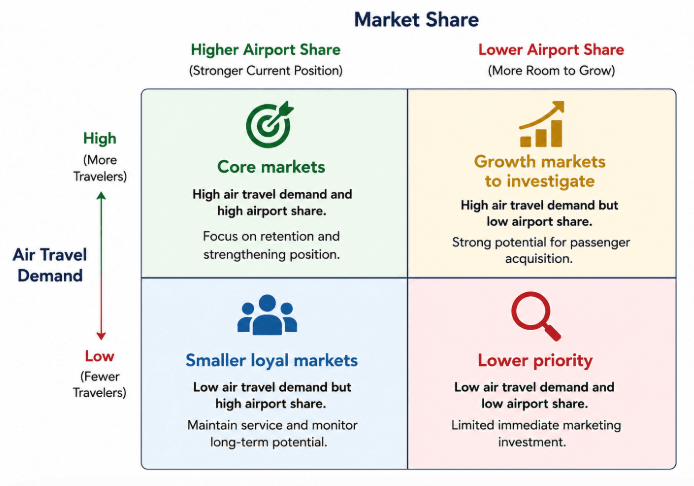
The high-demand, low-share group is a good place to start, but it is only the first screen.
Is the Low Share Actually Addressable?
Two ZIP codes can have the same passenger demand and airport share but represent completely different opportunities.
Suppose both generate 40,000 annual trips and the local airport captures 35%.
One is 30 minutes from the airport. The other is 100 minutes away and much closer to a competing airport.
The first deserves attention. If most residents are bypassing a conveniently located airport, there may be a specific reason that can be addressed through better air service, pricing, or marketing.
The second may simply fall within another airport’s natural catchment.
This is why high demand + low share is an opportunity signal, not automatically an opportunity.
Look Closely at Nearby ZIP Codes with Unexpectedly Low Share
Some of the most useful findings are communities close to the airport where local market share is surprisingly low.
Suppose a ZIP code:
- Is 25 minutes from the airport
- Generates 35,000 annual passenger trips
- Has only a 35% local airport share
The airport has a clear ground-access advantage, yet nearly two-thirds of passengers still go elsewhere.
That is worth investigating. The airport can examine:
- Where those passengers are traveling
- Which competing airports they use
- Whether the local airport offers nonstop service
- Fare differences
- Schedule and frequency differences
- Airline preferences
- Passenger demographics
The answer determines whether this is primarily an Air Service Development problem or a Marketing opportunity.
Look at the Destination Mix
Overall airport share can hide what is actually happening.
Suppose a ZIP code generates 50,000 annual trips but has only a 35% local airport share. Its major destinations include:
| Destination | Annual Demand |
|---|---|
| Orlando | 5,000 |
| New York | 4,200 |
| Nashville | 3,500 |
| Los Angeles | 3,000 |
| Dallas | 2,800 |
If the local airport already offers good nonstop service to Orlando and Nashville, the leakage in those markets may be addressable through marketing.
Los Angeles may be different. If the airport has no Los Angeles service, passengers have a legitimate reason to use another airport. That traffic may be more relevant to the ASD team as evidence of potential demand for new service.
A useful rule is:
- Relevant service already exists: investigate as a Marketing opportunity.
- Relevant service does not exist: investigate as an Air Service Development opportunity.
This distinction prevents airports from spending marketing dollars trying to solve an air service problem.
Airport-Wide Share Can Also Hide Route-Specific Performance
Suppose a ZIP code has only 35% overall local airport share, but the results vary substantially by destination:
- Orlando: 75%
- Nashville: 60%
- Los Angeles: 15%
The airport is already performing well for Orlando. A general campaign aimed at increasing airport awareness may therefore miss the real issue.
Los Angeles is contributing much more heavily to the overall share gap.
Breaking market share down by destination helps airport teams understand which passenger behavior actually needs to change.
Look for Geographic Clusters
An individual ZIP code may not contain enough passengers to justify a major campaign. Several neighboring ZIP codes can tell a different story.
Suppose six adjacent ZIP codes each generate 25,000 to 40,000 annual trips, while the local airport captures only 30% to 45%.
Together, they could represent hundreds of thousands of passenger trips.
The cluster might correspond to:
- A fast-growing suburban corridor
- A major employment center
- An affluent residential area
- A highway corridor with easy access to several airports
- A newly developed part of the metropolitan area
Thinking in terms of geographic clusters can make the opportunity easier to understand and more practical for marketing.
Compare Similar ZIP Codes
Another useful approach is to compare neighboring communities with similar characteristics.
Suppose three suburban ZIP codes have similar drive times, populations, household incomes, and passenger demand, but their local airport shares are:
- ZIP A: 72%
- ZIP B: 68%
- ZIP C: 38%
ZIP C stands out.
Instead of accepting its low share as normal, the airport can investigate what is different. Perhaps residents have stronger demand for destinations not served locally. Maybe another airport has a much better schedule. Or perhaps the local airport simply has weaker awareness in that community.
This type of comparison can reveal opportunities that would not stand out in a simple market-share ranking.
Add Travel Propensity and Passenger Characteristics
Passenger volume and market share should remain the starting point, but other information can help explain why a ZIP code matters.
For example, a relatively small ZIP code may generate unusually high passenger demand per household. That could reflect high household income, business activity, frequent leisure travel, or other characteristics.
Airport teams can also look at:
- Household income
- Premium passenger demand
- Employment characteristics
- Population growth
- Migration
- Second-home activity
These factors should provide context rather than replace actual passenger demand.
A ZIP code with high income but little air travel is not automatically an attractive market. A ZIP code with high air travel demand, low airport share, and a large concentration of premium passengers, however, may deserve much closer attention.
Growing Communities Can Be Especially Important
Historical passenger patterns can lag behind population growth.
A suburban ZIP code that has added thousands of new residents may still have a relatively low local airport share. Many of those residents may have moved from another metropolitan area and may not yet have established strong airport habits.
This can create an interesting marketing opportunity. Instead of trying to change a preference that has existed for decades, the airport may be reaching travelers while their regional airport preferences are still developing.
Migration and population growth can therefore help distinguish an emerging market from a historically weak market.
Absolute Opportunity vs. Relative Opportunity
It can be useful to maintain two separate views.
Absolute opportunity looks at the number of passenger trips not captured by the airport. This identifies the largest potential passenger pools.
Relative opportunity compares airport share with similar nearby communities. This identifies areas where the airport appears to be underperforming.
For example, a 45% share may not look particularly low on its own. But if similar neighboring ZIP codes average 70%, the difference becomes much more interesting.
Using both measures prevents the airport from focusing only on the biggest markets or only on the lowest-share markets.
Turn the Analysis into a Marketing Audience
Once a high-demand, low-share area has been identified, the analysis should become specific enough to use in a campaign.
For example:
| Target Market | |
|---|---|
| Target geography | 6 adjacent ZIP codes |
| Annual air travel demand | 210,000 trips |
| Local airport share | 38% |
| Uncaptured demand | ~130,000 trips |
| Strong local nonstop markets | Orlando, Nashville, Dallas |
This is much more actionable than saying, “We should advertise more in the northern part of the catchment.”
The audience can now be defined as air travelers in these communities who have relevant local nonstop options but frequently use competing airports.
How Fligence ZIP-OD Helps
FlightBI’s Fligence ZIP-OD allows airport teams to compare total air travel demand with airport usage at the ZIP-code level.
Teams can first identify communities with substantial demand and relatively low local airport share, then investigate them using information such as:
- Destination-level demand
- Passenger leakage
- Competing airport usage
- Drive time
- Household income
- Premium passenger estimates
- Migration and population growth
This moves the analysis beyond a map showing where current airport passengers live. It shows where meaningful passenger demand exists that the airport is not fully capturing.
A Practical Process
A straightforward analysis can follow seven steps:
- Rank ZIP codes by total air travel demand. Start with markets large enough to matter.
- Compare local airport share. Identify areas where the airport captures a relatively small portion of demand.
- Calculate uncaptured demand. Measure the actual number of trips going elsewhere.
- Check geography. Determine whether the local airport is a realistic choice.
- Examine destinations. Find out whether the airport provides relevant service.
- Look for clusters and unusual patterns. Compare neighboring and similar ZIP codes.
- Determine the action. Decide whether the gap points to marketing, air service, or an underlying geographic disadvantage.
The Bottom Line
The best opportunities are not necessarily the ZIP codes with the most current airport passengers or the lowest airport market share.
A more useful place to look is where large amounts of air travel already occur, but the local airport captures only part of that demand.
The next step is to determine why.
If the airport has convenient access and competitive service, the market may offer a realistic opportunity to win more passengers. If travelers are leaving because the airport does not serve the destinations they need, the same data may point to an air service opportunity instead.
The important question is not “Which ZIP codes use our airport the least?”
It is “Where are there enough uncaptured passengers that we have a realistic chance to win?”