
Forecasting demand for a proposed airline route requires more than looking at how many passengers travel between two cities today. A new nonstop changes the choices available to passengers. Travelers who currently connect may switch to the nonstop, passengers using competing airports may return to the local airport, and improved service may stimulate additional travel.
At the same time, some passengers attracted to the new flight may come from the airline’s existing services. A useful route forecast therefore needs to answer a broader question: If this flight were added to the schedule, how would passengers respond to the new set of travel options?
For airport Air Service Development teams, this means starting with historical O&D demand and then modeling the future competitive environment created by the proposed flight.
Start with the Existing Passenger Market
Before forecasting a proposed route, the airport needs a reliable estimate of existing demand.
Suppose an airport is considering nonstop service to Destination X. Current demand is:
- Local airport passengers: 25 PDEW
- Passengers using competing airports: 50 PDEW
- Total market: 75 PDEW
The 75 PDEW represents the existing market before the proposed nonstop is introduced. However, the forecast should not assume that all 75 passengers will use the new flight.
Some passengers will continue using competing airports or existing connecting itineraries. Others may switch to the new nonstop. Improved service may also generate passengers who are not part of today’s 75 PDEW.
The forecast therefore needs to estimate both how existing passengers will redistribute and how the total market could grow.
Define the Proposed Flight
The next step is to specify exactly what service is being evaluated. Important inputs include:
- Origin and destination
- Airline
- Departure and arrival times
- Frequency
- Aircraft type
- Seat capacity
- Days of operation
These details matter because passengers do not simply choose between destinations. They choose among specific itineraries.
For example, one daily 76-seat flight, two daily 76-seat flights, and three weekly 186-seat flights all serve the same route, but they offer very different levels of convenience. Each could produce a different market share, passenger volume, connecting opportunity, load factor, and financial result.
Forecast Passenger Choice, Not Just Market Size
Once the proposed flight is added, passengers have another option.
Suppose travelers currently choose among:
- Itinerary A: Local airport → Hub → Destination
- Itinerary B: Competing airport → Destination nonstop
- Itinerary C: Another competing airport → Hub → Destination
The proposed service adds:
- Itinerary D: Local airport → Destination nonstop
The forecasting problem is now to determine how many passengers will choose Itinerary D instead of the existing alternatives.
That depends on the relative attractiveness of each itinerary, which is where a Quality Service Index (QSI) model becomes useful.
What Is a QSI Model?
A Quality Service Index model estimates the relative attractiveness of competing airline itineraries. Instead of assuming that passengers distribute evenly among available flights, QSI assigns different values based on the quality of each travel option.
Depending on the model, QSI can consider factors such as:
- Nonstop versus connecting service
- Frequency
- Departure time window
- Total travel time
- Connection quality
- Aircraft
- Airline presence
- Circuity
A convenient nonstop will generally receive a higher QSI score than an inconvenient connecting itinerary. The relative QSI scores can then be used to estimate how passengers may distribute themselves among the available options.
Why QSI Matters for New Route Forecasting
Consider a market with 100 PDEW currently distributed as follows:
| Itinerary | Current PDEW |
|---|---|
| Competitor A nonstop | 45 |
| Local airport connecting | 25 |
| Competitor B nonstop | 20 |
| Other itineraries | 10 |
| Total | 100 |
If the local airport adds a nonstop, it would be unrealistic to assume that all 100 passengers will switch to the new flight. The nonstop has to compete with every existing option.
A QSI model evaluates the proposed itinerary relative to those alternatives and estimates how the 100-PDEW market could redistribute after the new flight is introduced.
A New Flight Takes Traffic from Existing Itineraries
Passengers on a proposed flight have to come from somewhere. Some may currently connect through another hub, use a competing airport’s nonstop, fly another airline, or take a different connecting itinerary.
Suppose the new nonstop is expected to attract 65 PDEW from the existing market. That traffic might include:
- 25 PDEW previously using a competing airport nonstop
- 20 PDEW previously connecting through the local airport
- 12 PDEW previously using another competing airport
- 8 PDEW using other itineraries
These 65 PDEW are not new market demand. They are existing passengers who have changed their travel choices because the proposed nonstop is more attractive.
This distinction is particularly important for flights to airline hubs because a new hub flight can affect many existing connecting itineraries across the network.
Consider Cannibalization of Existing Local Service
Traffic can also shift between flights at the same airport.
Suppose an airport already has service to Hub A and an airline is considering adding service to Hub B. Some passengers currently connecting through Hub A may switch to Hub B because the new itinerary offers a better schedule, shorter connection, or more convenient destination options.
The new Hub B flight might carry 80 passengers consisting of:
- 35 passengers captured from competing airports
- 20 stimulated passengers
- 25 passengers shifted from existing local itineraries
The flight carries 80 passengers, but only part of that traffic represents incremental growth for the airport or airline. A network-based forecast needs to account for this interaction rather than evaluating the proposed flight in isolation.
Add Demand Stimulation
A new flight can do more than redistribute existing passengers. If the service significantly improves the travel experience, it can also stimulate new demand.
Suppose the existing market is 100 PDEW and the introduction of a nonstop increases total demand to 120 PDEW. The additional 20 PDEW represent stimulated demand.
New passengers may enter the market because the nonstop:
- Reduces travel time
- Eliminates a connection
- Makes shorter trips practical
- Provides a more convenient schedule
- Reduces the need to drive to another airport
The forecast should therefore account for both redistribution of existing passengers and growth in the total market.
Separate the Sources of Forecast Traffic
Breaking forecast passengers into their sources makes the results easier to understand and defend.
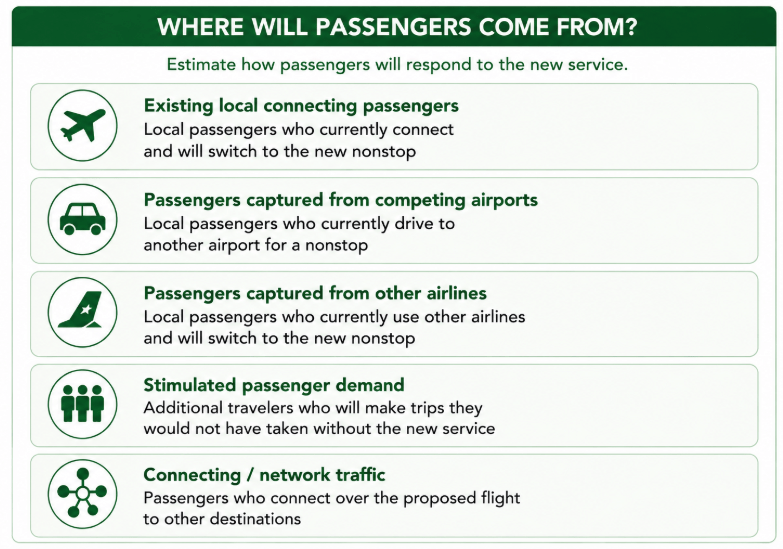
Suppose a proposed flight is forecast to carry 85 PDEW:
| Traffic Source | PDEW |
|---|---|
| Existing local O&D passengers shifted from connecting service | 20 |
| Passengers captured from competing airports | 30 |
| Passengers captured from other airlines | 10 |
| Stimulated passenger demand | 15 |
| Connecting (behind, beyond and bridge) traffic using the flight | 10 |
| Forecast flight traffic | 85 |
This tells an airline much more than simply saying that the route is forecast to carry 85 PDEW. It explains where those passengers are expected to come from.
It also helps distinguish between traffic that is incremental to the airline and traffic that may simply move from another flight or airport.
Rebuild Connecting Itineraries
A proposed hub flight can affect much more than demand to the hub itself.
Consider a new flight from a regional airport to Dallas/Fort Worth. In addition to local DFW traffic, the flight could create one-stop itineraries such as:
- Local Airport → DFW → San Antonio
- Local Airport → DFW → Phoenix
- Local Airport → DFW → Mexico City
These itineraries may not have existed before the new flight, or the previous alternatives may have been much less attractive.
A network forecasting model should therefore rebuild the available connecting itineraries after the schedule changes. This captures the network value of the proposed flight, not just local O&D demand to the hub.
Forecast Local and Connecting Traffic Separately
For a hub route, local O&D passengers may represent only part of the passengers on the aircraft.
Suppose a proposed flight is expected to carry:
- Local O&D passengers: 30
- Connecting passengers: 45
- Total passengers per departure: 75
Looking only at local O&D demand would significantly understate the flight’s potential.
The opposite mistake should also be avoided. An airport should not assume that every hub flight will generate large amounts of connecting traffic. The result depends on the airline’s network, schedule, connection times, destination coverage, and competing itineraries.
Frequency Can Change Passenger Demand
Adding a second daily flight does not simply double the traffic generated by one daily flight. Additional frequency improves the quality of the service itself.
A second flight may provide:
- More departure choices
- Better return options
- Additional hub connections
- Shorter connection times
These improvements increase the QSI of the service and can increase its share of the market.
This is why route forecasts should model the actual proposed schedule rather than simply applying an assumed load factor to the available seats.
Schedule Timing Matters, Especially for Hub Flights
For a hub route, departure and arrival times can have a major effect on traffic.
Suppose two proposed flights use the same airline and aircraft between the same airports. Flight A arrives at the hub at 9:00 AM and connects conveniently to 40 onward destinations, while Flight B arrives at 1:00 PM and connects conveniently to only 18.
The flights may have very different traffic forecasts even though the origin, destination, airline, and aircraft are identical.
The difference comes from how each flight fits into the airline’s connecting banks. A well-timed flight can create dozens of useful itineraries that a poorly timed flight cannot.
Aircraft Choice Changes the Result
Aircraft selection affects both capacity and route economics. Consider a proposed route that could operate with either a 76-seat regional jet or a 150-seat narrowbody.
The larger aircraft provides more capacity, but that capacity has value only if the market can support it. A smaller aircraft may achieve a strong load factor but leave some potential demand unserved. A larger aircraft may capture more passengers but operate with a much lower load factor.
For example, if forecast traffic is 68 passengers per departure:
| Aircraft | Seats | Forecast Passengers | Load Factor |
|---|---|---|---|
| Regional jet | 76 | 68 | 89.5% |
| Narrowbody | 150 | 68 | 45.3% |
The passenger market has not changed. The aircraft assumption has. This is another reason route demand should be forecast within a specific service scenario.
Passenger Demand Alone Does Not Determine Route Success
A route can carry many passengers and still perform poorly financially. Suppose two proposed routes each carry 80 passengers per flight. Route A has strong average fares and a relatively short stage length. Route B has much lower fares and considerably higher operating costs. Their financial performance could be very different despite carrying the same number of passengers.
After forecasting demand, ASD teams should therefore evaluate:
- Average fare
- Passenger revenue
- Operating cost
- Load factor
- Profitability
This moves the analysis from route demand forecasting to route economic forecasting.
Compare Multiple Service Scenarios
Future passenger behavior is uncertain, and there may be several ways to serve the same market. Rather than presenting one forecast as the answer, ASD teams can compare alternative schedules and aircraft.
For example:
| Scenario | Frequency | Aircraft |
|---|---|---|
| A | 1 daily | 76 seats |
| B | 2 daily | 76 seats each |
| C | 1 daily | 150 seats |
| D | 3 weekly | 186 seats |
Each scenario can produce different:
- QSI
- Market share
- Passenger capture
- Demand stimulation
- Connecting traffic
- Load factor
- Revenue
- Profit
The strongest opportunity may therefore depend on finding the right service configuration, not simply identifying the right destination.
Forecast the Incremental Impact
For an airline, it is important to understand what the proposed flight adds to the overall network. Suppose an airline currently carries 10,000 daily passengers across the relevant network. After the proposed flight is added, modeled traffic increases to 10,085 passengers. The incremental network impact is 85 passengers, even though the proposed flight itself may carry considerably more than 85 passengers. The difference occurs because some passengers on the new flight have shifted from the airline’s existing itineraries.
This distinction between flight traffic and incremental network traffic is important. The same principle applies when evaluating incremental revenue and profit.
How Fligence Planning Forecasts a Proposed Route
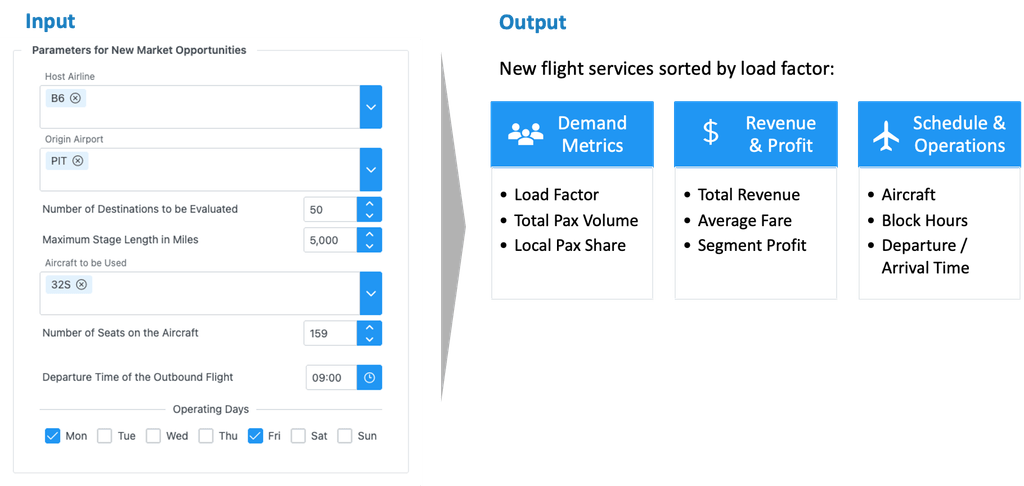
FlightBI’s Fligence Planning allows airport Air Service Development teams to model proposed airline service within the existing network rather than relying only on historical passenger demand.
A proposed flight can be added to the schedule and evaluated using a QSI model that estimates passenger choice among the available itineraries. Importantly, the model accounts for:
- Passenger demand stimulated by improved service
- Traffic captured from competing airports and airlines
- Traffic diverted from existing itineraries
- Changes in connecting opportunities
When the proposed schedule changes, the available connecting itineraries also change. The network is therefore evaluated under the new scenario rather than assuming everything else remains static.
The resulting forecast can estimate changes in:
- Passenger traffic
- Market share
- Connecting traffic
- Load factor
- Revenue
- Profit
This provides a more complete view of how the proposed service could interact with the airline’s existing network.
Why This Is Different from Applying a Capture Rate
A simpler route forecast might start with 100 PDEW, assume a 60% capture rate, and forecast 60 PDEW for the proposed flight.
That can be useful for initial screening, but it does not explain why the route should capture 60% rather than 40% or 75%.
A QSI-based scenario instead evaluates questions such as:
- What itineraries are available to passengers?
- How attractive is the proposed nonstop?
- What existing services does it compete against?
- Which passengers are likely to shift from other itineraries?
- How much additional demand could improved service stimulate?
- What new connecting opportunities does the flight create?
The result is a more dynamic representation of what could happen after the flight enters the market.
From Historical Demand to Future Route Performance
A practical route forecasting process can be organized into ten steps:
- Establish the base market. Estimate existing true O&D demand.
- Build the proposed service. Define the airline, schedule, frequency, aircraft, and capacity.
- Rebuild the network. Identify nonstop and connecting itineraries available after the schedule change.
- Calculate itinerary attractiveness. Use QSI to compare the proposed service with existing alternatives.
- Redistribute existing demand. Estimate traffic captured from competing airports, airlines, and itineraries.
- Estimate demand stimulation. Account for additional travel generated by the improved service.
- Calculate flight traffic. Combine local, captured, stimulated, and connecting passengers.
- Evaluate capacity. Estimate load factor for the proposed aircraft and frequency.
- Estimate economics. Calculate potential revenue, operating cost, and profitability.
- Compare scenarios. Test different schedules, aircraft, frequencies, and service patterns.
This process turns historical passenger data into a forward-looking estimate of how a specific proposed service could perform.
The Bottom Line
Forecasting a proposed route is not simply a matter of taking historical PDEW and applying a growth or capture rate. Adding a flight changes the market itself.
Passengers may switch from competing airports, move away from existing connecting itineraries, use new connections, or begin traveling because the new service makes the trip more attractive. At the same time, some passengers on the proposed flight may be diverted from the airline’s existing services and therefore do not represent incremental network traffic.
A strong route forecast should account for existing O&D demand, passenger redistribution, captured leakage, demand stimulation, connecting traffic, capacity, and network effects within the proposed future schedule.
Fligence Planning uses QSI-based scenario modeling to estimate these changes and evaluate their impact on passenger traffic, market share, load factor, revenue, and profit.
For an ASD team, the question is no longer simply “How many passengers travel to this destination today?” It becomes: “If this specific flight is added to the network, how many passengers would use it, where would they come from, and what would it do to the airline’s traffic and economics?”