
Airport Marketing teams have access to plenty of digital metrics: impressions, clicks, website visits, video views, and booking-link clicks. These metrics help explain how a campaign performed, but airports ultimately need to know whether passenger behavior changed.
Did more people from the targeted communities use the airport? Did market share increase? Did a promoted route gain passengers? Did fewer travelers use competing airports?
Connecting marketing activity with passenger outcomes gives airports a much stronger way to evaluate campaign effectiveness and ROI.
Start with the Business Objective
The measurement should reflect what the campaign was designed to accomplish.
For example, an airport-wide campaign may focus on increasing airport usage or reducing leakage. A new nonstop campaign may focus on route traffic, PDEW, load factor, or destination market share. A premium-passenger campaign may focus on attracting high-value travelers.
Before the campaign begins, define a small number of primary outcomes. This keeps the evaluation focused and prevents a campaign from being judged mainly by whichever digital metric happens to look best afterward.
For a new Orlando route, for example, the primary measures might be:
- Orlando passenger volume
- Orlando PDEW
- Local airport share of Orlando demand
- Orlando passengers from targeted ZIP codes
- Competing-airport usage for Orlando
Clicks and website visits can still be monitored, but they support the analysis rather than define success.
Establish a Baseline Before the Campaign
A campaign is much easier to evaluate when the airport knows what passenger behavior looked like before advertising began.
Suppose an airport plans to promote Orlando service in 15 ZIP codes. Before launch, it could establish this baseline:
| Metric | Before Campaign |
|---|---|
| Orlando demand | 4,000 annualized trips |
| Local airport passengers | 1,000 |
| Competing-airport passengers | 3,000 |
| Local airport share | 25% |
After the campaign, the same measures can be calculated again. This provides a consistent before-and-after view of the market.
Measure the Same Market You Targeted
If a campaign targets 15 ZIP codes, airport-wide passenger statistics may tell very little about whether the campaign worked. Measure results within those same 15 ZIP codes.
The same principle applies to route campaigns. A Orlando campaign should be evaluated primarily against Orlando passenger behavior rather than overall airport traffic. Suppose overall airport share barely changes, while Orlando share in the targeted ZIP codes rises from 30% to 52%. The airport-wide number could hide a very successful route campaign.
For geographically targeted route marketing, the analysis should ideally line up across three dimensions:
Target geography + destination + campaign period
This makes the passenger measurement directly comparable with the campaign itself.
Market Share Often Tells More Than Passenger Growth
Passenger counts can increase simply because the overall market is growing.
Suppose Orlando traffic from a particular market changes as follows:
| Before | After | |
|---|---|---|
| Total Orlando demand | 4,000 | 4,400 |
| Local airport passengers | 1,000 | 1,060 |
| Local airport share | 25% | 24% |
The airport gained 60 passengers, yet its market position weakened because total Orlando demand grew even faster.
Market share helps separate airport growth from market growth. For campaigns designed to reduce leakage or change airport choice, this can be one of the most useful measures.
Compare Before and After, but Consider What Else Changed
A simple before-and-after comparison is a useful starting point.
Suppose local airport share in the target market increases from 35% to 42% after a campaign. The seven-point increase is encouraging, but several other factors could have contributed:
- New or expanded air service
- Fare changes
- Additional frequency or capacity
- Changes at competing airports
- Seasonality
- Economic conditions
- Major local events
These factors should be documented during the campaign period.
Seasonality deserves particular attention. Comparing July with February may say more about normal travel patterns than marketing effectiveness. July this year versus July last year, or target markets versus comparable markets during the same period, usually provides a more useful comparison.
Use Comparison Markets When Possible
A stronger evaluation compares targeted ZIP codes with similar ZIP codes that received little or no advertising.
Suppose the results are:
| Before | After | Change | |
|---|---|---|---|
| Target ZIP codes | 35% | 43% | +8 pts |
| Comparison ZIP codes | 36% | 39% | +3 pts |
Both groups improved, which suggests broader market conditions may have helped the airport. However, the targeted ZIP codes improved by five percentage points more. That additional five points provides a better estimate of the campaign’s incremental effect than simply attributing the entire eight-point increase to advertising.
For larger campaigns, airports can intentionally create test and control groups. Similar ZIP codes can be selected based on passenger demand, airport share, geography, demographics, or other relevant characteristics.
Estimate Incremental Passengers
Once the airport estimates the incremental change in market share, it can translate that improvement into passenger trips.
Suppose the target ZIP codes generate 100,000 annual passenger trips and the estimated incremental share improvement is five percentage points.
Estimated Incremental Passenger Trips = 100,000 × 5% = 5,000
Now the Marketing team has a business outcome that is easier to understand than impressions or clicks:
The campaign was associated with approximately 5,000 incremental passenger trips.
The word approximately matters. Marketing attribution is rarely perfect, especially when fares, schedules, capacity, and competitor activity are changing at the same time.
Calculate Cost per Incremental Passenger
Once incremental passenger trips have been estimated, the airport can calculate a useful marketing efficiency measure:
Cost per Incremental Passenger = Marketing Spend ÷ Incremental Passenger Trips
If a campaign costs $100,000 and generates an estimated 5,000 incremental passenger trips:
$100,000 ÷ 5,000 = $20 per incremental passenger trip
This metric makes different campaigns easier to compare.
| Campaign | Spend | Incremental Passengers | Cost per Incremental Passenger |
|---|---|---|---|
| Campaign A | $100,000 | 5,000 | $20.00 |
| Campaign B | $60,000 | 1,500 | $40.00 |
| Campaign C | $80,000 | 6,000 | $13.33 |
Campaign C generated the most estimated passenger growth per marketing dollar.
Over time, this type of comparison can help airports determine which routes, geographic markets, media strategies, and messages tend to produce the strongest results.
Translate Passenger Growth into Airport Revenue
Incremental passengers may also generate airport revenue through:
- Parking
- Rental cars
- Food and beverage
- Retail
- Passenger facility charges
- Other passenger-related revenue
The financial benefit of an airport marketing campaign may continue well beyond the campaign period. If the campaign attracts new passengers, changes airport choice, or helps establish a new route, some of the incremental passenger traffic may continue for several years.
Suppose an airport estimates that each incremental passenger trip generates an average of $12 in net airport revenue. A campaign initially generates 5,000 incremental passenger trips, producing:
5,000 × $12 = $60,000 in incremental revenue in Year 1
If some of those passengers continue using the airport in future years, the airport should estimate the incremental revenue for each year and discount those future benefits to their present value.
For example, assume the campaign generates the following incremental revenue:
| Year | Incremental Revenue | Present Value at 7% |
|---|---|---|
| Year 1 | $60,000 | $56,075 |
| Year 2 | $48,000 | $41,925 |
| Year 3 | $36,000 | $29,388 |
| Total | $144,000 | $127,388 |
The present value of the campaign’s incremental revenue can be calculated as:
PV of Incremental Revenue = Σ [Incremental Revenueₜ ÷ (1 + r)ᵗ]
where r is the airport’s discount rate and t is the year in which the revenue is received.
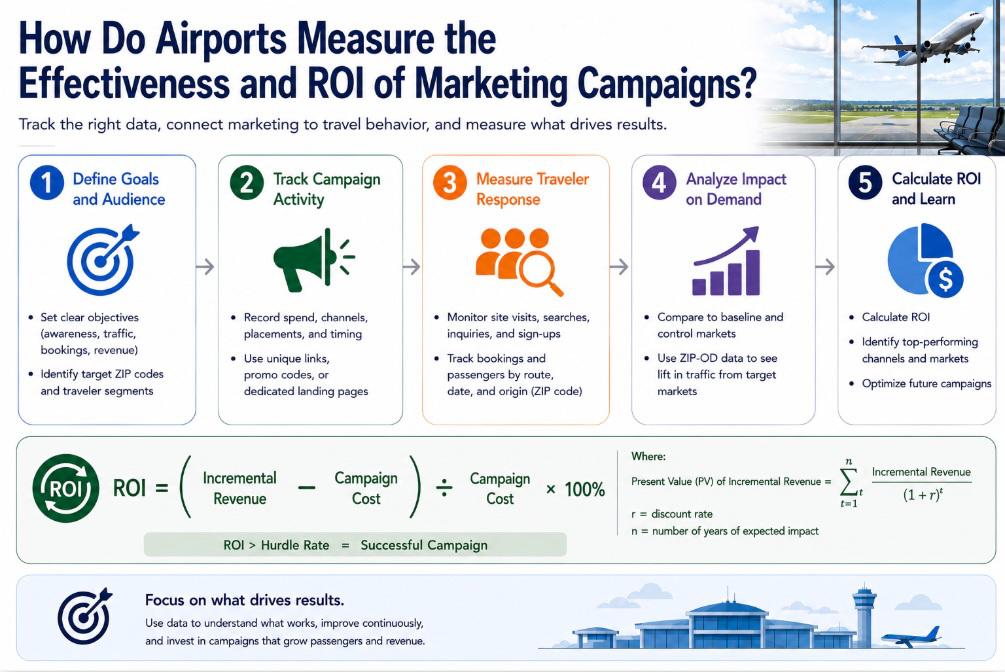
If the campaign costs $50,000, the ROI based on the present value of the expected revenue is:
Marketing ROI = (PV of Incremental Revenue − Marketing Cost) ÷ Marketing Cost × 100
ROI = ($127,388 − $50,000) ÷ $50,000 ≈ 155%
This approach provides a more complete picture of campaign value because it recognizes that marketing can influence passenger behavior beyond the year in which the advertising expense occurs.
Airport teams should clearly document the expected duration of the campaign effect, passenger retention assumptions, incremental revenue per passenger, discount rate, and the method used to estimate incremental passengers. Conservative assumptions are especially important when projecting benefits several years into the future.
Consider Strategic Value Alongside Direct ROI
Direct airport revenue does not capture the full value of every marketing campaign.
This is especially true for new-route marketing. A campaign may help:
- Improve load factor
- Build a new route toward sustainable traffic levels
- Protect an important nonstop
- Support additional frequency
- Increase airport market share
- Reduce leakage
- Strengthen future airline discussions
Suppose an airport spends $130,000 supporting a new route and the immediate incremental airport revenue is only $60,000. A simple financial ROI calculation would look negative.
If that marketing helps the route become established, however, the service may generate passenger and economic benefits for years. For this reason, airport teams can report direct financial return and strategic route value separately.
Confirm That the Campaign Actually Reached the Target Market
Before interpreting passenger results, check campaign delivery.
If Tier 1 ZIP codes received very little advertising, weak passenger performance may reflect media execution rather than poor market potential.
Useful delivery measures include:
- Reach by ZIP code
- Impressions by ZIP code
- Frequency
- Clicks
- Landing-page visits
- Booking-link clicks
These metrics are especially helpful for diagnosing the campaign.
For example, high impressions with few landing-page visits may indicate weak creative or messaging. Strong landing-page activity with few booking-link clicks may point to the schedule, fare, or page experience.
Digital metrics help explain what happened between advertising exposure and passenger behavior.
Use Airline Booking Data When Available
Airline partners may sometimes provide additional information such as bookings, revenue, origin markets, travel dates, or booking curves. This can strengthen campaign evaluation, particularly for a new route.
For example, the airport may see bookings accelerate after a campaign begins or find that bookings from targeted communities increase faster than those from other markets.
Airline booking data and airport passenger intelligence answer somewhat different questions. Airline data can show sales performance, while airport market data can show whether travelers are shifting from competing airports and whether the local airport is capturing more of the underlying market. Using both provides a more complete picture.
Measure New Route Campaigns at the Route Level
New-route campaigns usually have a clear passenger objective and can be measured more directly than broad airport branding.
A route scorecard might look like this:
| Metric | Before | After | Change |
|---|---|---|---|
| Route PDEW | 22 | 35 | +59% |
| Target ZIP passenger volume | 5,000 | 7,200 | +44% |
| Destination market share | 28% | 41% | +13 pts |
| Competing-airport passengers | 12,000 | 10,000 | -17% |
Together, these measures tell a useful story. Route traffic increased, the airport gained share, passenger volume from the targeted geography grew, and fewer travelers used competing airports.
The Marketing team can then compare these passenger outcomes with campaign timing, geographic delivery, and spending.
Brand Campaigns Need a Longer View
General airport-brand campaigns are harder to connect directly with individual passenger trips.
Their objectives may include changing perceptions such as:
- The local airport is easier to use.
- The airport has more nonstop destinations than travelers realize.
- Fares are more competitive than passengers assume.
- Travelers should check the local airport before booking elsewhere.
Surveys, brand awareness, airport consideration, search activity, and website traffic can help measure these campaigns.
Passenger behavior still matters, but changes in airport share or usage may take longer to appear. Brand campaigns should therefore be evaluated over a longer period than a short route promotion.
Build a Consistent Campaign Scorecard
Airports often run several campaigns during the year. Using a common scorecard makes results easier to compare.
A practical scorecard can include:
| Category | Measures |
|---|---|
| Investment | Campaign spend |
| Targeting | Geography, route, passenger segment |
| Media delivery | Reach, frequency, impressions |
| Engagement | Website visits, booking-link clicks |
| Passenger outcome | Passenger growth, PDEW, market-share change |
| Competitive outcome | Change in leakage or competing-airport usage |
| Efficiency | Cost per incremental passenger |
| Financial impact | Estimated incremental airport revenue |
Over time, the airport can learn which combinations of geography, route, message, and media generate the strongest passenger response.
How Fligence Can Help Measure Airport Marketing
FlightBI’s Fligence ZIP-OD can help connect airport marketing campaigns with changes in passenger behavior at the geographic and destination level.
Before a campaign, Marketing teams can establish baselines for:
- Passenger demand by ZIP code
- Airport market share
- Passenger leakage
- Destination-specific demand
- Competing-airport usage
After the campaign, the same measures can be calculated again.
For example, an airport promoting Orlando service in a group of ZIP codes can examine whether Orlando passenger volume increased, local airport share improved, and competing-airport usage declined within those same communities.
ZIP-level data can also help airports create comparison groups. A set of similar ZIP codes outside the active campaign area can provide a benchmark for understanding how much of the change may have occurred without the campaign.
This gives airport Marketing teams a practical way to connect where they spent marketing dollars with where passenger behavior changed.
A Practical Measurement Process
A useful airport marketing measurement process can follow eight steps:
- Define the objective. Decide which passenger behavior the campaign is intended to influence.
- Establish the baseline. Measure passenger volume, market share, destination demand, and competing-airport usage before launch.
- Define the target market. Record the ZIP codes, destinations, and passenger segments receiving the campaign.
- Track campaign delivery. Confirm that advertising actually reached those markets.
- Measure passenger outcomes. Compare passenger volume, PDEW, airport share, and leakage after the campaign.
- Estimate incremental impact. Use comparison markets or control groups when practical.
- Calculate efficiency and ROI. Estimate incremental passengers, cost per incremental passenger, and direct airport revenue.
- Apply the results. Use what worked to improve the next campaign.
The Bottom Line
Airport marketing measurement should connect campaign activity with actual passenger behavior.
Digital metrics remain useful because they show whether advertising reached and engaged the intended audience. Passenger data provides the next level of measurement: whether more travelers used the airport, whether market share improved, whether leakage declined, and whether the promoted route gained traffic.
From there, airports can estimate incremental passengers, calculate acquisition cost, and evaluate direct financial return. For route-support campaigns, strategic benefits such as route sustainability and additional frequency should also be considered.
The most useful question for an airport Marketing team is:
“How much did passenger behavior change in the market we targeted, and what did it cost us to create that change?”