
An airport’s market rarely grows evenly.
One county may be adding thousands of residents each year while another remains relatively stable. New housing can push population toward the outer edges of the catchment. Higher-income households may concentrate in particular suburbs. Employment growth can turn a previously small community into an important source of business travel.
For Air Service Development and Marketing teams, the important question is therefore more specific than whether the overall region is growing:
Where is our future passenger base growing, and is our airport positioned to capture it?
FlightBI’s Fligence ZIP-OD combines geographic passenger demand with population, income, migration, and other market characteristics to help airports see how their passenger geography is changing.
Regional Growth Can Hide Major Differences Within the Catchment
Consider Arizona. Between 2020 and 2024, Pinal County’s population grew 13.6%, more than twice the rate of neighboring Maricopa County at 6.7%. Yet Maricopa County remains vastly larger and added far more residents in absolute terms. For an airport serving the Phoenix region, a statewide or metropolitan growth rate would hide these important differences in where the market is expanding.
| County | 2020 Population | 2024 Population | Growth |
|---|---|---|---|
| Pinal County, AZ | 426,003 | 483,944 | +13.6% |
| Mohave County, AZ | 213,267 | 228,107 | +7.0% |
| Maricopa County, AZ | 4,428,646 | 4,726,247 | +6.7% |
| Pima County, AZ | 1,043,433 | 1,086,634 | +4.1% |
Source: Arizona Office of Economic Opportunity, July 1, 2024 Population Estimates.
If that growth continues, Pinal County could account for an increasingly share of future passenger demand. That matters for route development, marketing, leakage analysis, and even how the airport defines its competitive catchment.
Airports should also look at absolute population growth, not just percentage growth. Growth rate and absolute growth can tell different stories. From 2023 to 2024, Collin County in the Dallas-Fort Worth region grew approximately 3.9%, while Harris County, home to Houston, grew about 2.2%. Collin County grew much faster in percentage terms, but Harris County added more than 105,000 residents, compared with about 47,000 in Collin County.
| County | 2023 Population | 2024 Population | Residents Added | Growth Rate |
|---|---|---|---|---|
| Collin County, TX | 1,207,964 | 1,254,658 | 46,694 | 3.9% |
| Harris County, TX | 4,903,450 | 5,009,302 | 105,852 | 2.2% |
Source: U.S. Census Bureau, Vintage 2024 Population Estimates.
Both numbers tell something useful. Growth rate identifies communities changing rapidly. Absolute growth shows where the largest number of potential new passengers is being added.
Population Growth Is Only the Starting Point
Adding 46,700 residents does not translate automatically into a predictable number of airline passengers. The aviation impact depends on who those residents are, how often they travel, where they travel, which airports they can reasonably use, and what air service is available.
A useful example is air travel propensity. A community whose residents average six air trips per year could have a much larger aviation impact from the same population increase than a community averaging two trips per resident.
Income can matter as well. A ZIP code may grow only 5% in population while experiencing much faster growth in higher-income households. That change could affect leisure travel, premium demand, international travel, and willingness to pay for nonstop convenience.
Employment adds another dimension. New corporate offices, hospitals, universities, government facilities, technology operations, or manufacturing plants can generate business and visitor travel even when residential population changes relatively little.
This is why demographic growth becomes much more meaningful when it is compared with actual passenger behavior.
Find Growth Where Passenger Demand Is Already Strong
One of the most useful patterns for an airport is a community that is growing quickly and already generates substantial air travel.
Suppose a fast-growing county currently produces 250,000 annual passenger trips. Airport teams can examine where those passengers travel, whether their demand is increasing, which airlines they use, and how much traffic is captured by competing airports. If population and passenger demand are both rising, that county may become an increasingly important part of the airport’s market.
Another useful comparison is passenger growth versus population growth.
| County | 2019 Population | 2025 Population | Population Growth 2019–2025 | 2019 Resident Air Trips | 2025 resident Air Trips | Air Trip Growth 2019-2025 |
|---|---|---|---|---|---|---|
| Wake County, NC | 1,112,795 | 1,257,235 | +13.0% | 3,708,198 | 4,263,652 | +15.0% |
| Durham County, NC | 322,969 | 347,240 | +7.5% | 743,660 | 903,049 | +21.4 |
Source: U.S. Census Bureau, Fligence ZIP-OD
Using two counties in RDU Airport’s catchment as an example, Durham County, NC’s passenger demand is growing almost three times as fast as its population, suggesting that factors such as rising travel propensity, higher incomes, new business activity, or changing destination patterns may be generating additional air travel.
Wake County, NC, shows a different pattern. Both population and passenger demand are growing, but at similar rates. This suggests that much of Wake County’s passenger growth may be explained by population growth rather than a significant increase in travel propensity.
The contrast illustrates why population growth alone does not necessarily predict passenger growth. Comparing population and passenger trends can help airports identify where demand is increasing for reasons beyond population growth and investigate what is driving those changes.
Migration Helps Explain What Is Behind the Growth
Population data tells an airport where growth is occurring. Migration can help explain where the new residents came from and what that growth could mean for future travel.
Suppose a suburban county gains 30,000 residents. If 25,000 moved from a neighboring central county, much of the change represents population shifting within the existing airport market. The airport may still need to adjust its marketing geography, catchment assumptions, and competitive-airport analysis, but the regional passenger base has not necessarily increased by 30,000 people.
Long-distance migration can have a different effect. If substantial numbers of new residents in a North Carolina county are arriving from New York, Chicago, Boston, or South Florida, they may retain family, business, and social connections with those markets. Over time, those relationships can contribute to stronger O&D demand.
Migration can therefore help airports distinguish between market redistribution and true regional expansion, while also identifying outside markets that may become increasingly important.
Pay Particular Attention to Growth Near Competitive Boundaries
Fast-growing communities located between two airports can have an outsized effect on future market share. New residents may have several reasonable airport choices. Their decision could depend on drive time, nonstop service, fare, frequency, parking, and familiarity with each airport. Unlike long-time residents, they may not yet have established airport habits. Someone who recently relocated may continue searching the large hub they already recognize without realizing that a smaller airport is closer or offers relevant nonstop service. That makes fast-growing communities particularly interesting for airport marketing.
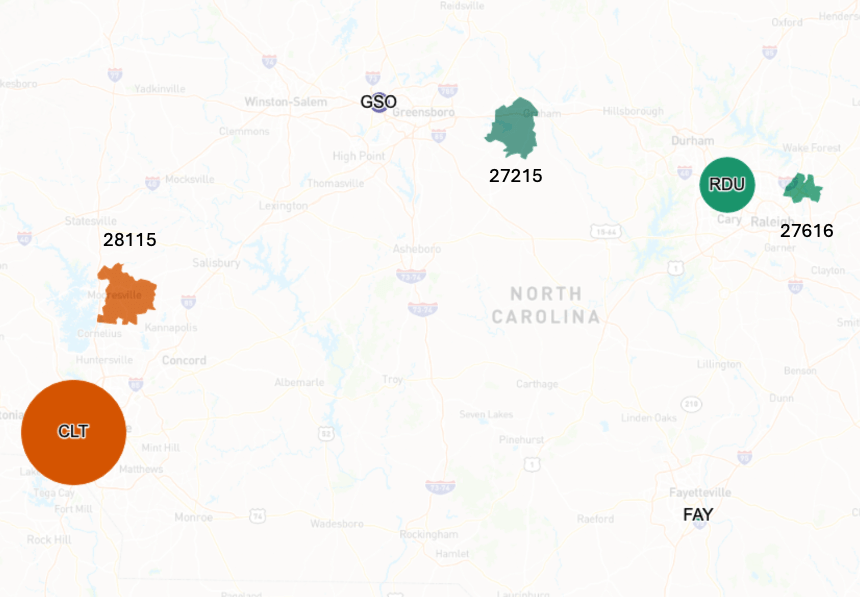
Consider three ZIP codes in North Carolina:
| ZIP code | 2019 Population | 2024 Population | Population Growth | 2019 Resident Air Trips | 2025 Resident Air Trips | Air Trip Growth | RDU Airport Share |
|---|---|---|---|---|---|---|---|
| 27616 Raleigh, NC | 55,128 | 63,520 | +15.2% | 177,462 | 236,723 | 33.4% | 97.7% |
| 27215 Burlington, NC | 42,331 | 47,102 | +11.3% | 56,303 | 78,394 | 39.2% | 72.3% |
| 28115 Mooresville, NC | 37,673 | 43,544 | +15.6% | 85,719 | 117,209 | 36.7% | 0.4% |
Source: U.S. Census Bureau, Fligence ZIP-OD
All three ZIP codes experienced strong population and air travel growth, but ZIP 27215 deserves particular attention. ZIP 27616 generates the most passenger demand, but RDU already captures 97.7% of that traffic, leaving little additional demand to recapture. ZIP 28115 is also growing quickly, but its proximity to American Airlines’ Charlotte hub makes it difficult for RDU to capture a significant share.
ZIP 27215 presents a different opportunity. It is growing quickly, already generates substantial passenger demand, and 27.7% of its traffic leaks away from RDU. If the area continues to grow, today’s leakage could become a much larger source of lost passengers. Improving RDU’s market share now, however, would allow the airport to capture more of that demand as the community expands.
This illustrates why growth and airport market share should be analyzed together. A fast-growing area with substantial leakage may offer more opportunity than a larger market where the airport already captures nearly all available demand.
Growth Can Point to Future Route Opportunities
Demographic change can also affect where people want to fly. Suppose a fast-growing county is receiving substantial migration from the Northeast. Over time, demand from that county to New York, Boston, or Philadelphia may increase as new residents maintain connections with their former communities. If one of those markets already has strong O&D demand, high leakage, and limited nonstop service, the demographic trend strengthens the route story.
Population growth by itself does not establish that a nonstop route will work. Airlines still need evidence of passenger demand, competitive service, fares, schedule quality, network value, and expected economics. But growth can help explain why an existing market may continue getting larger. That can be valuable in airline discussions. Instead of simply presenting current catchment population, an airport can say:
“This county already generates substantial passenger demand, has grown 15% over the past five years, continues to experience positive in-migration, and represents an increasing share of our regional O&D.”
That tells a more forward-looking story.
Growth Should Influence Marketing Geography Too
Airport marketing often focuses on today’s largest passenger markets. Growth data can help identify communities that may be more important tomorrow. Fast-growing areas may be good candidates for campaigns promoting airport awareness, available nonstop destinations, convenience, parking, or new service. This is especially relevant for recently arrived residents. They are still learning the region and may not have developed strong airport preferences. Reaching those households early gives the airport an opportunity to establish itself as their default airport as the community grows.
Build a Growth Opportunity Map
Rather than ranking communities on a single growth statistic, airports can combine demographic and aviation measures. A useful analysis might include:
- Population growth and absolute population gain
- Household and income growth
- Net migration and migration sources
- Employment growth
- Passenger demand and passenger growth
- Air trips per resident
- Local airport market share and leakage
- Airport accessibility and available air service
These measures can reveal several very different types of growth markets:
| Market Pattern | What It May Mean |
|---|---|
| Fast growth + high passenger demand + low airport share | Strategic passenger acquisition opportunity |
| Fast growth + high passenger demand + high airport share | Core growth market |
| Fast growth + low current passenger demand | Emerging market worth monitoring |
| Slow growth + high passenger demand | Mature core market |
This distinction matters. The largest passenger market today is not necessarily where the airport will find its greatest future growth.
How Fligence ZIP-OD Helps
Fligence ZIP-OD allows airport teams to examine passenger demand geographically alongside demographic and economic information. Population and income maps can show which parts of the catchment are changing. The Migration Dashboard adds IRS county-level in-migration, out-migration, net migration, migration trends, and income associated with migration.
Airport teams can then compare those changes with passenger demand, travel propensity, airport market share, leakage, and destination patterns. This makes it possible to identify communities that are growing quickly and determine whether that growth is already translating into aviation demand.
For example, an airport might discover that a suburban county is adding residents rapidly, has above-average air travel propensity, generates substantial passenger demand, but sends most of those passengers to a competing airport. That is much more actionable than simply knowing that the county’s population grew 15%.
The Bottom Line
Understanding where an airport market is growing requires more than ranking counties by population growth. Airport teams need to understand how many people are being added, who they are, where they came from, how much they travel, and which airport they choose.
The most interesting opportunities often appear where several trends come together:
Fast demographic growth + high travel propensity + substantial passenger demand + low local airport share
With Fligence ZIP-OD, airports can connect demographic and economic change with actual passenger behavior to see which communities are becoming more important and whether the airport is capturing that growth. The strategic question is:
Where is our future passenger base growing, and are we positioned to capture it?