
Not every community generates air travel at the same rate. Two ZIP codes may have similar populations but produce very different numbers of airline passengers.
For airport Air Service Development and Marketing teams, passenger volume tells only part of the story. Another useful question is:
Which communities generate more air travel than their population would suggest?
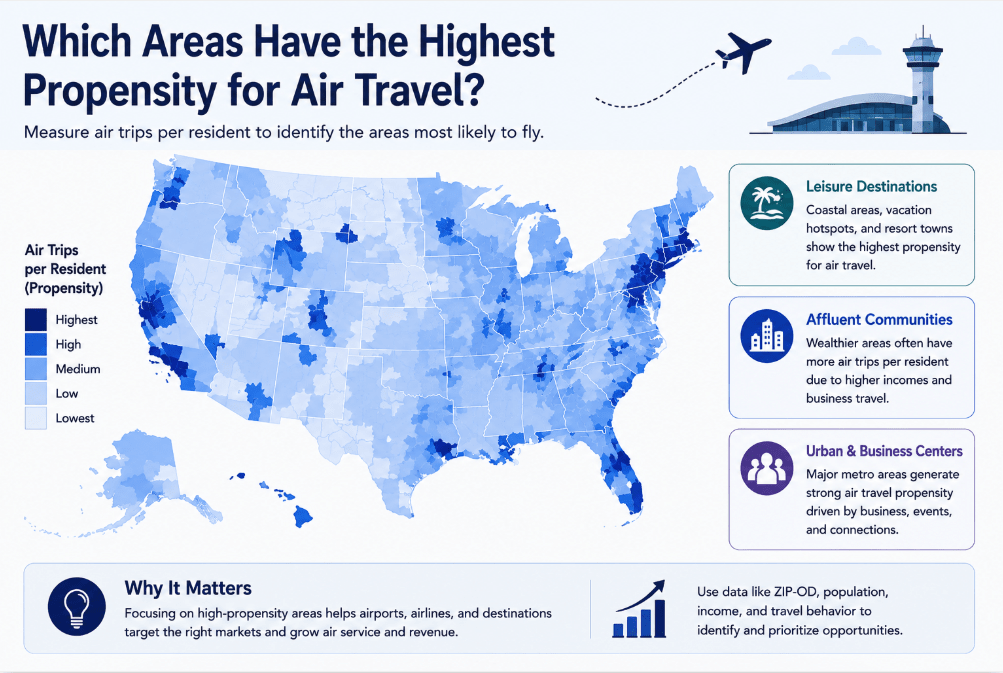
Comparing passenger demand with population or households can identify areas with unusually high air travel propensity. These communities may contain frequent travelers, business travelers, affluent households, university populations, or other groups that generate disproportionate levels of air travel.
What Is Air Travel Propensity?
Air travel propensity measures passenger activity relative to the size of the underlying population. At the ZIP-code level, a simple measure could be:
Air Travel Propensity = Resident Passenger Trips ÷ Resident Population
Another approach is:
Air Travel Propensity = Resident Passenger Trips ÷ Households
For example, the following two ZIP codes have similar number of residents but different annual trips. Please note that a trip is defined as a one-way O&D journey. Since many travelers make round trips, the trip counts shown here may be roughly twice the number of trips as commonly understood in everyday conversation.
| ZIP 22066 Great Falls, VA | ZIP 22553 Spotsylvania, VA | |
|---|---|---|
| Population | 16,884 | 16,960 |
| Annual resident passenger trips | 94,196 | 29,687 |
| Trips per resident | 5.6 | 1.8 |
ZIP 22066 generates three times as much air travel per resident, even though the two communities have similar populations. This is why population alone does not fully describe the strength of an aviation market.
Passenger Volume and Travel Propensity Answer Different Questions
A ZIP code generating the most passengers does not necessarily have the highest propensity to travel.
For example, consider two ZIP codes in the San Francisco Bay Area.
| ZIP Code | Population | Passenger Trips | Trips per Resident |
|---|---|---|---|
| 94586 Union City, CA | 68,141 | 203,764 | 3.0 |
| 94965 Sausalito, CA | 12,160 | 167,538 | 13.8 |
ZIP 94586 in Union City, located in the East Bay about 30 miles from San Francisco, generates more passenger trips overall and is therefore the larger aviation market. ZIP 94965 in Sausalito, an affluent coastal community across the Golden Gate Strait from San Francisco, generates fewer total trips. However, its residents travel much more frequently, producing 13.8 trips per resident compared with just 3.0 in Union City. In other words, Sausalito generates more than four times as many air trips per resident despite its much smaller population.
The two measures therefore answer different questions:
- Passenger volume: Where are the most travelers?
- Travel propensity: Where do residents travel disproportionately often?
Both matter. Passenger volume identifies the largest markets, while propensity can uncover smaller communities that punch above their weight in air travel.
What Creates High Air Travel Propensity?
There is rarely one explanation. High travel propensity can result from the demographic, economic, and institutional characteristics of a community.
Common drivers can include:
- Higher household income
- Corporate and professional employment
- Universities
- Government activity
- Military installations
- Frequent business travel
- International or long-distance travel
- Second homes and seasonal activity
The important point is to use these characteristics to explain observed passenger behavior, rather than assume they automatically create it.
For example, a wealthy ZIP code may have high travel propensity because residents take frequent leisure and international trips. Another ZIP code with more moderate household income may also have high propensity because it contains a large university or military population.
The passenger data identifies the pattern. Demographic and economic data can help explain why it exists.
Income Can Be an Important Driver
Higher-income households generally have more resources available for discretionary travel and may take more leisure, international, weekend, and second-home trips.
An affluent community may therefore generate substantially more passenger trips per household than another community of similar size.
But income alone should not be used to estimate propensity. Some affluent communities may generate only moderate air travel, while other areas generate unusually high demand because of business, university, government, military, or other activity.
Instead of asking only “Is this ZIP code wealthy?”, airport teams can ask:
“Does this ZIP code actually generate more air travel than we would expect from its population?”
Income can then help explain the answer.
Employment and Institutions Can Create High-Propensity Markets
Some communities generate high levels of travel because of the type of activity located there.
A concentration of corporate headquarters, technology companies, financial services, consulting firms, or government offices can produce significant business travel. Likewise, universities and military installations can create passenger activity that appears unusually large relative to the permanent population.
A university market, for example, can generate travel from:
- Students traveling home
- Parents and families
- Faculty and staff
- Athletics
- Recruiting
- Conferences
- Campus visits
Military and government communities can generate another set of recurring travel patterns related to official duties, training, contractors, family travel, and other activities.
This is why employee counts by industry, university populations, and government or military activity can provide valuable context when an airport finds a high-propensity ZIP code.
Be Careful with Visitor and Resort Markets
Travel propensity can be misleading if total passenger activity is divided by permanent population without separating visitors.
Suppose a mountain resort ZIP code has only 10,000 permanent residents but contains thousands of hotel rooms and second homes. It could generate enormous passenger activity relative to its population.
That does not necessarily mean its 10,000 residents travel constantly. Much of the activity may come from visitors and second-home owners.
If the objective is to measure how frequently local residents travel, the numerator and denominator should represent the same population:
Resident Travel Propensity = Resident Passenger Trips ÷ Resident Population
This avoids artificially high propensity estimates in areas containing major resorts, hotels, convention centers, attractions, or second homes.
Visitor demand and second-home travel are still important, but they should be analyzed separately rather than attributed to the permanent resident population.
Compare Propensity with a Regional Benchmark
A raw propensity value becomes more meaningful when compared with the airport’s broader market.
Suppose the catchment averages 0.55 resident passenger trips per capita. A ZIP code with 0.58 is only slightly above average, while a ZIP code with 1.10 generates twice the regional rate.
An airport can create a simple index:
Travel Propensity Index = ZIP Travel Propensity ÷ Regional Average
For example:
| Propensity Index | Interpretation |
|---|---|
| 0.70 | 30% below regional average |
| 1.00 | Equal to regional average |
| 1.50 | 50% above regional average |
| 2.00 | Twice the regional average |
This makes it easier to identify clusters of unusually travel-intensive communities across the airport’s market.
High Propensity Does Not Necessarily Mean High Opportunity
A ZIP code can have extremely high travel propensity and still be relatively unimportant commercially.
Consider:
| ZIP A | ZIP B | |
|---|---|---|
| Annual passenger demand | 5,000 | 80,000 |
| Travel propensity | Very high | High |
ZIP A is interesting because its residents travel frequently, but the small size of the market limits the total passenger opportunity. ZIP B may be much more valuable even though its propensity is lower.
This is why propensity should not be evaluated by itself. Airports should consider both the rate at which people travel and the number of passengers involved.
Add Airport Market Share to Find the Opportunity
The analysis becomes much more actionable when local airport share is added.
| ZIP Code | Passenger Demand | Travel Propensity | Local Airport Share |
|---|---|---|---|
| ZIP A | 40,000 | High | 75% |
| ZIP B | 45,000 | High | 35% |
| ZIP C | 25,000 | Very High | 30% |
| ZIP D | 60,000 | Moderate | 70% |
ZIP B stands out because it combines three attractive characteristics:
- High passenger demand
- High travel propensity
- Low local airport share
Residents already travel frequently, but a large portion of their trips use competing airports.
The next question is why.
If passengers are leaving because another airport has better nonstop service, frequency, fares, or airline connectivity, the pattern may point toward an Air Service Development issue.
If the local airport already provides a competitive flight option but still has low share, the ZIP code may be a strong candidate for targeted marketing.
Look at Where High-Propensity Travelers Go
Once a high-propensity community is identified, destination patterns can help explain what is driving the travel.
One ZIP code might generate unusually strong demand to New York, Chicago, and Washington because of business relationships. Another may over-index toward Florida, Las Vegas, or the Caribbean because of leisure travel. An affluent international community might generate strong demand to Europe or Asia.
Premium passenger data can provide another layer of information. A high-propensity ZIP code that also generates substantial premium demand may be particularly relevant for:
- Business-oriented routes
- Long-haul service
- Premium airline products
- Corporate sales
This moves the analysis beyond identifying who travels frequently to understanding what kind of air travel they generate.
Use Propensity to Find Markets That Punch Above Their Weight
One of the most useful applications of propensity analysis is finding communities that would be easy to overlook on a population map.
Suppose a ZIP code represents only 3% of the airport’s catchment population but generates 7% of resident passenger demand. That area clearly plays a larger role in the aviation market than its population would suggest.
These concentrations can help explain why airport catchments rarely form simple circles around an airport. A relatively distant affluent or business-oriented community may generate considerably more passenger demand than a closer community with lower travel propensity.
Airport demand depends on both geographic accessibility and the characteristics of the people and economic activity within that geography.
How Marketing Teams Can Use Travel Propensity
High-propensity communities can be attractive marketing markets because residents already demonstrate a strong tendency to fly. The airport does not necessarily need to create demand for air travel. Instead, it may need to influence which airport or flight those travelers choose.
However, high propensity alone is not enough.
If the airport already captures 90% of passengers from a high-propensity ZIP code, additional acquisition marketing may produce relatively little incremental traffic. A high-propensity ZIP code with substantial passenger volume and low local airport share is usually more interesting.
This allows marketing teams to move beyond targeting the largest population centers and focus on communities where there is both strong existing travel behavior and passenger share available to win.
How Air Service Development Teams Can Use Travel Propensity
For ASD teams, propensity provides context for O&D demand.
Instead of simply telling an airline that the catchment contains 800,000 residents, an airport can show that important parts of the market generate passenger trips at rates substantially above the regional average.
This can help explain why a market produces more O&D demand than population alone might suggest.
Propensity should support the passenger-demand analysis, not replace it. Airlines ultimately need sufficient passenger volume. The value of propensity is that it helps explain why the demand exists and which communities contribute disproportionately to it.
Build an Air Travel Propensity Opportunity Map
A practical approach is to evaluate each ZIP code across three dimensions:
- Passenger volume: How much air travel does the ZIP code generate?
- Travel propensity: How much does it generate relative to its population?
- Airport market share: How much of that demand does the local airport capture?
The combination creates several useful market profiles:
| Market Profile | Potential Interpretation |
|---|---|
| High volume + high propensity + low share | High-priority opportunity |
| High volume + high propensity + high share | Core market to protect |
| Lower volume + very high propensity | Specialized market worth investigating |
| High population + low propensity | Longer-term market requiring more analysis |
This framework is more useful than ranking ZIP codes by population, passenger volume, or propensity alone.
How Fligence ZIP-OD Helps Identify High-Propensity Markets
FlightBI’s Fligence ZIP-OD provides ZIP-level passenger demand that can be analyzed alongside population and other demographic and economic characteristics.
Airport teams can compare resident passenger demand with ZIP-code population to identify communities generating unusually high levels of air travel relative to their size.
Fligence also provides additional information that can help explain these patterns, including:
- Household income
- Households by income bucket
- Premium passenger demand
- Employee counts by industry
- University students
- Government and military populations
- Airport market share
- Destination demand
This turns travel propensity from a simple ratio into a way to understand why certain communities generate disproportionately high levels of air travel and whether the local airport is capturing that demand.
The Bottom Line
Air travel propensity identifies communities that generate more passenger trips relative to their population or household base.
But the ZIP code with the highest propensity is not automatically the airport’s best opportunity. A very small community may travel frequently but still generate relatively few passengers. A high-propensity market may also already be well captured by the local airport.
The strongest opportunities usually appear when airports analyze travel propensity together with passenger volume and airport market share.
For example, a ZIP code with high passenger demand, high travel propensity, and low local airport share deserves attention because residents already fly frequently, but many of those trips are going through competing airports.
With Fligence ZIP-OD, airport teams can identify these patterns at the ZIP-code level and then use demographic, economic, destination, and airport-choice data to understand what is driving them.
The goal is not simply to find where the most people live. It is to find where people travel disproportionately often, how much passenger demand they generate, and how much of that demand the airport is capturing.