
Not all passenger leakage represents the same opportunity for an airport. Some passengers using competing airports may be relatively easy to influence if the local airport already offers a comparable flight. Others may be traveling several hours to a major hub for international service or destinations the local airport cannot realistically provide.
The key is to identify addressable passenger leakage: leaked passenger demand where changes in air service, pricing, schedules, awareness, or marketing could realistically influence airport choice.
For Air Service Development and Marketing teams, this shifts the question from:
“How many passengers are we losing?”
to:
“Which passengers do we have the best opportunity to win back?”
What Is Addressable Passenger Leakage?
Addressable passenger leakage is the portion of passengers currently using another airport that the local airport could reasonably compete for.
Suppose an airport identifies 500,000 annual passenger trips using competing airports. It would be unrealistic to assume that all 500,000 could be recovered.
Some travelers may:
- Live much closer to another airport
- Need destinations unavailable locally
- Require international connectivity
- Prefer an airline with no local presence
- Have substantially better schedules elsewhere
Other passengers may live close to the airport, travel to destinations already served locally, and face only small differences in fare or schedule. Those passengers represent a very different opportunity.
Total leakage measures the size of the problem while addressable leakage measures the realistic opportunity.
Start with Passenger Volume, but Don’t Stop There
A large pool of leaked passengers deserves attention, but volume alone does not determine addressability. Consider two markets for residents around the Sonoma County airport (STS):
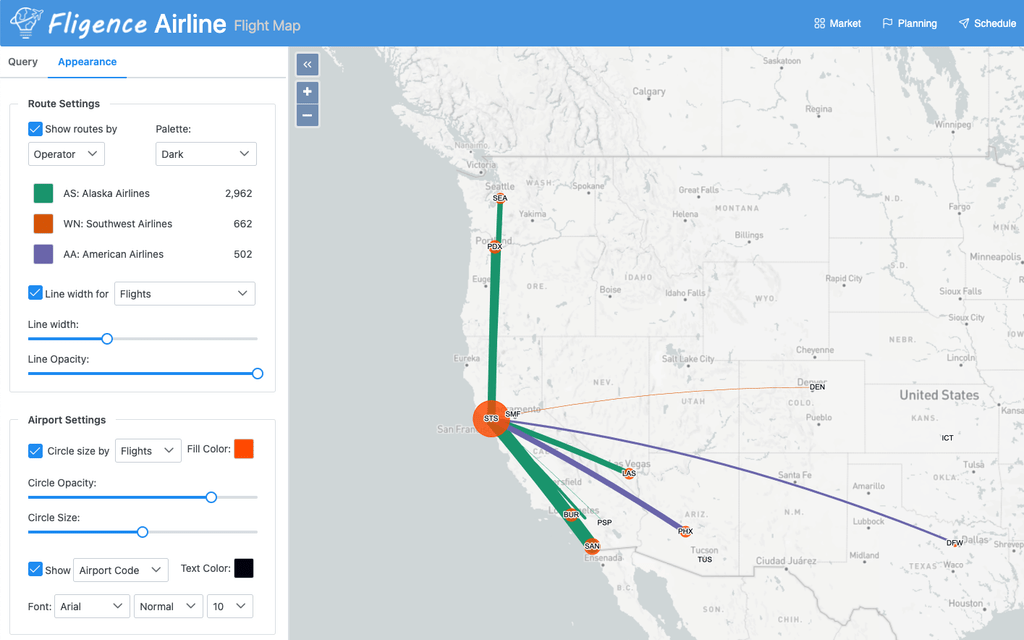
| Market | Leaked Passengers | Local Service | Passenger Geography |
|---|---|---|---|
| Dallas | 14,600 | Nonstop | Mostly near airport;, e.g. Sonoma County |
| London | 28,470 | No service | Mostly outer catchment, e.g. Areas closer to San Francisco |
The London market has substantially more leakage. But the Dallas market may provide the better near-term opportunity because the airport already has a product capable of serving those passengers.
A useful prioritization process therefore evaluates both the size of the leakage pool and the airport’s ability to compete for it.
1. Identify Passengers Close Enough to Be Realistically Influenced
Geography provides an important first filter. A passenger living 25 minutes from the local airport but driving 90 minutes to another airport represents a different opportunity from a passenger who lives 100 minutes from both airports. The first traveler is bypassing a significant convenience advantage. The second may simply live in an overlapping portion of the regional airport market.
Airport teams can therefore examine leaked passenger volume alongside:
- Drive time to the local airport
- Drive time to the airport currently being used
- Relative accessibility
- Geographic concentration of leaked passengers
High leakage relatively close to the airport can deserve particular attention because the local airport already possesses a built-in ground-access advantage.
2. Separate Serviceable Leakage from Unserviceable Leakage
The next question is whether the airport can actually meet the passenger’s travel need.
Suppose an airport identifies 100,000 leaked passenger trips. Of those:
- 40,000 travel to destinations already served nonstop
- 35,000 travel to destinations that may support future service
- 25,000 travel to destinations the airport is unlikely to serve
These are three fundamentally different opportunities. Passengers traveling to existing nonstop destinations may represent immediate retention opportunities. Passengers traveling to sufficiently large unserved markets may represent Air Service Development opportunities. Demand to markets that cannot realistically support local service may be much less addressable. Segmenting leakage this way prevents airports from treating all leaked passengers as equally recoverable.
3. Find Passengers Already Traveling to Destinations You Serve
One of the most actionable groups is passengers who live in the local market, travel to a destination the airport already serves, but still use another airport. For these passengers, the airport already has the fundamental product: the route. The next step is determining what is causing them to bypass it.
Possible issues may include:
- Fare difference
- Flight timing
- Frequency
- Limited awareness of the local service
- Airline preference
- Perception that another airport is cheaper
- Habit
This is an important distinction for Marketing teams. If the service already exists and is competitive, the problem may not require a new route. It may require better passenger awareness and more targeted communication.
4. Identify Large Unserved Markets That Could Support New Service
Another form of addressable leakage occurs when substantial passenger demand exists to a destination that is not currently served nonstop.
Suppose a regional market generates 85 PDEW to Destination X with 12 PDEW using the local airport through connections and 73 PDEW using competing airports. This is very different from an unserved destination generating only 8 PDEW. The 85-PDEW market may deserve deeper route analysis.
Air Service Development teams can examine whether the leaked passengers are geographically concentrated, which airlines they use, what competing nonstop service exists, and how much demand a local nonstop could reasonably capture or stimulate.
The objective is not to claim that all 73 leaked PDEW would switch. It is to estimate a realistic capture scenario.
5. Look for Markets Where the Local Airport Is Already Competitive
Addressability tends to be greater when the behavioral change required from the passenger is relatively small.
Suppose a traveler currently drives 70 minutes to a competing airport while living only 25 minutes from the local airport. The local airport offers the same nonstop destination at a fare only $20 higher. That passenger may require relatively little incentive to switch.
Compare that with a traveler driving to a hub for a nonstop international flight when the local airport offers only a two-stop itinerary. The second passenger would require a fundamental change in air service.
Airports can therefore look for markets where they already have:
- Comparable or better service
- Competitive fares
- A ground-access advantage
- Useful schedules
- Meaningful existing passenger share
These conditions can indicate that a larger portion of the leakage may be addressable.
6. Distinguish an Air Service Problem from a Marketing Problem
This is one of the most useful outcomes of addressability analysis. If passengers are leaving because the local airport does not offer the destination they need, the problem is primarily an Air Service Development problem. If the airport already offers a competitive nonstop flight but substantial numbers of nearby passengers continue using another airport, the opportunity may be more of a Marketing problem.
Using Sonoma County airport (STS, local airport) and San Francisco International airport (SFO, comeptitor) as an example:
Scenario A – Chicago (ORD) Market:
Local airport: No nonstop service
Competitor: Nonstop service
Leakage: High
Likely response: Evaluate new or improved air service.
Scenario B – Orange County (SNA) Market:
Local airport: Nonstop service
Competitor: Nonstop service
Fare difference: Small ($174 at STS vs. $172 at SFO)
Local airport is much closer
Leakage: Still high
Likely response: Investigate awareness, perception, schedule, airline preference, and targeted marketing.
Scenario C – Phoenix (PHX) Market:
Local airport: Nonstop service
Competitor: Nonstop service
Local fare: Significantly higher ($253 at STS vs. $147 at SFO)
Leakage: High
Likely response: Fare competitiveness and airline discussions may deserve attention.
The same leakage percentage can therefore lead to completely different strategies.
7. Build an Addressable Leakage Score
Instead of ranking opportunities only by passenger volume, airports can create an addressability score. For example, each ZIP code/destination combination could be evaluated using factors such as:
| Factor | Example Question |
| Leakage volume | How many passengers are using another airport? |
| Local accessibility | How convenient is the local airport for these passengers? |
| Destination demand | Is the market large enough to matter? |
| Local service | Is nonstop service already available? |
| Fare competitiveness | Is the local fare reasonably competitive? |
| Schedule | Is the local schedule practical? |
| Geographic concentration | Is the demand concentrated enough to target? |
| Potential action | Can ASD or Marketing realistically address the issue? |
The airport can then classify opportunities as:
- High addressability
- Moderate addressability
- Low addressability
This provides a much more useful prioritization framework than simply ranking ZIP codes by leakage rate.
8. Prioritize ZIP Code + Destination Combinations
The most actionable unit of analysis may not be the ZIP code or destination alone. It may be the combination: ZIP code + destination
It’s useful to know ZIP 94928 has 143,337 leaked passenger trips annually. But it becomes much more actionable if the airport discovers that:
- 1,545 are traveling from San Francisco to New York by United Airlines
- 1,334 from Oakland to Las Vegas by Southwest
- 1,041 from San Francisco to Chicago by United
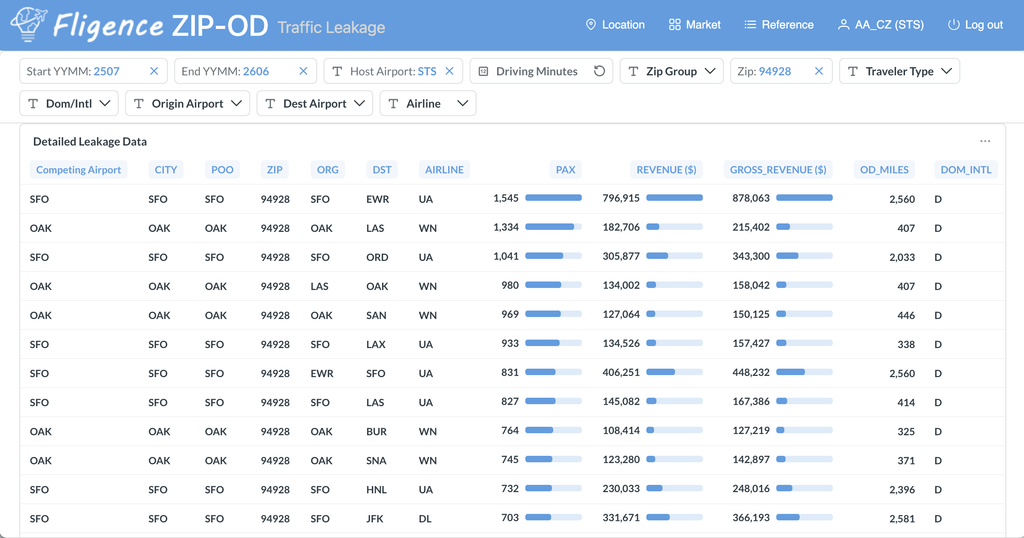
Now Air Service Development and Marketing teams can determine whether the airport has a competitive product for each of those specific passenger groups. This moves leakage analysis from a broad geographic problem to a set of specific addressable markets.
9. Recover Existing-Service Leakage Through Targeted Marketing
When a local nonstop already exists, airports can use geographic passenger intelligence to make marketing more precise.
Suppose the airport launches or already operates nonstop Nashville service. Instead of advertising Nashville equally across the entire metropolitan region, the airport can identify ZIP codes where:
- Nashville demand is high
- A large number of passengers currently use other airports
- Residents are reasonably close to the local airport
Those communities become natural audiences for the campaign. Messaging can then emphasize the local airport’s specific advantages:
- Fly Nashville nonstop from your local airport
- Avoid the longer drive
- Save time before and after your flight
- Compare the complete trip, not just airfare
The objective is to communicate a relevant alternative to passengers whose existing behavior shows that they already travel to the destination.
10. Recover Unserved Leakage Through Air Service Development
For destinations without local nonstop service, the recovery strategy is different. Large concentrations of leaked passenger demand can help identify potential route opportunities.
Air Service Development teams can quantify:
- Total local market PDEW
- PDEW using competing airports
- Geographic distribution of the passengers
- Competing nonstop service
- Airlines currently carrying the passengers
- Fare levels
- Potential capture and stimulation
This evidence can support airline discussions because the airport can present a specific opportunity to an airline:
“Our market generates substantial daily demand to this destination, concentrated in communities close to our airport, and most of those passengers currently drive to another airport for nonstop service.”
That is a much stronger route-development story.
11. Coordinate Air Service Development and Marketing
Addressable leakage sits directly between Air Service Development and airport Marketing. The two teams can use the same analysis for different purposes.
Air Service Development asks: Which leakage markets could justify better air service?
Marketing asks: Which leakage markets can we influence with the service we already have?
This creates a useful workflow:
Passenger data identifies the opportunity
→ ASD determines whether the product is competitive
→ Marketing identifies and reaches the relevant geographic audience
→ Passenger behavior is measured afterward
Rather than treating route development and marketing as separate activities, addressable leakage analysis can connect them.
12. Measure Whether Passengers Actually Return
Recovery efforts should ultimately be measured through passenger behavior.
Suppose an airport identifies five high-addressability ZIP codes for an existing nonstop route and conducts a targeted marketing campaign. Afterward, the airport can examine whether:
- Passenger volume from those ZIP codes increased
- Local airport market share improved
- Destination-specific leakage declined
Likewise, after new service begins, Air Service Development teams can measure how much demand shifts from competing airports to the local airport.
This creates a measurable cycle: Identify → Prioritize → Act → Measure
Over time, airports can learn which types of leakage are most responsive to air service improvements and marketing.
Don’t Measure Success Only by Eliminating Leakage
A regional airport will rarely eliminate passenger leakage completely—and that should not necessarily be the goal. Some leakage is structural. Passengers will continue to use major hubs for destinations, airlines, schedules, or international connections that a smaller airport cannot reasonably replicate.
The objective should therefore be to improve performance in the markets where the airport has a credible opportunity to compete. For example, reducing leakage from 45% to 35% in a high-demand local market may represent a significant success even though more than one-third of passengers still use another airport. Addressability provides a more realistic framework for setting those expectations.
How Fligence Can Help Identify Addressable Leakage
FlightBI’s Fligence ZIP-OD platform allows airport teams to bring together the different dimensions needed to evaluate addressability.
Airport teams can examine:
- Passenger demand and leakage by ZIP code
- Passenger demand by destination
- Which airports passengers currently use
- PDEW from the target airport and competing airports
- Average fare compared with competing airports
- Resident passenger locations
- Drive-time and geographic patterns
Instead of simply identifying the largest leakage markets, these dimensions can help airports determine which leakage markets have characteristics that make them more realistically addressable.
Air Service Development teams can use the results to prioritize route opportunities, while Marketing teams can identify geographic audiences for existing and new service.
From Leakage to Opportunity
A useful addressable-leakage strategy can be summarized as:
1. Find the demand.
Identify meaningful concentrations of leaked passengers.
2. Segment the demand.
Break leakage down by ZIP code and destination.
3. Evaluate addressability.
Consider geography, service, fares, schedules, and market size.
4. Identify the appropriate response.
Determine whether the opportunity requires air service development, marketing, or another action.
5. Target the opportunity.
Focus resources on passengers and markets where behavior has a realistic chance of changing.
6. Measure the result.
Track passenger volume and market position after the intervention.
This approach turns leakage from a problem to be measured into an opportunity that can be prioritized.
The Bottom Line
The largest passenger leakage market is not necessarily the best passenger recovery opportunity. Airports should focus on addressable leakage: passengers currently using another airport whose behavior could realistically change because of better local service, competitive fares, convenient schedules, geographic advantages, or greater awareness.
The strongest opportunities often combine: substantial passenger demand + meaningful leakage + favorable geography + a competitive or achievable air service product.
By evaluating leakage at the ZIP code + destination level, airport teams can separate structural leakage from realistic opportunities. Air Service Development can focus on markets where improved service could bring passengers back. Marketing can focus on passengers for whom a competitive local option already exists.
The strategic question is no longer:
“How much passenger leakage do we have?”
It becomes:
“Which leaked passengers can we realistically recover—and what would it take to win them back?”