
There is no single distance or drive time that all passengers are willing to travel to reach an airport. Some travelers use an airport close to home, while others may drive one, two, or even several hours to access better air service.
How far passengers are willing to drive depends on factors such as nonstop flight availability, airfare, flight frequency, destination, airport size, trip purpose, and the alternatives available nearby.
For airports, understanding actual passenger drive-time patterns provides a more realistic picture of market reach than simply defining a catchment area using a fixed 60- or 90-minute boundary.
What Is a Typical Airport Drive-Time Catchment?
Airport catchment studies commonly use drive-time bands such as:
- 0–30 minutes
- 30–60 minutes
- 60–90 minutes
- 90–120 minutes
- More than 120 minutes
These bands are useful for organizing and visualizing an airport’s geographic market, but they should not be interpreted as universal limits on passenger behavior.
A 60-minute drive-time boundary does not mean everyone inside that boundary will use the airport. Likewise, a 90-minute boundary does not mean travelers outside it will not.
The better question is:
What percentage of our airport’s passengers actually comes from each drive-time band?
Why Will Some Passengers Drive Farther Than Others?
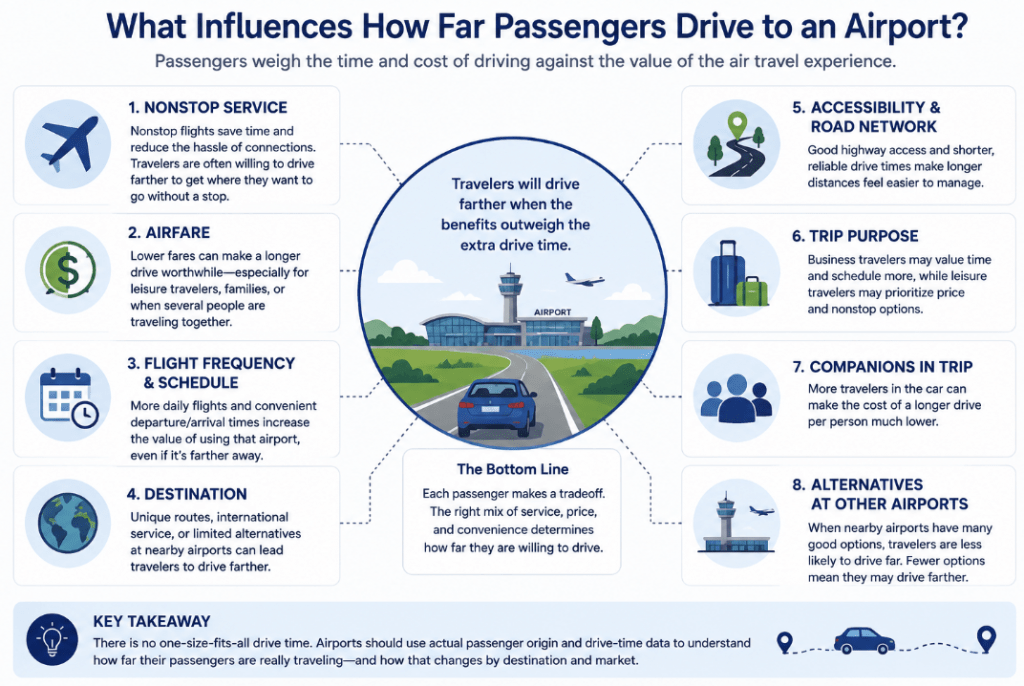
Airport choice involves a tradeoff between the inconvenience of traveling farther to an airport and the benefits available once the passenger gets there.
A traveler may be willing to drive farther when the additional travel time provides a meaningful advantage.
Nonstop Service
Nonstop service can significantly increase an airport’s geographic reach.
A passenger may be willing to drive an additional hour to access a nonstop flight rather than use a closer airport that requires a connection. For example, it is not uncommon for Saskatchewan residents to drive several hours to Calgary (YYC) for a non-stop flight to Tokyo (NRT).
This is particularly important when evaluating the market for new or unique nonstop service.
An airport’s overall passenger base may be relatively concentrated, while passengers using a specific nonstop route may come from a much broader region.
Airfare
Fare differences can also affect how far passengers are willing to drive. People living in North Virginia are often seen to drive to the BWI airport for a flight rather than using IAD or DCA because BWI is a base station of multiple LCCs that offer cheaper fares.
Leisure travelers, families, and other price-sensitive passengers may accept a longer drive when the airfare savings are substantial—especially when the savings apply to several people traveling together.
The relevant decision is therefore not simply:
“Which airport is closest?”
It may be:
“Is the airfare savings worth the additional drive?”
Flight Frequency and Schedule
Passengers may drive farther for an airport offering more flight frequencies or a schedule that better fits their needs.
An airport offering several daily departures provides greater flexibility than one offering a single daily flight.
Schedule differences can be especially important for business travelers and passengers making connections.
Destination
Drive-time behavior can vary significantly by destination.
For a common destination served by several airports, passengers may have little reason to travel far.
For a unique nonstop destination, international service, or market with limited alternatives, travelers may be willing to drive considerably farther.
This means an airport can effectively have different geographic passenger markets for different destinations.
Trip Purpose
Business and leisure passengers can also behave differently.
Business travelers may place greater value on time, schedule, convenience, and frequency. Leisure travelers may be more willing to trade additional driving time for lower fares or nonstop service.
Airport drive-time behavior can therefore vary by passenger segment. Many airports have a regular catchment area and a LCC (Low Cost carrier) catchment area. The LCC area is usually larger than the regular one because the former targets more on leisure travelers, which are willing to drive from far away places.
Distance and Drive Time Are Not the Same
Straight-line distance is a simple way to measure how far passengers live from an airport, but it does not always represent actual accessibility.
Two communities located 50 miles from an airport could have very different travel times because of:
- Highway access
- Traffic congestion
- Mountains or waterways
- Road configuration
- Urban density
- Bridges and tunnels
- Other geographic constraints
For this reason, drive time is generally more useful than straight-line distance when analyzing how accessible an airport is to passengers. A 50-mile trip on an interstate highway may be easier than a 30-mile trip through a congested metropolitan area. That’s why most Fligence dashboards use drive time instead of distance.
How Can Airports Measure How Far Their Passengers Actually Travel?
Instead of assuming a maximum drive time, airports can analyze where their passengers live and calculate travel time between those locations and the airport.
For example, an airport’s resident passenger distribution might look like this:
| Drive Time to Airport | Share of Resident Passengers |
|---|---|
| 0–30 minutes | 29% |
| 30–60 minutes | 38% |
| 60–90 minutes | 20% |
| 90–120 minutes | 9% |
| 120+ minutes | 4% |
In this hypothetical example, 67% of resident passengers live within 60 minutes, while 13% travel more than 90 minutes to reach the airport.
Another airport could have a completely different distribution.
This is why actual passenger-location data can provide more insight than choosing an arbitrary drive-time boundary.
Look at Cumulative Passenger Reach
Another useful way to understand airport drive time is to calculate the percentage of passengers captured as the drive-time area expands.
For example:
| Drive Time | Cumulative Share of Resident Passengers |
| Within 30 minutes | 29% |
| Within 60 minutes | 67% |
| Within 90 minutes | 87% |
| Within 120 minutes | 96% |
| Beyond 120 minutes | 100% |
This helps answer questions such as:
- How far do we need to extend our geographic market to capture 50% of our passengers?
- What drive time contains 80% of our resident passengers?
- How much passenger demand comes from beyond 90 minutes?
These measures can provide a more defensible description of an airport’s geographic reach than simply saying that the airport has a “90-minute catchment.”
Measure Drive Time by Destination
Airport-wide drive-time analysis is useful, but Air Service Development teams can gain additional insight by analyzing individual destinations.
Suppose 80% of all airport passengers live within 75 minutes of the airport.
Passengers traveling on a particular nonstop route or an international route, however, may have a much broader distribution, with 80% living within 110 minutes.
That difference suggests that the route attracts passengers from beyond the airport’s normal geographic footprint.
This can be particularly valuable when analyzing:
- Unique nonstop routes
- International service
- Leisure destinations
- Low-frequency markets
- Proposed new routes
- Routes with limited nearby alternatives
For airline presentations, showing the geographic distribution of passengers traveling to a specific destination can help demonstrate the true geographic depth of the market.
How Drive Time Relates to Airport Catchment Areas
Drive time is one of the most common ways to define an airport catchment area.
For example, an airport might initially define:
Primary catchment: within 60 minutes
Secondary catchment: 60–90 minutes
Extended catchment: 90–120 minutes
This provides a useful geographic framework, but it should not automatically be treated as the airport’s actual passenger market.
A drive-time map tells you:
Who can reasonably reach the airport?
Passenger-location analysis tells you:
Where the airport’s passengers actually come from.
Combining the two provides a much stronger understanding of airport market reach.
How Air Service Development Teams Can Use Drive-Time Analysis
Understanding passenger drive-time patterns can help Air Service Development teams:
- Demonstrate the geographic reach of the airport
- Define primary, secondary, and extended passenger markets
- Show airlines how far existing passengers travel to use the airport
- Evaluate the geographic depth of demand for a destination
- Support new-route business cases
- Compare airport-wide and route-specific passenger distributions
- Identify communities contributing demand beyond traditional catchment boundaries
Rather than telling an airline that the airport serves everyone within 90 minutes, an airport can provide evidence showing how many actual passengers originate within each drive-time band.
How Airport Marketing Teams Can Use Drive-Time Analysis
Drive-time analysis can also help marketing teams understand how geographically dispersed their passenger audience is.
Marketing teams can use this information to:
- Define geographic campaign areas
- Understand where the majority of passengers live
- Determine whether campaigns should extend beyond the immediate metropolitan area
- Support new-route marketing
- Compare passenger concentrations across drive-time bands
- Identify communities within the airport’s broader geographic footprint
Drive time can provide a useful starting point for geographic targeting, while passenger-location and market-opportunity analysis can determine which specific ZIP codes deserve the greatest attention.
Use Actual Passenger Behavior Instead of an Arbitrary Boundary
A common mistake in airport market analysis is assuming that a particular drive time—such as 60, 90, or 120 minutes—defines the airport’s market.
In reality, passenger behavior does not stop at a drive-time boundary.
The geographic reach of an airport depends on the airport, its available service, the destination being analyzed, passenger characteristics, and the surrounding competitive environment.
A better approach is to begin with actual passenger origins and measure:
- Where do passengers live?
- How long does it take them to reach the airport?
- What percentage of passengers comes from each drive-time band?
- Does that distribution change by destination?
These questions provide a behavioral view of airport accessibility and market reach.
The Bottom Line
How far will passengers drive to an airport?
There is no universal answer.
Some passengers may travel only 20 or 30 minutes, while others may drive more than two hours when the airport offers a compelling advantage such as a nonstop flight, lower airfare, better schedule, or unique service.
Rather than assuming a fixed catchment boundary, airports can combine resident passenger locations with drive-time analysis to determine how far their passengers actually travel.
This allows Air Service Development and Marketing teams to understand the airport’s real geographic reach, identify the drive-time bands generating the most passengers, and determine how passenger behavior changes for different destinations and types of air service.