
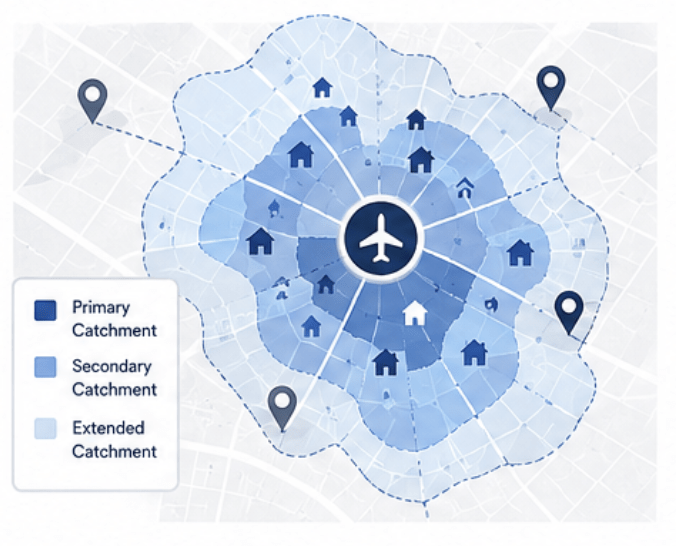
An airport catchment area is the geographic area from which an airport attracts passengers. It represents the communities, ZIP codes, or other geographic areas where travelers are likely to choose that airport as their point of origin for air travel.
An airport catchment area can be calculated in several ways, ranging from simple distance or drive-time boundaries to models that account for competing airports and actual passenger behavior. The most useful modern approaches combine geographic accessibility, airport attractiveness, and observed traveler behavior to determine where passengers actually come from and which airport they choose.
Understanding an airport’s true catchment area is fundamental to air service development, passenger leakage analysis, airport marketing, and demand forecasting.
Why Is an Airport Catchment Area Important?
An airport does not serve only the city or county in which it is located. Its passengers may come from dozens or even hundreds of surrounding communities. At the same time, people living near an airport do not necessarily use that airport.
They may drive to another airport because of lower fares, better schedules, nonstop service, airline preference, or greater connectivity.
Defining the catchment area helps airport teams answer important questions such as:
- Where do our passengers come from?
- How large is our actual passenger market?
- Which communities contribute the most passengers?
- Where are we losing passengers to competing airports?
- Which routes have enough local demand to support new service?
- Where should airport marketing efforts be concentrated?
An inaccurate catchment definition can overstate market demand, misdirect marketing resources, weaken airline proposals, and affect long-term planning. A data-driven catchment provides a more credible picture of an airport’s true market.
How Is an Airport Catchment Area Calculated?
There is no single method for calculating an airport catchment area. The appropriate approach depends on the question the airport is trying to answer.
Five commonly used methods are:
1. Radius Method
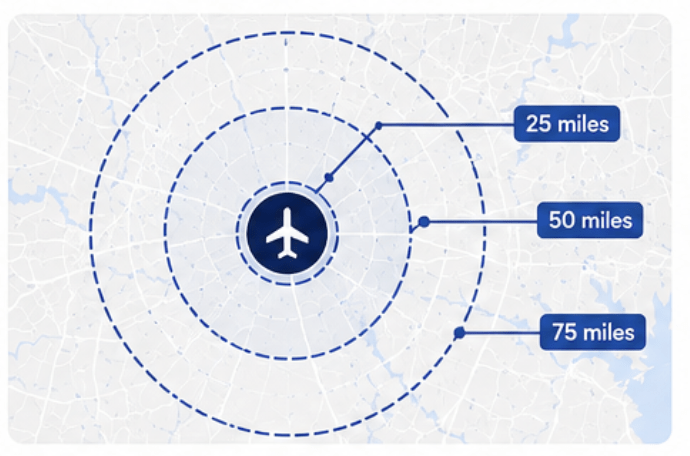
The simplest approach is to draw a fixed-radius circle around the airport, such as 25, 50, or 75 miles.
This method is easy to calculate and visualize, but it assumes that every location the same straight-line distance from an airport has similar access to it.
In reality, mountains, rivers, road networks, congestion, and other geographic factors can make two communities located the same distance from an airport very different markets.
For this reason, radius-based catchments are generally better suited for high-level illustrations than detailed passenger market analysis.
2. Drive-Time Catchment
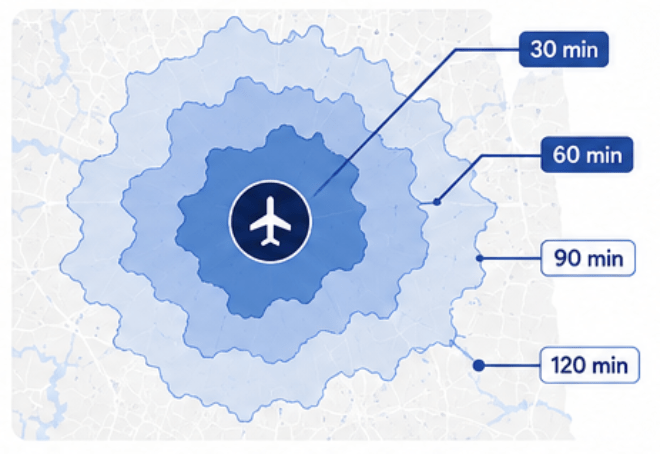
A more realistic geographic approach defines the catchment according to how long it takes to drive to the airport.
An airport might analyze areas within:
30 minutes → 60 minutes → 90 minutes → 120 minutes
Drive-time analysis incorporates road networks, roadway speeds, and geographic constraints, providing a better representation of airport accessibility than a simple radius.
However, accessibility does not necessarily equal airport preference.
A traveler who lives 45 minutes from Airport A and 70 minutes from Airport B may still choose Airport B if the latter offers a nonstop flight, substantially lower fare, better schedule, or preferred airline.
Drive time therefore tells an airport who can conveniently reach it, but not necessarily who will choose it.
3. Equal-Distance or Split-Line Method
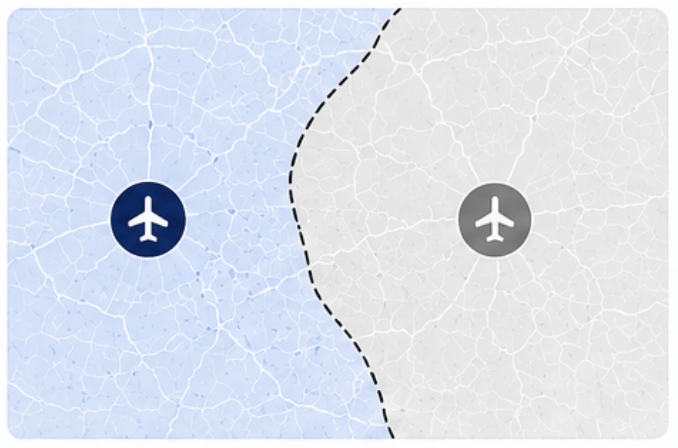
Another approach establishes boundaries between competing airports based on geographic midpoint or equal travel distance.
For example, if two airports serve the same region, a theoretical boundary can be drawn where residents are approximately equally distant from both airports.
This method provides a straightforward way to visualize overlapping markets and competition.
But passengers do not choose airports based on distance alone. Two airports that are equally accessible may offer very different fares, destinations, frequencies, airlines, and connection opportunities.
As a result, split-line boundaries represent theoretical competition rather than actual passenger behavior.
4. Gravity or Huff Model
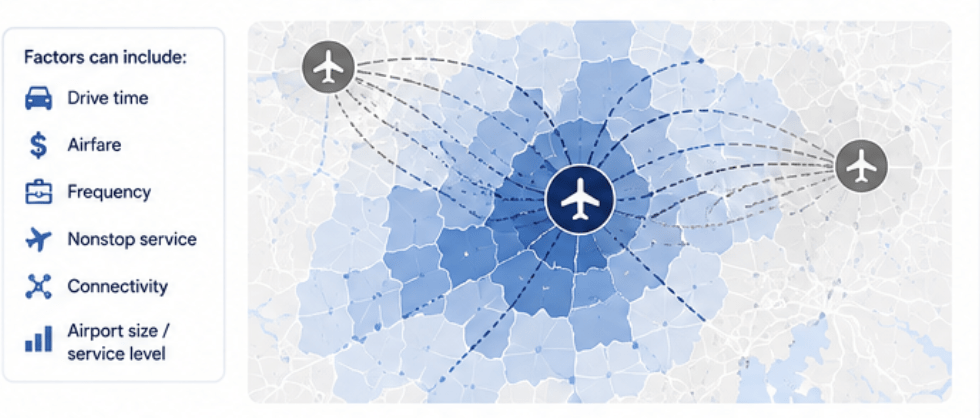
A more sophisticated approach estimates the probability that travelers from each geographic area will choose one airport over another.
Gravity models can incorporate factors such as:
- Drive time
- Airfare
- Flight frequency
- Nonstop service
- Connectivity
- Airport size or service level
The basic concept is straightforward: airport choice depends both on how difficult an airport is to reach and how attractive that airport is to the traveler.
For example, a larger airport 80 minutes away may attract more passengers from a particular ZIP code than a smaller airport only 45 minutes away because the larger airport offers significantly more nonstop destinations and lower fares.
Gravity models are especially useful in regions where multiple airports compete for the same passengers. They can also help estimate how passenger behavior might change when new service is introduced or airport accessibility improves.
However, gravity models remain models. Their results depend on the assumptions, variables, weights, and underlying data used to calculate airport-choice probabilities.
5. Behavioral or Dominant-Position Method
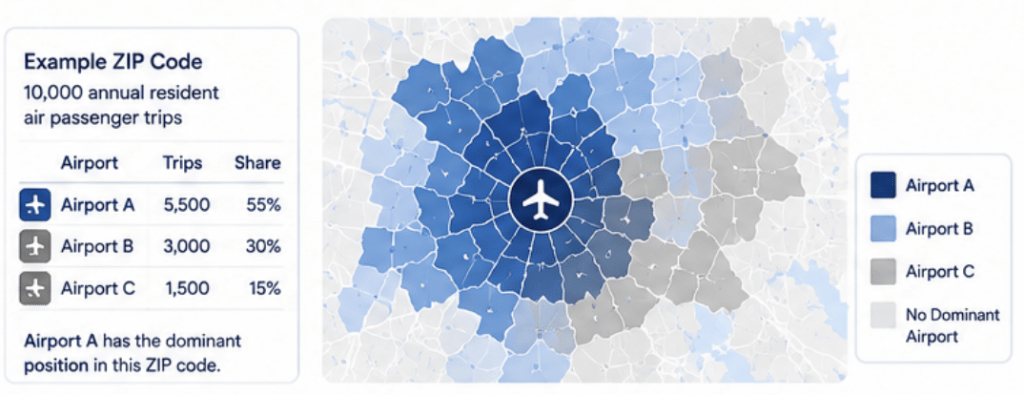
A behavioral catchment takes a different approach.
Instead of asking:
“Which airport should passengers use based on geography?”
it asks:
“Which airport are passengers actually choosing?”
Actual traveler behavior can be analyzed at a detailed geographic level to determine which airport has the strongest position within each ZIP code or local market.
For example, imagine a ZIP code generates 10,000 annual resident air passenger trips:
| Airport | Passenger Trips | Market Share |
|---|---|---|
| Airport A | 5,500 | 55% |
| Airport B | 3,000 | 30% |
| Airport C | 1,500 | 15% |
Airport A has the dominant position in this ZIP code even if another airport happens to be geographically closer.
Repeating this analysis across ZIP codes allows an airport to build a catchment based on observed airport choice rather than an arbitrary geographic boundary.
Behavioral analysis can also reveal where an airport is strong, where competition is greatest, and where significant passenger leakage exists.
So, Which Catchment Method Is Best?
There is no single method that is appropriate for every airport analysis.
A comprehensive catchment analysis can combine three perspectives:
- Geographic accessibility tells you which airport travelers can conveniently reach.
- Modeled airport choice estimates how travelers may respond to differences in service, fares, connectivity, and accessibility.
- Observed passenger behavior shows which airports travelers are actually choosing today.
Together, these approaches provide a more complete understanding of an airport’s market than a fixed radius or drive-time boundary alone.
For air service development and marketing in particular, observed passenger behavior is especially valuable because airlines and airports ultimately need to understand actual market demand and airport choice, not simply the population located within a geographic boundary.
Airport Catchment Areas Are Dynamic
One of the most important concepts in airport catchment analysis is that an airport does not necessarily have one permanent catchment area.
Passenger behavior changes.
An airport’s effective catchment can expand or contract depending on:
- Route type. Travelers may drive farther for a nonstop international flight than for a short domestic trip.
- Trip purpose. Business travelers often place greater value on convenience and time, while leisure travelers may be more willing to travel farther for a lower fare.
- Airline service. New nonstop destinations, increased frequency, different aircraft, or improved connections can make an airport more attractive.
- Airfare. Significant fare differences can encourage passengers to travel farther to another airport.
- Seasonality. Visitor destinations may have dramatically different passenger patterns during peak and off-peak periods.
- Competition. Changes in service at a neighboring airport can alter passenger choice throughout the region.
This means a catchment calculated several years ago—or even a catchment calculated for the airport as a whole—may not accurately represent the market for a specific route today.
Resident and Visitor Catchments Can Also Be Different
Airports in tourism and destination markets face another important consideration: residents and visitors may have very different geographic patterns.
For residents, catchment analysis asks:
Where do the people who begin their trips in our market live?
For visitors, the question becomes:
Where do travelers stay after arriving in our market?
Separating these groups can provide a more accurate picture of passenger demand, particularly for airports serving tourism destinations, seasonal communities, vacation-home markets, or geographically dispersed visitor attractions.
How FlightBI Defines Airport Catchment Areas
FlightBI uses ZIP-level passenger intelligence to help airports understand their markets based on observed traveler behavior.
Fligence ZIP-OD combines air travel information with anonymized mobility and hospitality data to estimate resident passenger origins and visitor locations at the ZIP-code level. This enables airports to analyze where passengers actually originate, how airport market share varies geographically, and where travelers are using competing airports.
Rather than assuming that everyone within a fixed radius or drive time belongs to an airport’s market, this approach allows the catchment to reflect actual passenger behavior and competitive airport choice.
Furthermore, airports can examine catchments for different routes, passenger segments, seasons, and market conditions using filters provided in the Fligence Platform.
The Bottom Line
An airport catchment area is the geographic market from which an airport attracts its passengers, but calculating that market is more complex than drawing a circle around an airport.
Radius and drive-time methods are useful for understanding geographic accessibility. Gravity models improve the analysis by incorporating airport attractiveness and competition. Behavioral methods go further by examining where passengers actually come from and which airports they actually choose.
For modern air service development and airport marketing, the most useful catchment analysis combines accessibility, airport competition, and real passenger behavior.
The result is not simply a boundary on a map. It is a better understanding of an airport’s true market—where it is strong, where passengers are leaking, and where opportunities exist for future growth.