
Discover Hidden Seasonal Air Travel Markets
Passenger traffic data tells you where travelers have flown. Second-home ownership helps explain why they may continue to travel.
Owning a vacation or seasonal home creates an enduring connection between two locations. These relationships often generate recurring leisure travel for vacations, holidays, long weekends, property maintenance, and visits from family and friends.
While second-home ownership is not a direct measure of passenger traffic, it is a valuable indicator of long-term travel relationships that may support seasonal or leisure air service.
The Fligence Second Home solution includes two complementary dashboards:
- Owners of second homes in your airport’s catchment area – identifies where owners of properties in your region live.
- Second homes owned by residents of your airport’s catchment area – identifies where local residents own second homes.
Both groups represent recurring air travel demand. Owners who live outside your region travel to their second homes and return to their primary residences, while residents of your region who own second homes elsewhere make similar round trips. As a result, both groups generate inbound and outbound passenger traffic, providing airports with valuable insight into travel demand that may not yet be apparent from historical passenger statistics alone.
Questions These Dashboard Answers
Every airport has unique market opportunities. The Fligence Second Home Dashboards help air service development professionals answer the following important questions:
1. Where do my seasonal visitors come from?
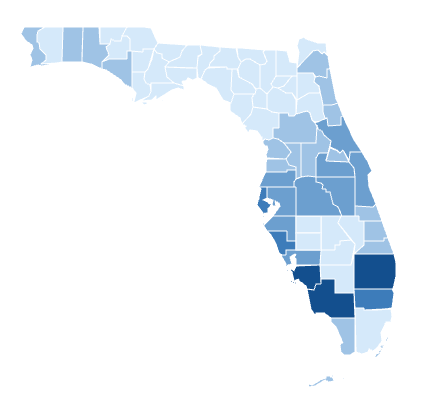
Identify where owners of second homes in your region live and where your residents own second homes, revealing the origin and destination markets with the strongest long-term travel ties to your airport.
2. Which airports are competing for these travelers?
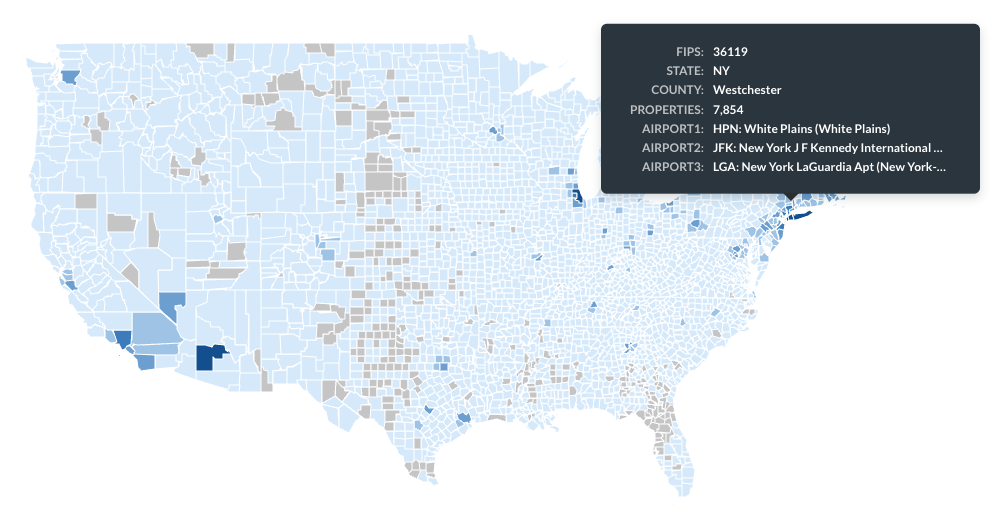
See the top commercial airports serving every county and analyze second-home ownership by airport to understand competition, airport catchments, and potential passenger leakage.
3. Which markets offer the greatest opportunity for new or expanded air service?
Identify ownership markets beyond convenient driving distance that may support new nonstop routes, additional frequencies, or seasonal service.
4. Where should we focus our marketing and airline outreach?
Prioritize origin markets with significant concentrations of second-home owners and second homes of local residents to support destination marketing campaigns, airline presentations, and strategic partnerships.
Designed Specifically for Airports
Unlike traditional property ownership databases, the Fligence Second Home Dashboards were built specifically for aviation planning.
Every feature is designed to help airport professionals understand how property ownership translates into potential air travel demand.
Airport-Based Analysis
Users can filter the analysis by both Property Airport and Owner Airport, allowing airports to study markets from either perspective.
For example:
- Which second homes are located within my airport’s catchment?
- Where do those property owners primarily live?
- Which airports currently serve those owners?
- Which competing airports share these markets?
This airport-centric workflow makes the dashboard especially valuable for air service development.
Visualize Markets at Every Geographic Level
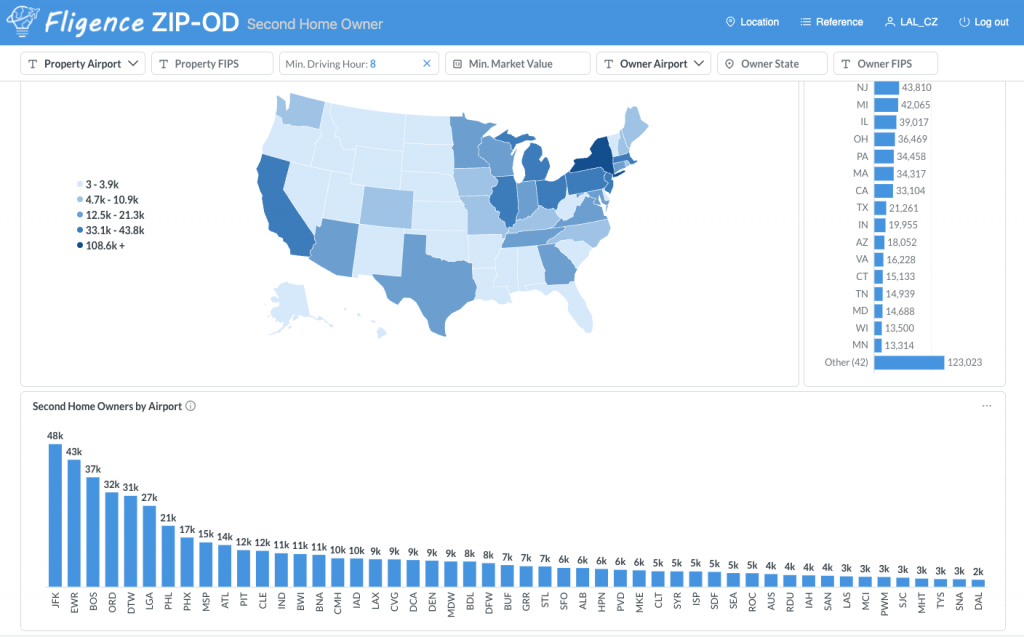
The dashboards provide interactive maps at both the county and state levels, allowing users to quickly move from a national overview to detailed local analysis.
Users can visualize:
- Second-home property locations
- Owner residence locations
- State-level ownership patterns / second home patterns
- County-level ownership concentrations / second home concentrations
- Top owner states / second home states
- Top owner counties / second home counties
Interactive maps and rankings make it easy to identify where the strongest ownership relationships exist.
Powerful Filters for Aviation Market Analysis
The dashboards include flexible filters that allow users to focus on the ownership relationships most relevant to their analysis.
Property Airport
Analyze second homes served by a selected commercial airport.
Owner Airport
Identify where property owners begin their trips.
Property County or State
Focus on specific destination markets.
Owner County or State
Identify the largest origin markets.
Minimum Driving Time
Exclude ownership relationships where driving is the preferred mode of transportation and focus on markets where flying becomes more practical.
Minimum Property Market Value
Analyze ownership patterns by property value to better understand different visitor segments.
These filters allow airports to quickly narrow millions of property records into meaningful aviation insights.
Ideal Applications
The dashboard supports a wide range of airport planning activities, including:
- Air Service Development
- Seasonal Route Planning
- Catchment Analysis
- Passenger Leakage Analysis
- Destination Marketing
- Tourism Planning
- Airline Business Case Development
- Regional Economic Development
- Airport Strategic Planning
Why FlightBI?
FlightBI combines nationwide property ownership data with proprietary aviation intelligence to create a tool purpose-built for airport professionals.
Unlike generic real estate analytics platforms, the Fligence Second Home Dashboards help airports understand not only where second homes are located, but also how those locations connect to the commercial aviation network.
The result is actionable intelligence that supports smarter decisions for air service development, destination marketing, and long-term airport growth.
Request a Demonstration
Discover how second-home ownership patterns can reveal hidden seasonal travel markets and strengthen your airport’s air service strategy.
Contact FlightBI to schedule a live demonstration of the Fligence Second Home Dashboards and see how airports are using property ownership analytics to uncover new opportunities for growth.