Traffic and fare data by airline and route can provide valuable insights into market trends, demand, and competition. By analyzing this data, airlines can optimize their pricing strategies, plan their capacity, and make informed decisions about their route network. The data can also be used for market and competitive analysis, helping airlines identify profitable routes and gain a competitive advantage.
Based on initial true O&D level data from FlightBI released this week, both US domestic and US international air traffic experienced a decline from August to September. Meanwhile, average airfares fell slightly.
Volume Trend
The latest Origin and Destination (O&D) data indicates a return to traditional passenger volume trends in the US air market. In October 2023, US domestic air travel recorded 53.8 million passengers, a significant 10% rise from the 48.8 million in September, largely due to seasonal influences. Notably, this figure exceeds pre-pandemic levels by 4.5%, comparing favorably to the 51.5 million passengers in October 2019. Meanwhile, the international segment of the US air market also showed growth, increasing slightly from 19.1 million to 19.4 million passengers.
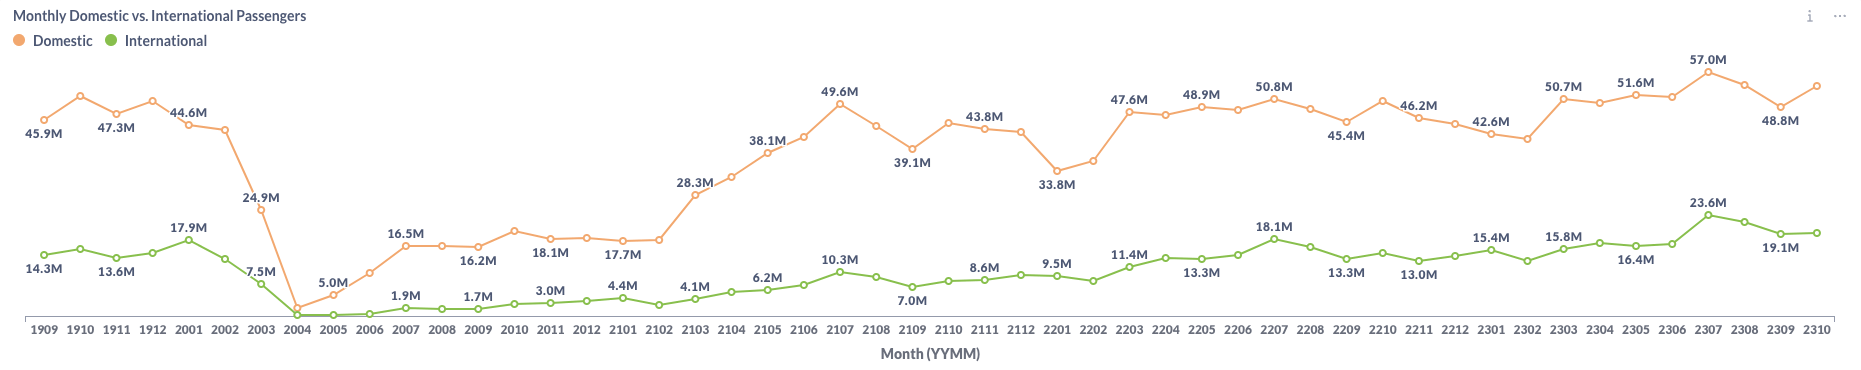
Figure 1: US Domestic and International Air Traffic by Month
Airfare Trend
The latest data indicates a nuanced trend in airfares. While the average gross fare for air travel exhibited a slight increase, rising from $211 in September to $215 in October, the average net fare similarly showed a modest decrease, shifting from $181 in September to $184 in October.
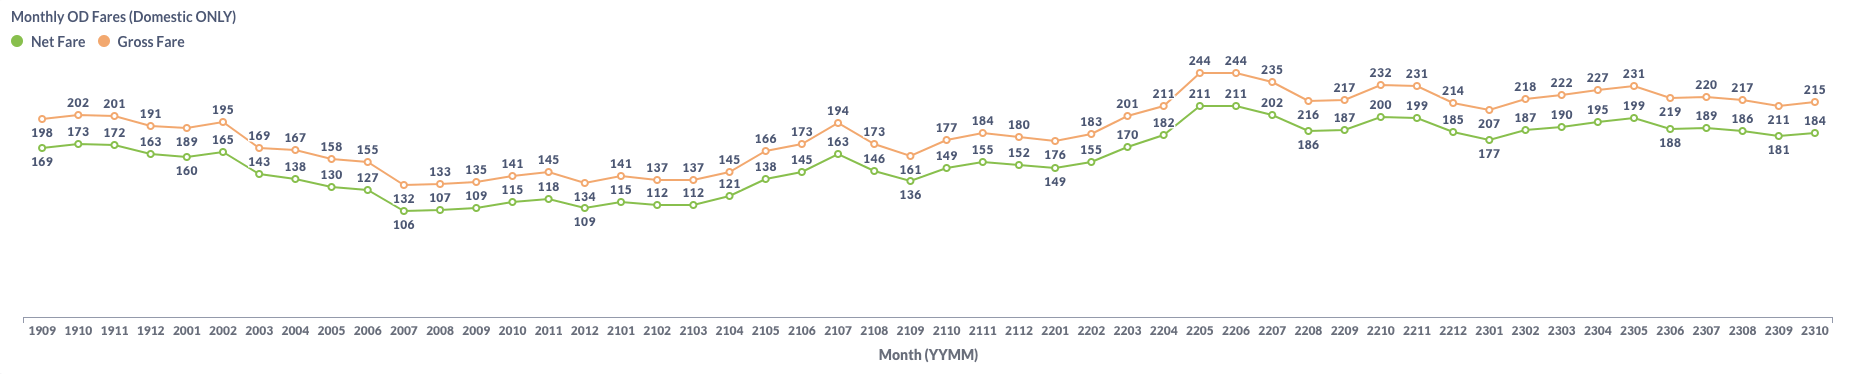
Figure 2: US Domestic Average Airfare by Month
Load Factor Trend
In October, major US airlines saw a notable increase in their average load factor, climbing to 79.5% from 77.6% in September, as detailed in Figure 4. This uptick was primarily driven by American Airlines (AA), Alaska Airlines (AS), and JetBlue (B6).
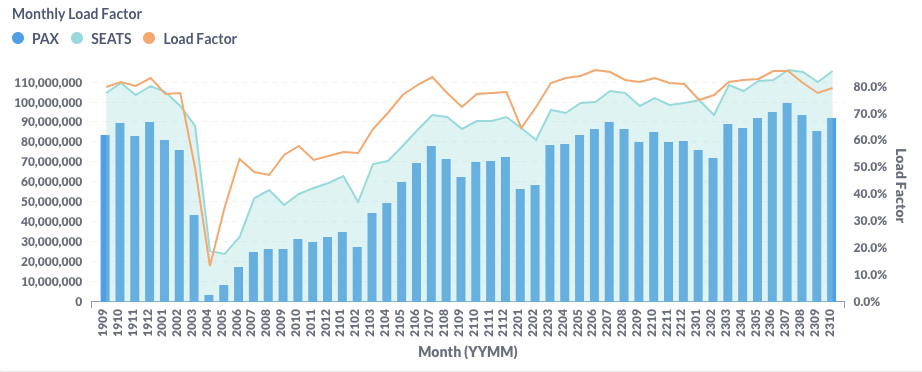
Figure 3: US Airlines’ Average Load Factor by Month
Month Over Month Comparison
From September to October 2023, nearly all major US airlines, with the exception of Alaska Airlines (AS), reported an increase in traffic, aligning with typical seasonal trends. Notably, Allegiant (G4) and Spirit (NK) led with significant traffic growth at 37.6% and 16.6%. American Airlines (AA) and Southwest Airlines (WN) also recorded notable increases of 6.2% and 7.6%, respectively.
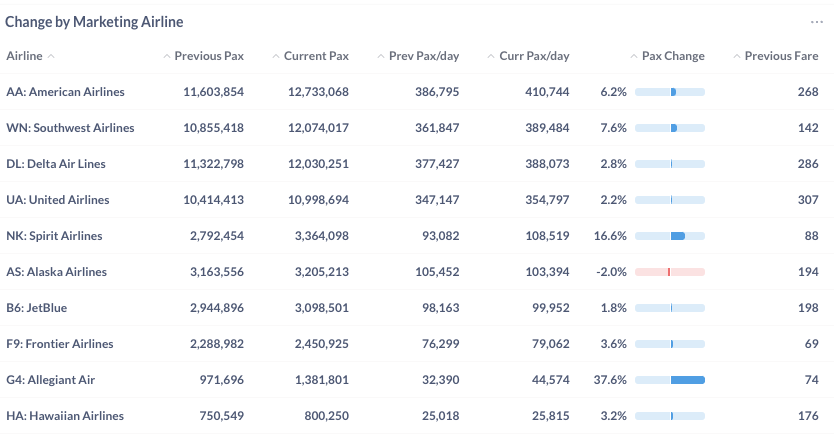
Figure 4: Air Traffic by Dominant Marketing Airlines in September 2023 (Previous) vs. October 2023 (Current)
During this period, most of the major airports saw an increase in daily passenger traffic compared to the previous month. Notably, Orlando (MCO) and Las Vegas (LAS) each reported a rise exceeding 10%. In contrast, Seattle (SEA) experienced a decrease of 7%.
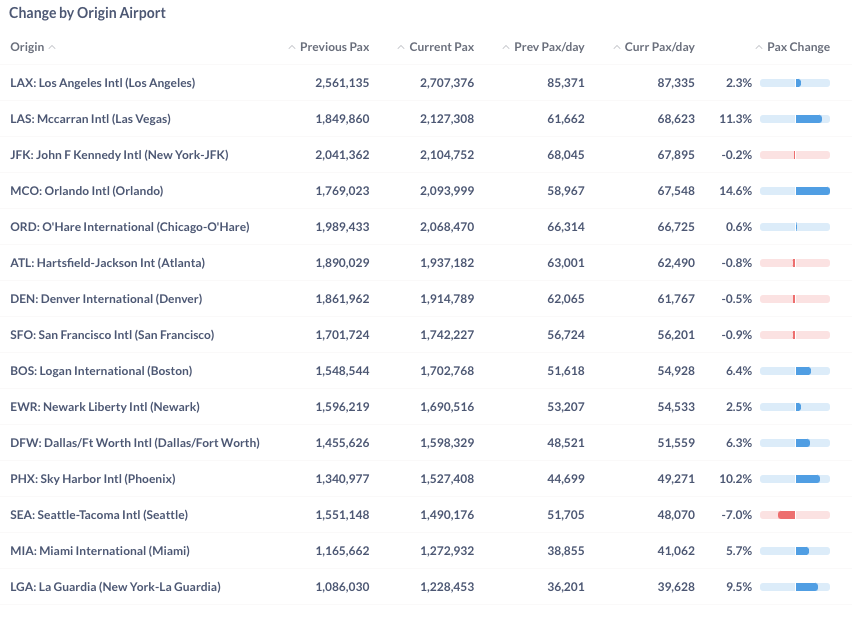
Figure 5: Air Traffic by Top Origin Airports in September 2023 (Previous) vs. October 2023 (Current)
Year Over Year Comparison
In a year-over-year analysis, comparing October 2023 to October 2022, all major US airlines, with the exception of JetBlue (B6), demonstrated positive growth. Leading this upward trend were Frontier (F9), United (UA), and Delta (DL), which recorded significant increases of 15.1%, 14.4%, and 12.5%, respectively.
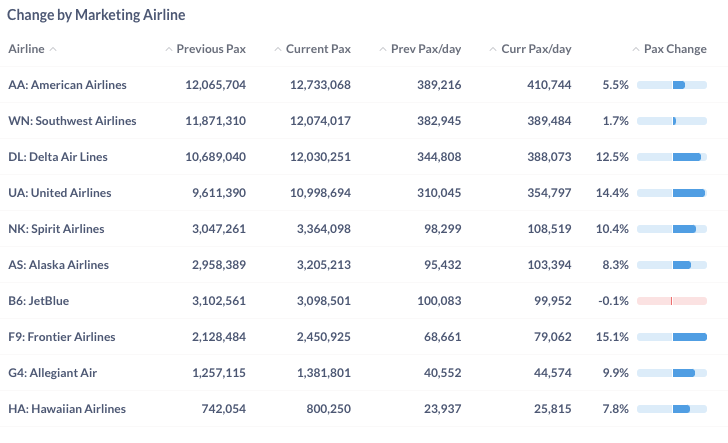
Figure 6: Air Traffic by Dominant Marketing Airlines in October 2023 (Current) vs. October 2022 (Previous)
Between October 2022 and October 2023, numerous leading airports exhibited growth surpassing 10%. Remarkably, New York’s JFK and Los Angeles International Airport (LAX) were at the forefront of this year-over-year growth, with each airport registering an identical increase of 16.4%.
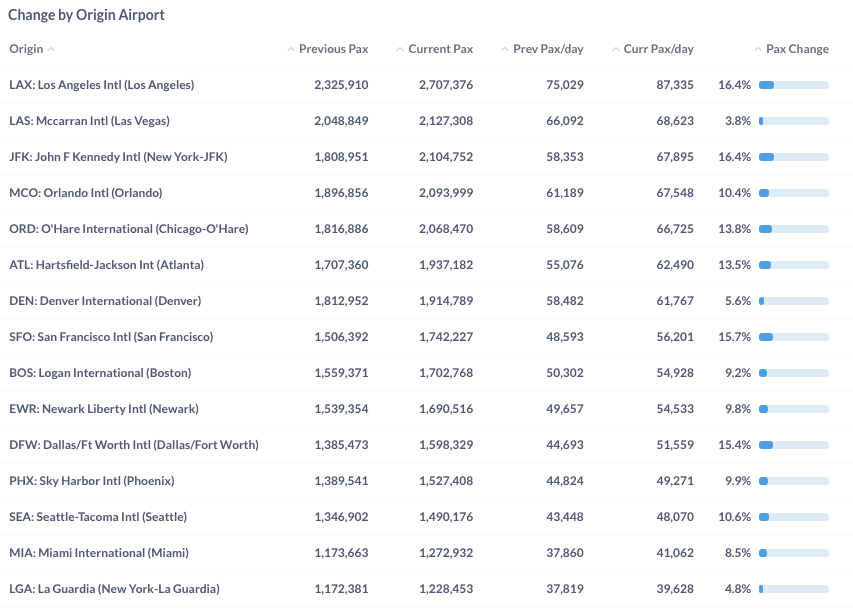
Figure 7: Air Traffic by Top Origin Airport in September 2023 (Current) vs. September 2022 (Previous)
For more detailed information on traffic and fares by route and airline, please contact service@flightbi.com or request a demo of Fligence USOD. They will be able to provide you with customized information to meet your specific needs and requirements.